Below are the initial 2018 MLS season forecasts using data from games through March 4, 2018.
*I’ve made a change to the model to factor in distance traveled to include USL, legacy NASL, and NWSL clubs in addition to MLS. However, distances are treated differently for each league to account for the likely difference in relaxation/ease-of-travel that different levels can afford to provide their players.
Interactive Charts
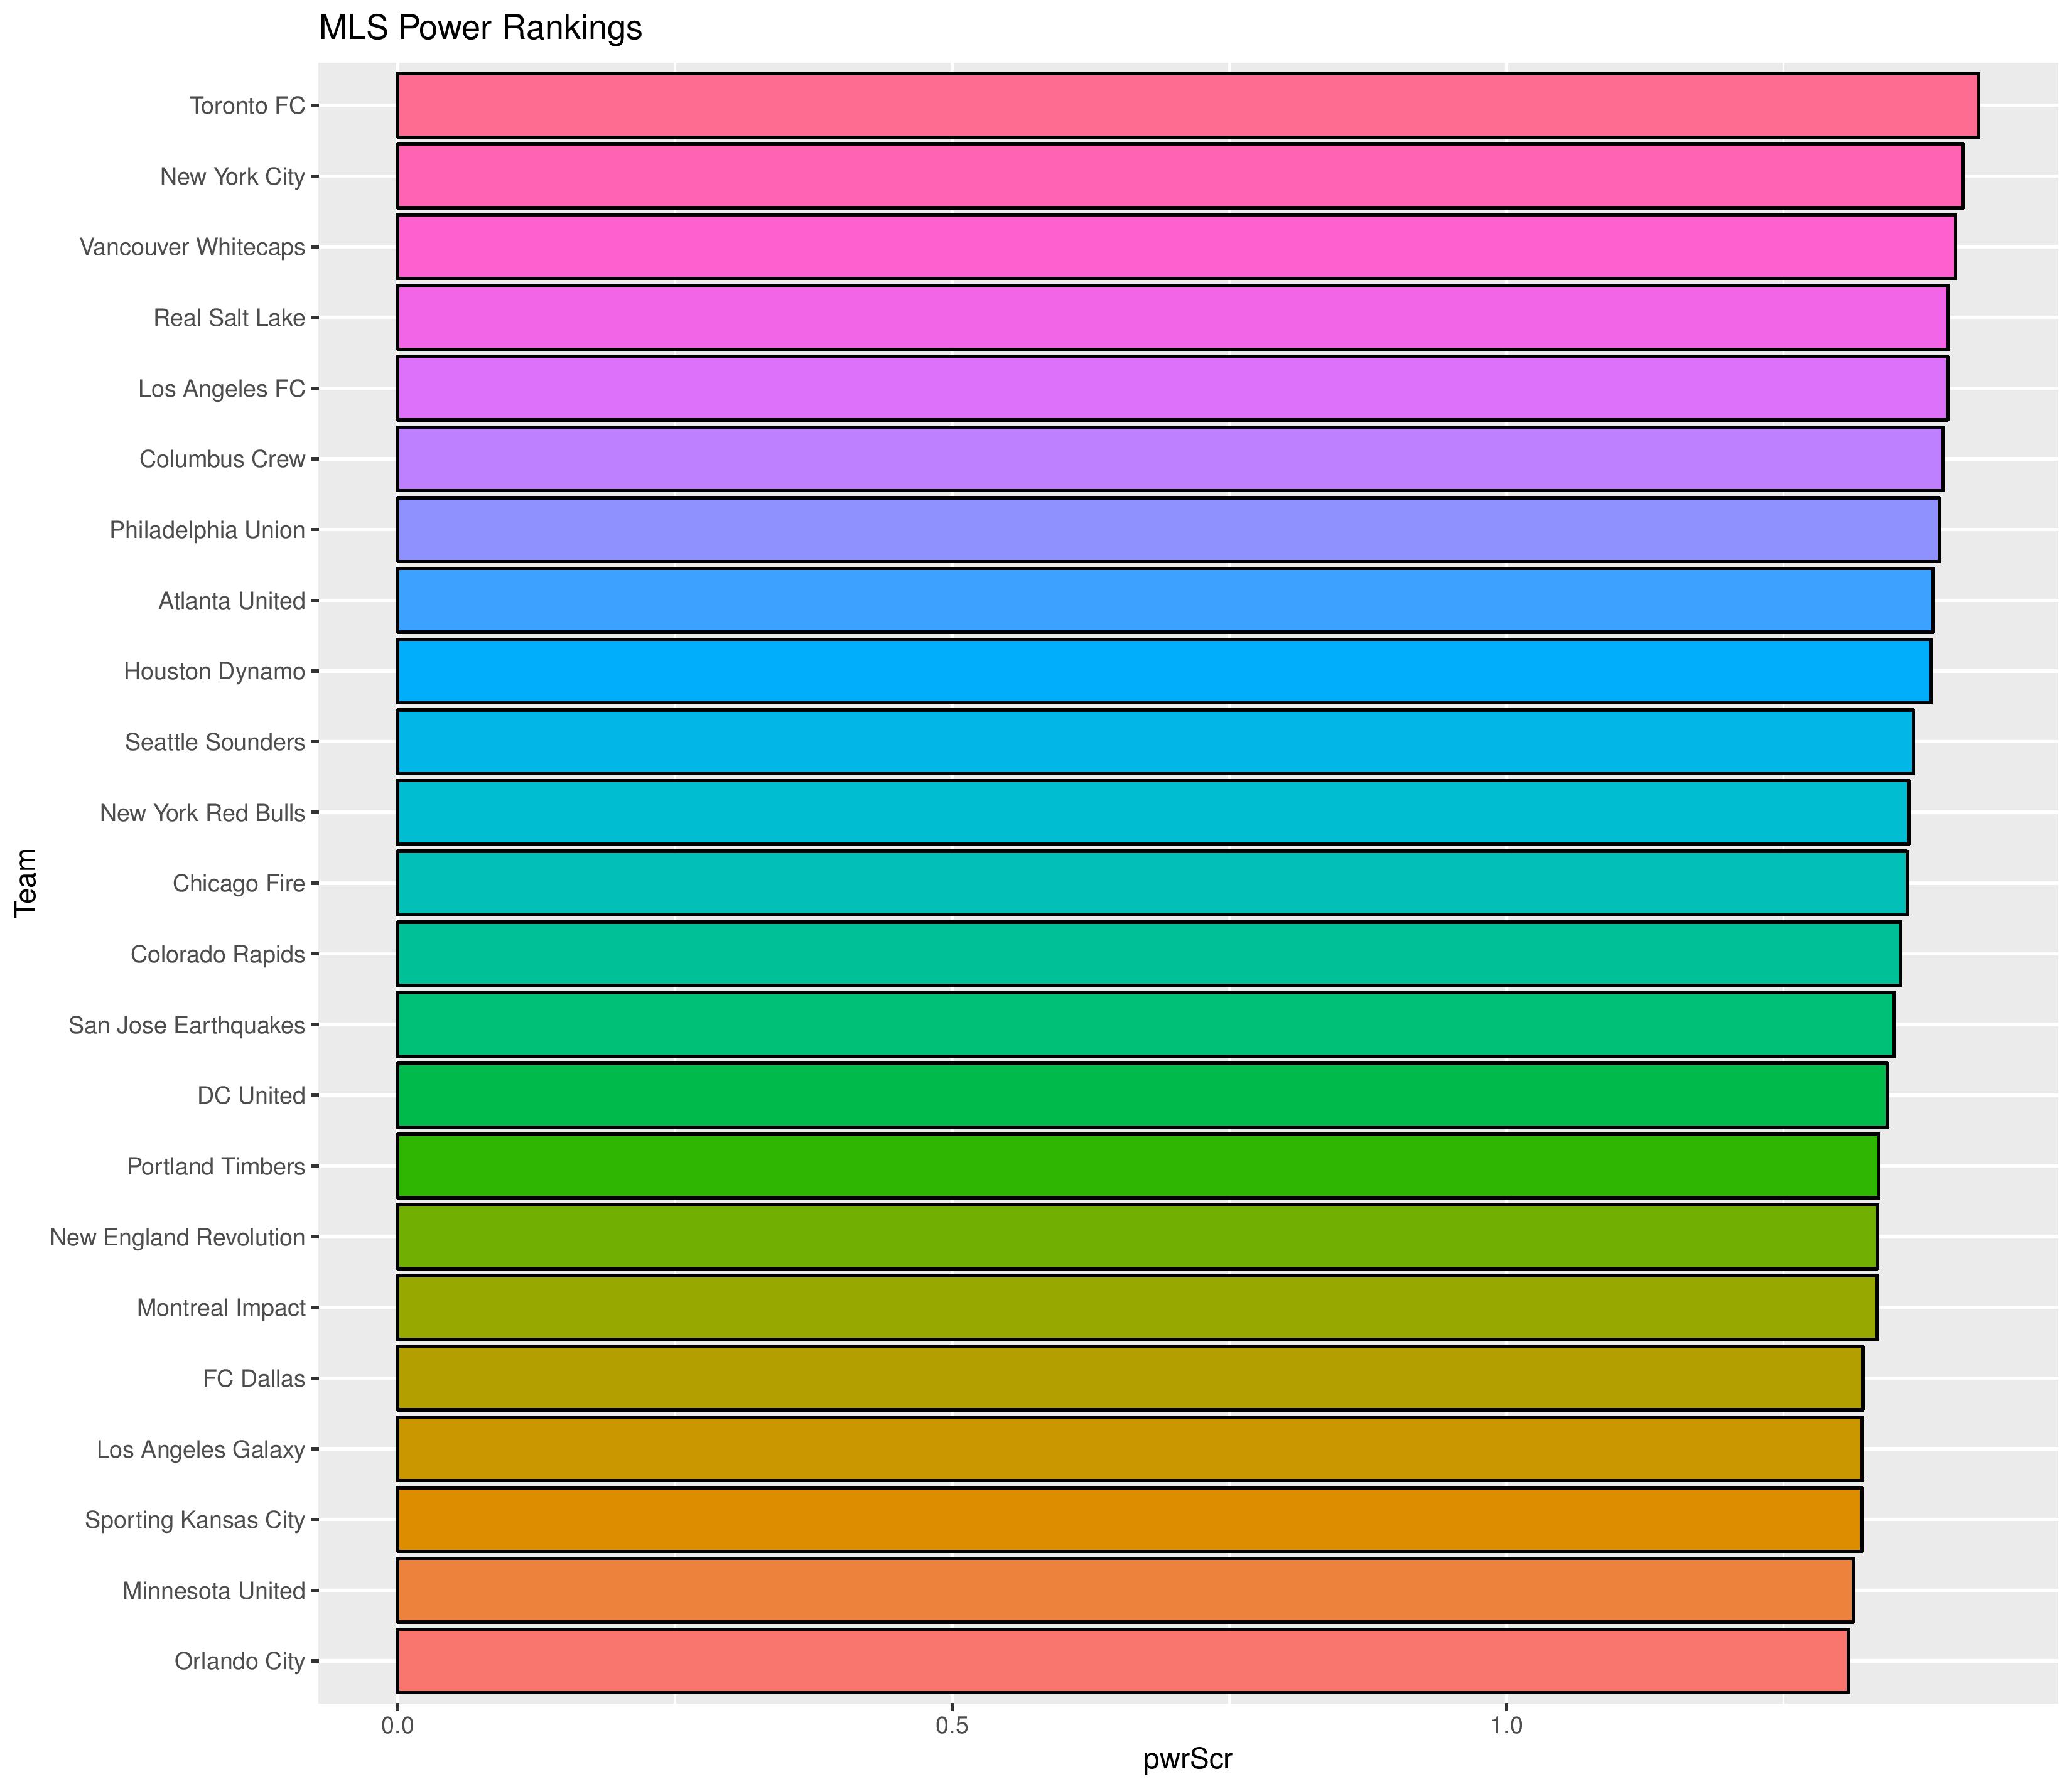
Power Rankings
The “Power Rankings” we concoct are the actual “strength” of the team according to competitive expectations. They are computed showing average expected points result if every team in MLS played every team both home and away.
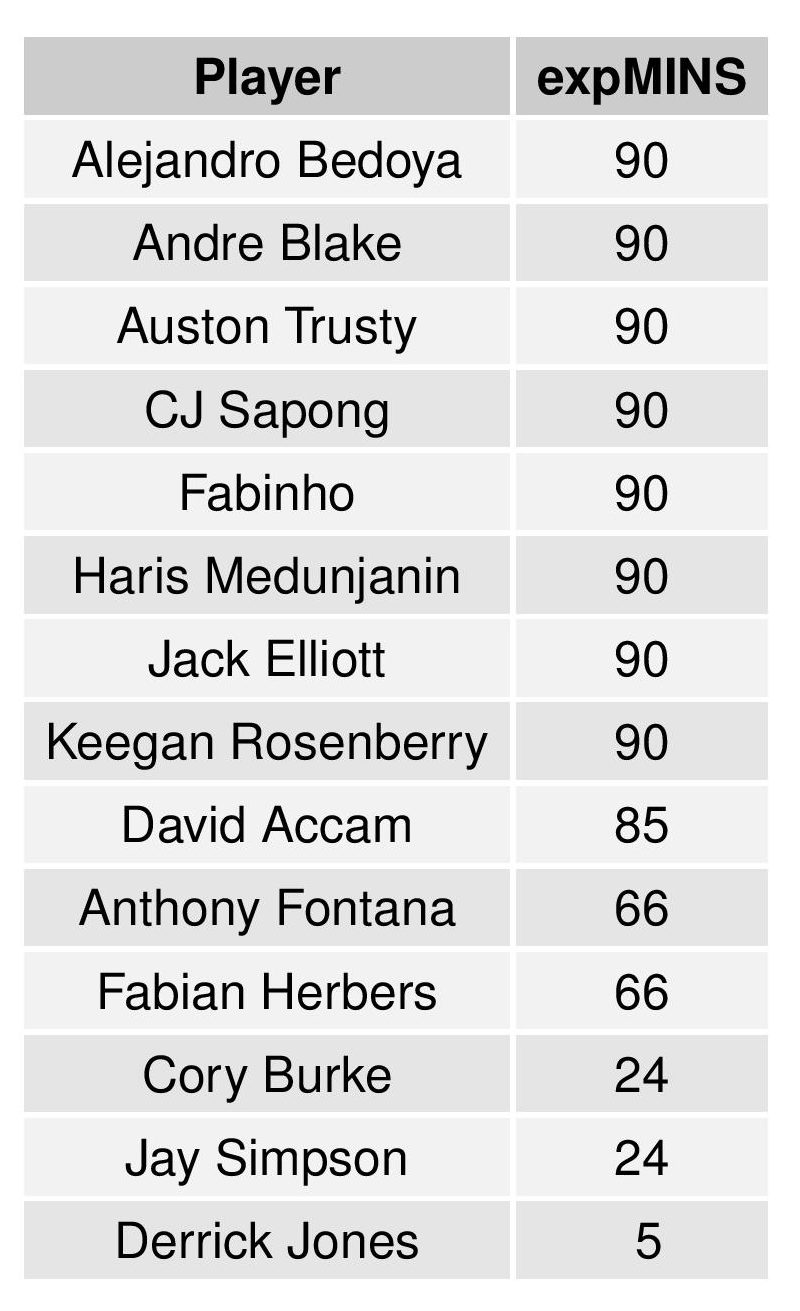
SEBA has Philadelphia in 7th.
Currently, Philadelphia’s performance expectation is set by the following distribution of minutes:
Philadelphia +/- for 2018
Philadelphia Plus/Minus
| plyr | NetGoals | PlusGoals | MinusGoals | MINS | NetGoalsPer90 | PlusGoalsPer90 | MinusGoalsPer90 |
|---|---|---|---|---|---|---|---|
| Cory Burke | 6 | 29 | 23 | 1427 | 0.378 | 1.829 | 1.451 |
| Alejandro Bedoya | 5 | 49 | 44 | 2777 | 0.162 | 1.588 | 1.426 |
| Jay Simpson | 4 | 4 | 0 | 158 | 2.278 | 2.278 | 0 |
| Mark McKenzie | 3 | 30 | 27 | 1629 | 0.166 | 1.657 | 1.492 |
| Raymon Gaddis | 3 | 43 | 40 | 2298 | 0.117 | 1.684 | 1.567 |
| John McCarthy | 2 | 2 | 0 | 90 | 2 | 2 | 0 |
| Keegan Rosenberry | 2 | 46 | 44 | 2773 | 0.065 | 1.493 | 1.428 |
| Olivier Mbaizo | 1 | 1 | 0 | 85 | 1.059 | 1.059 | 0 |
| Derrick Jones | 1 | 5 | 4 | 385 | 0.234 | 1.169 | 0.935 |
| Haris Medunjanin | 1 | 41 | 40 | 2530 | 0.036 | 1.458 | 1.423 |
| Warren Creavalle | 0 | 11 | 11 | 681 | 0 | 1.454 | 1.454 |
| Marcus Epps | 0 | 10 | 10 | 609 | 0 | 1.478 | 1.478 |
| Auston Trusty | -1 | 49 | 50 | 3060 | -0.029 | 1.441 | 1.471 |
| Borek Dockal | -1 | 37 | 38 | 2397 | -0.038 | 1.389 | 1.427 |
| Anthony Fontana | -1 | 1 | 2 | 99 | -0.909 | 0.909 | 1.818 |
| Fafa Picault | -2 | 40 | 42 | 2190 | -0.082 | 1.644 | 1.726 |
| Andre Blake | -3 | 47 | 50 | 2970 | -0.091 | 1.424 | 1.515 |
| Ilsinho | -3 | 13 | 16 | 985 | -0.274 | 1.188 | 1.462 |
| Fabinho | -3 | 7 | 10 | 714 | -0.378 | 0.882 | 1.261 |
| Fabian Herbers | -3 | 4 | 7 | 428 | -0.631 | 0.841 | 1.472 |
| David Accam | -4 | 17 | 21 | 1213 | -0.297 | 1.261 | 1.558 |
| Matthew Real | -4 | 1 | 5 | 236 | -1.525 | 0.381 | 1.907 |
| Jack Elliott | -5 | 18 | 23 | 1430 | -0.315 | 1.133 | 1.448 |
| CJ Sapong | -6 | 31 | 37 | 2321 | -0.233 | 1.202 | 1.435 |
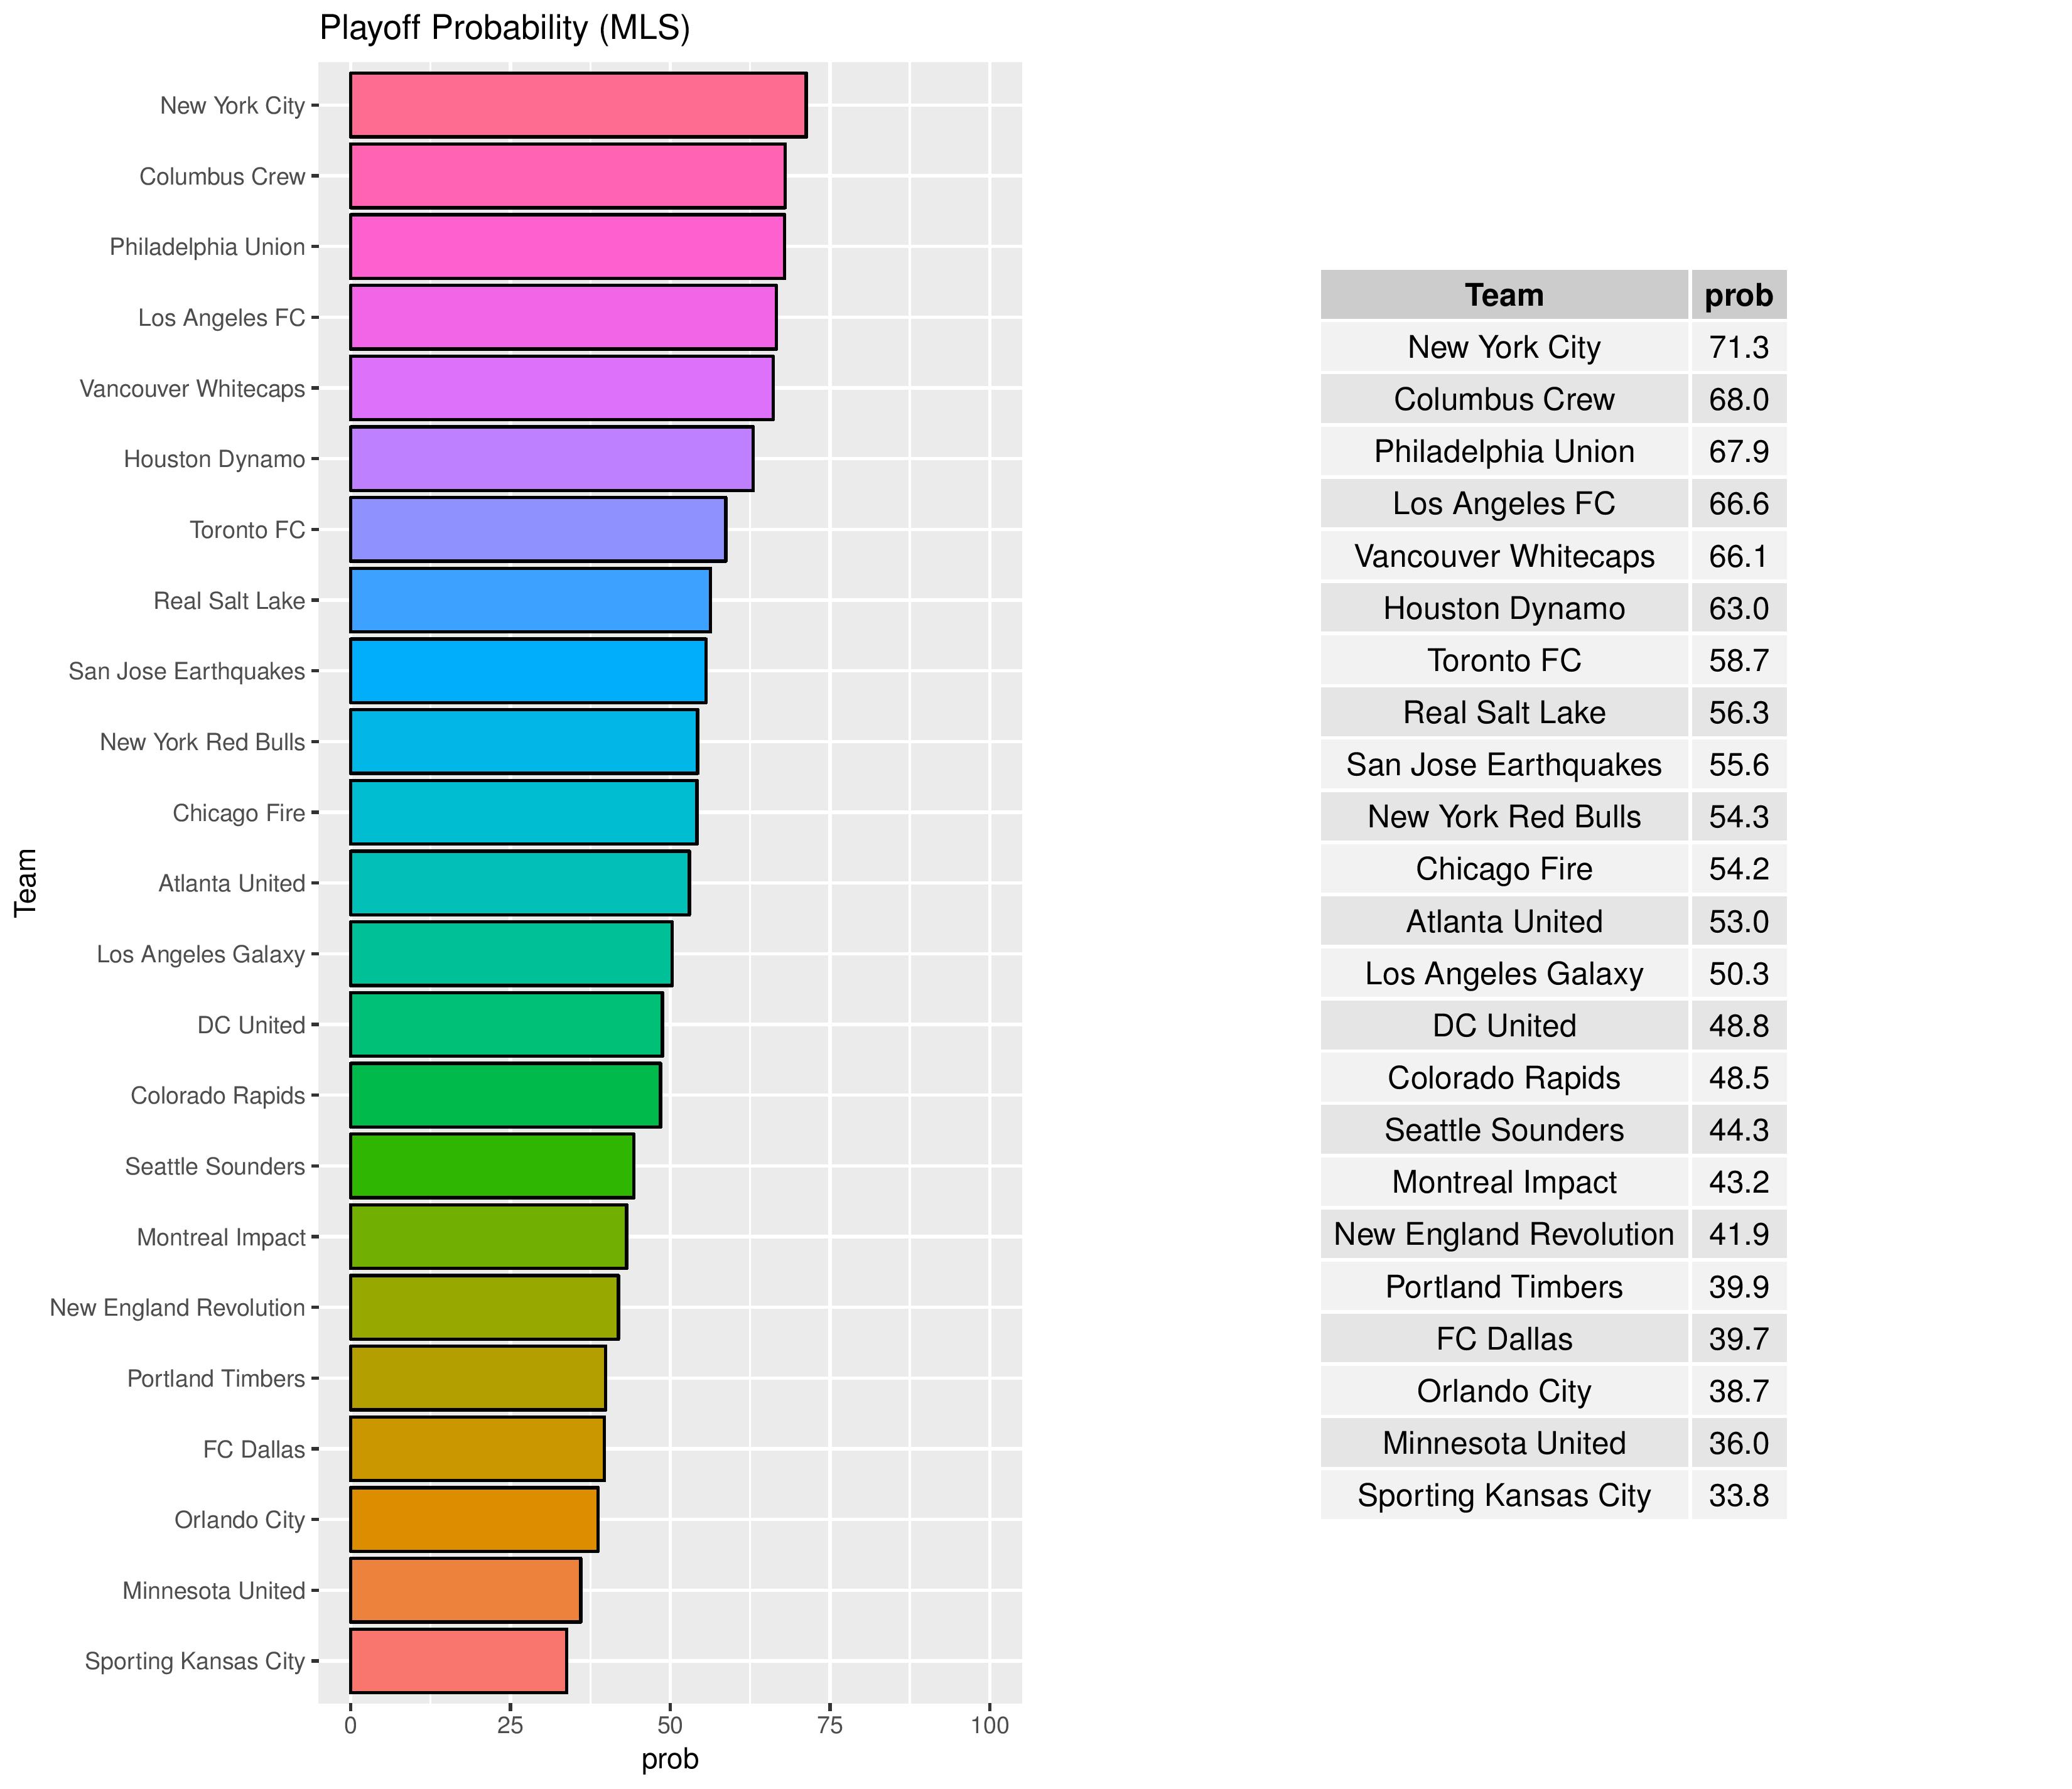
Playoffs probability and more
Philadelphia has increased from a 53.1% to a 67.9% chance of making the playoffs.
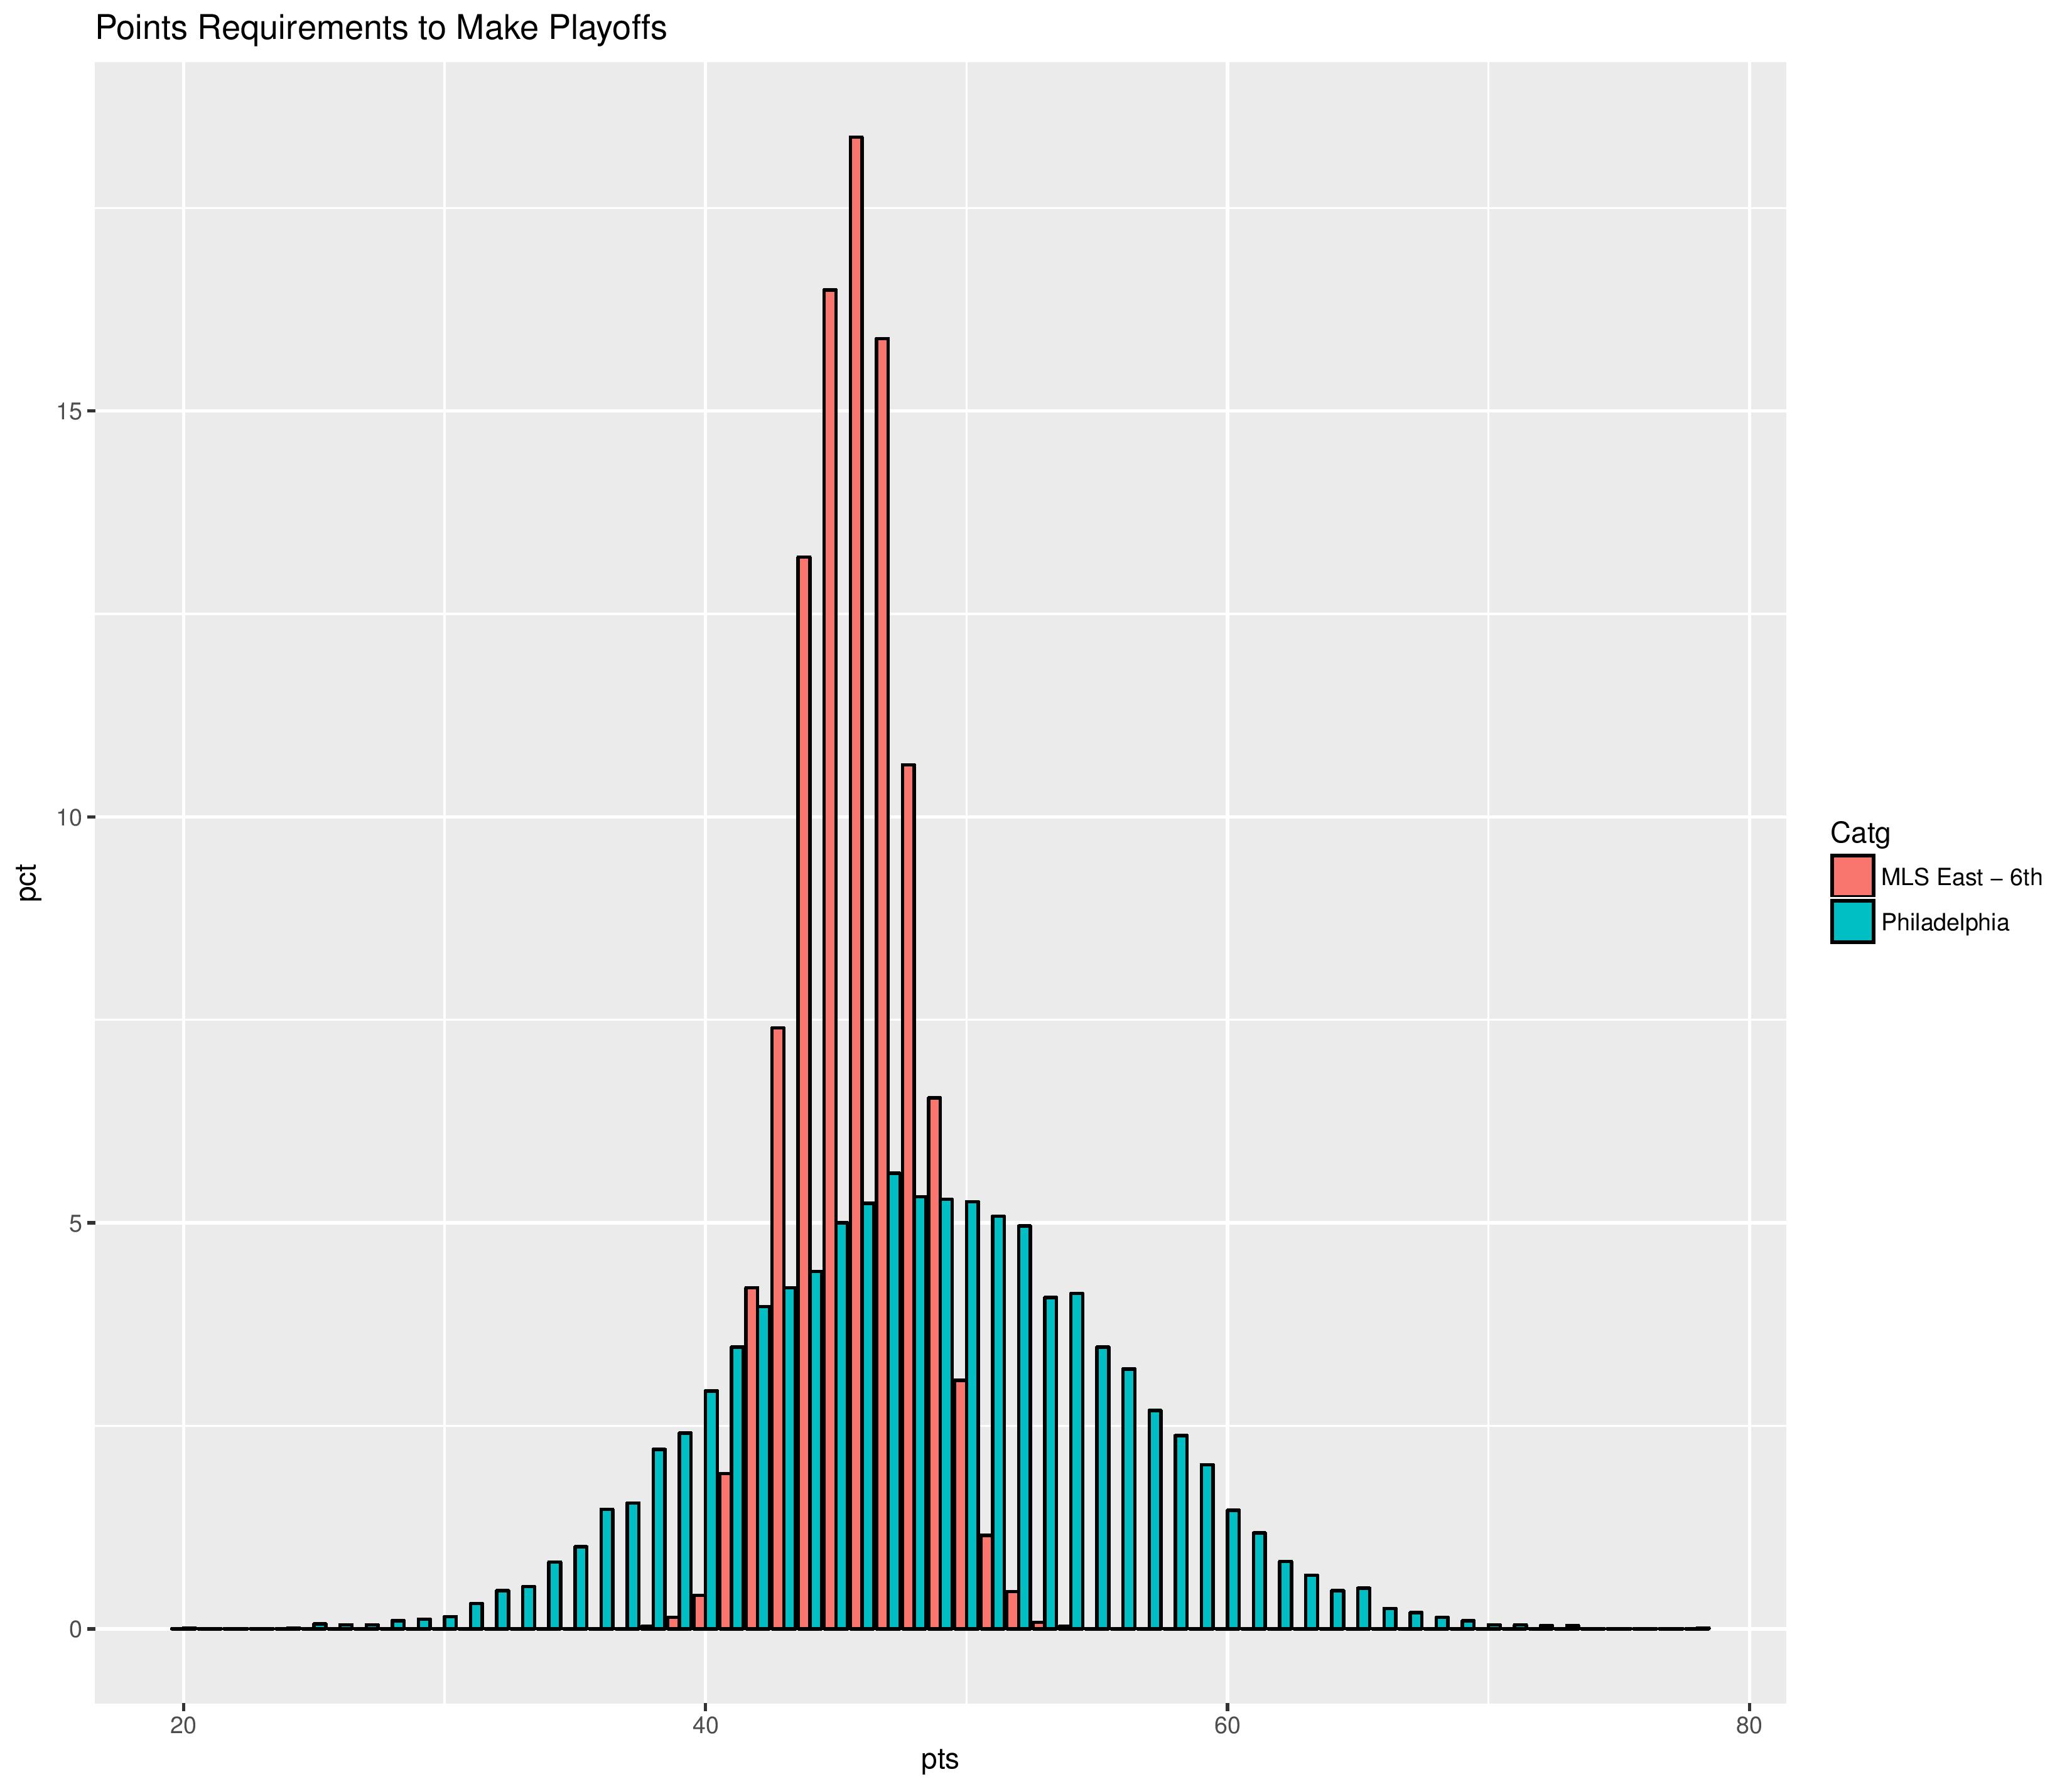
Next is the distribution of Philadelphia’s points against the MLS East’s sixth seed in all the simulations.
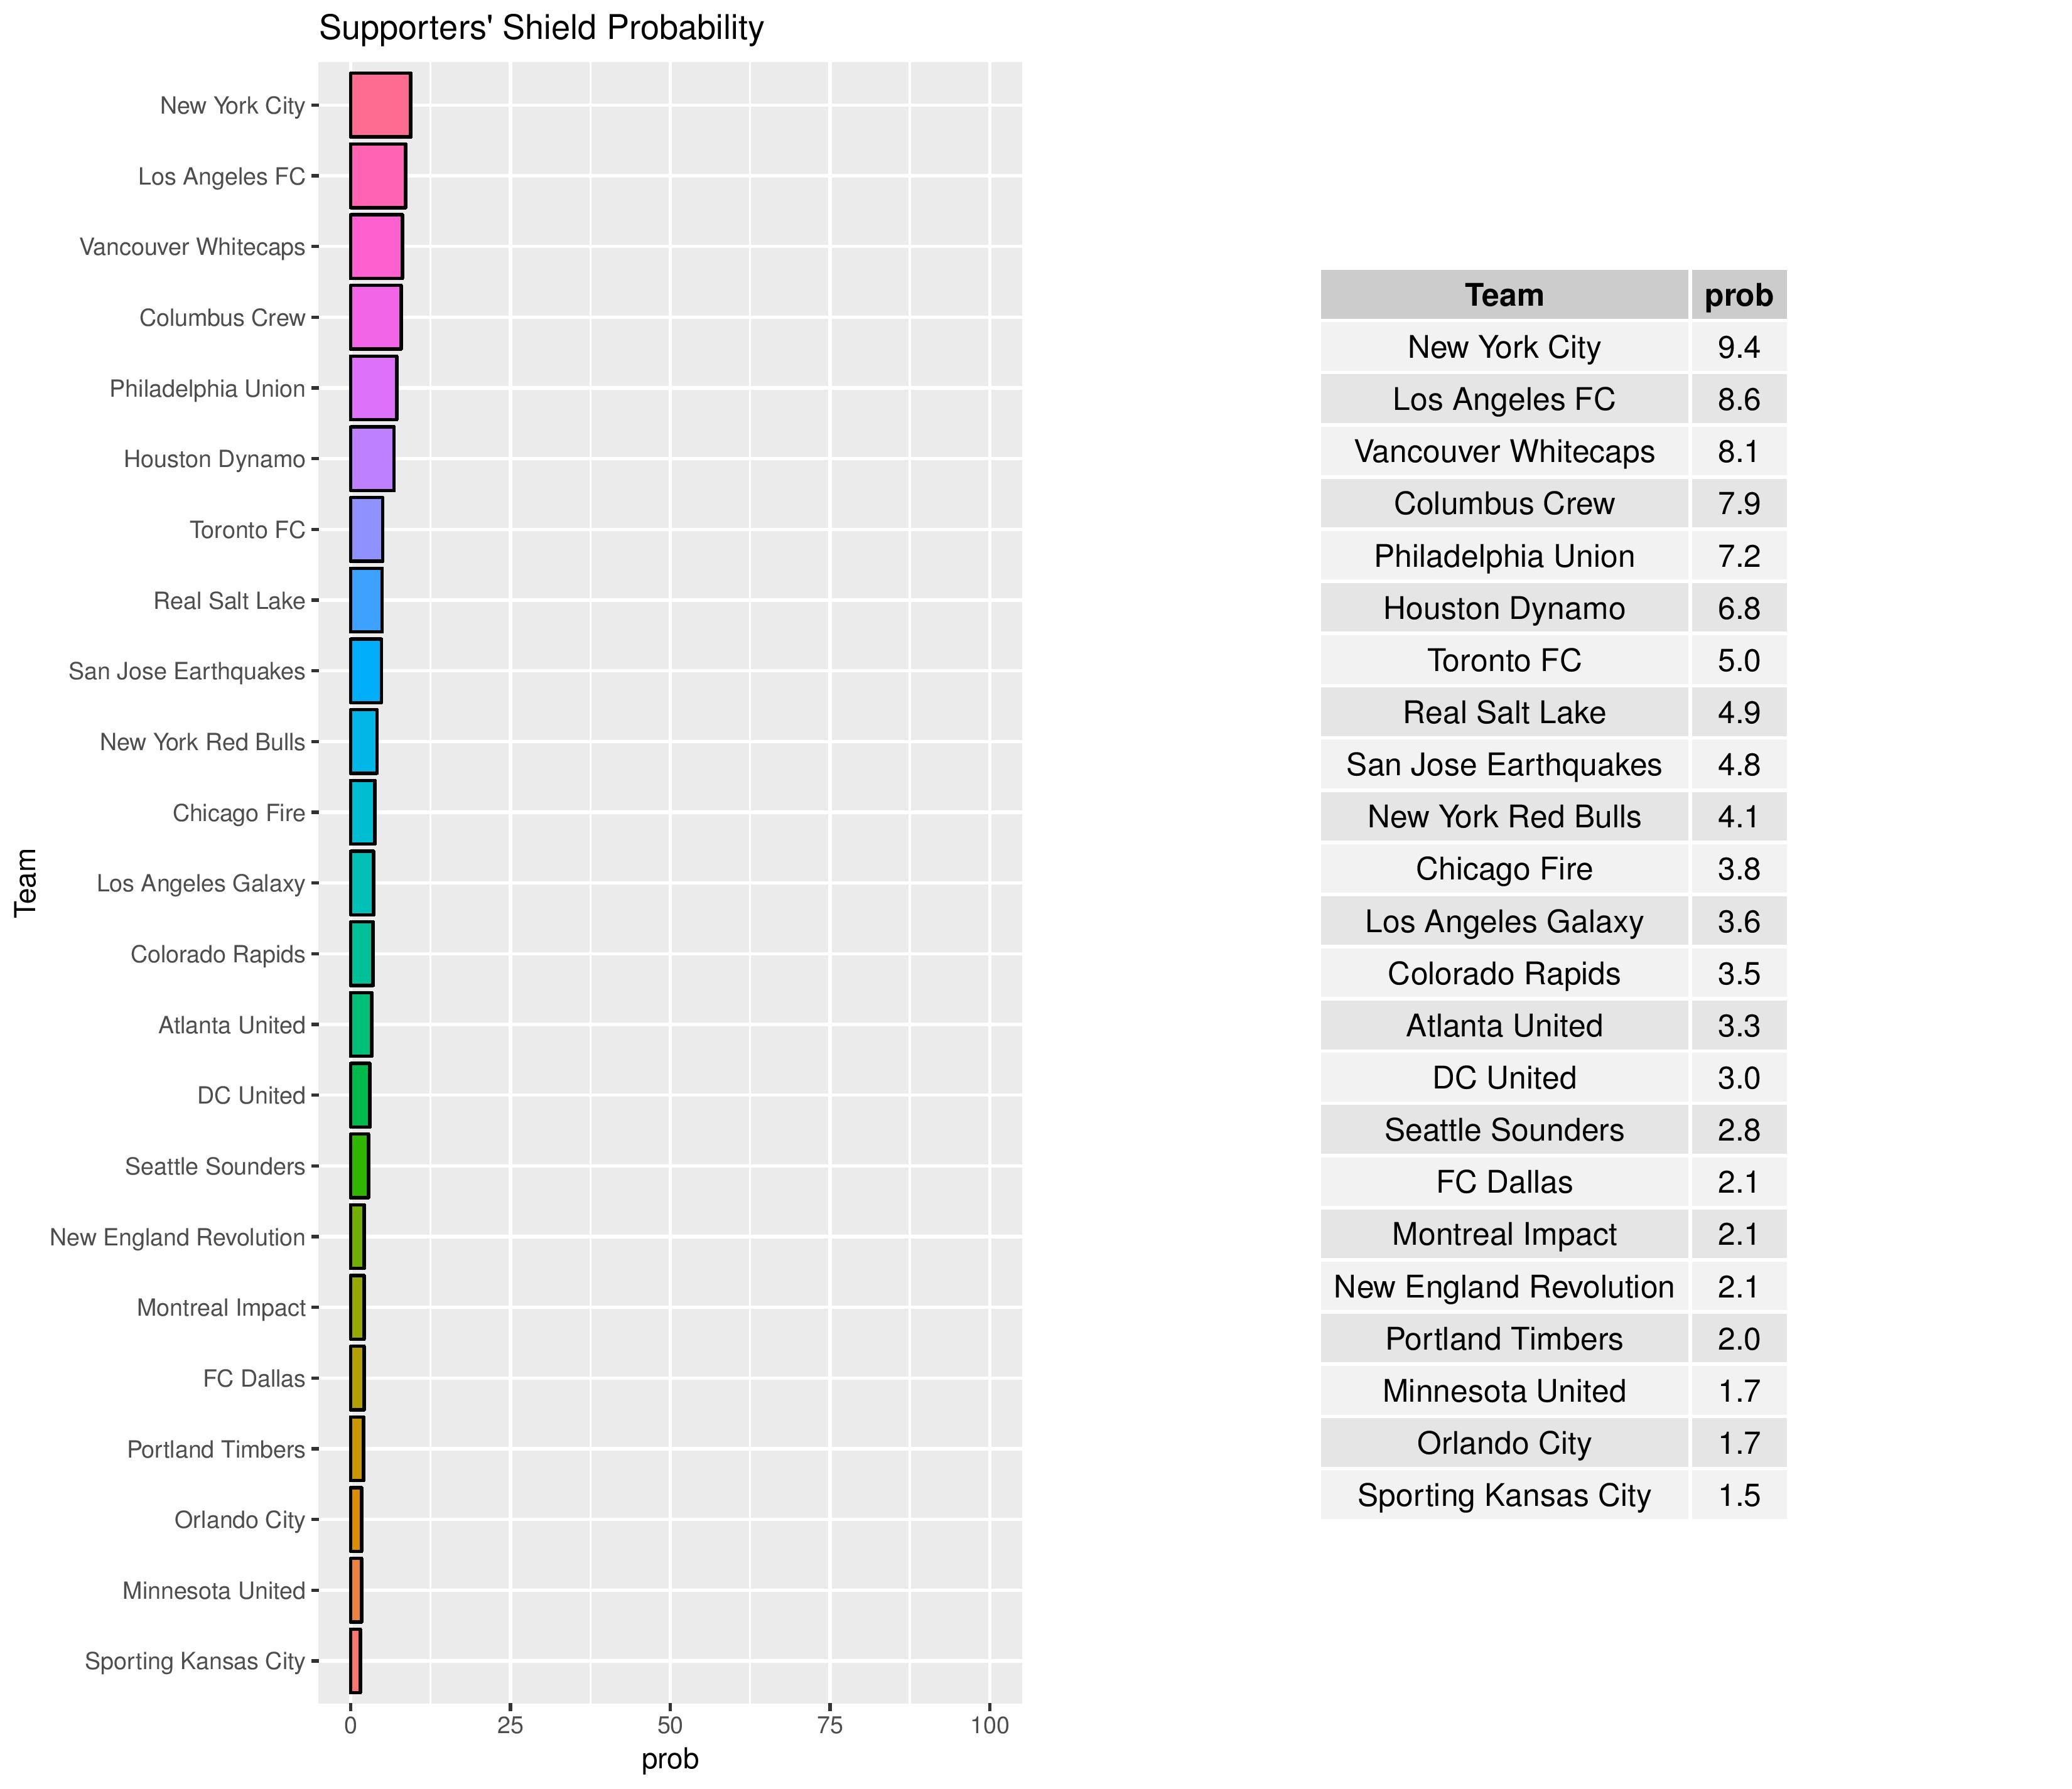
Philadelphia increased from a 3.2% to a 7.2% chance of winning the Supporters’ Shield.
The Union has increased from a 3.4% to a 5.8% chance of winning the MLS Cup.

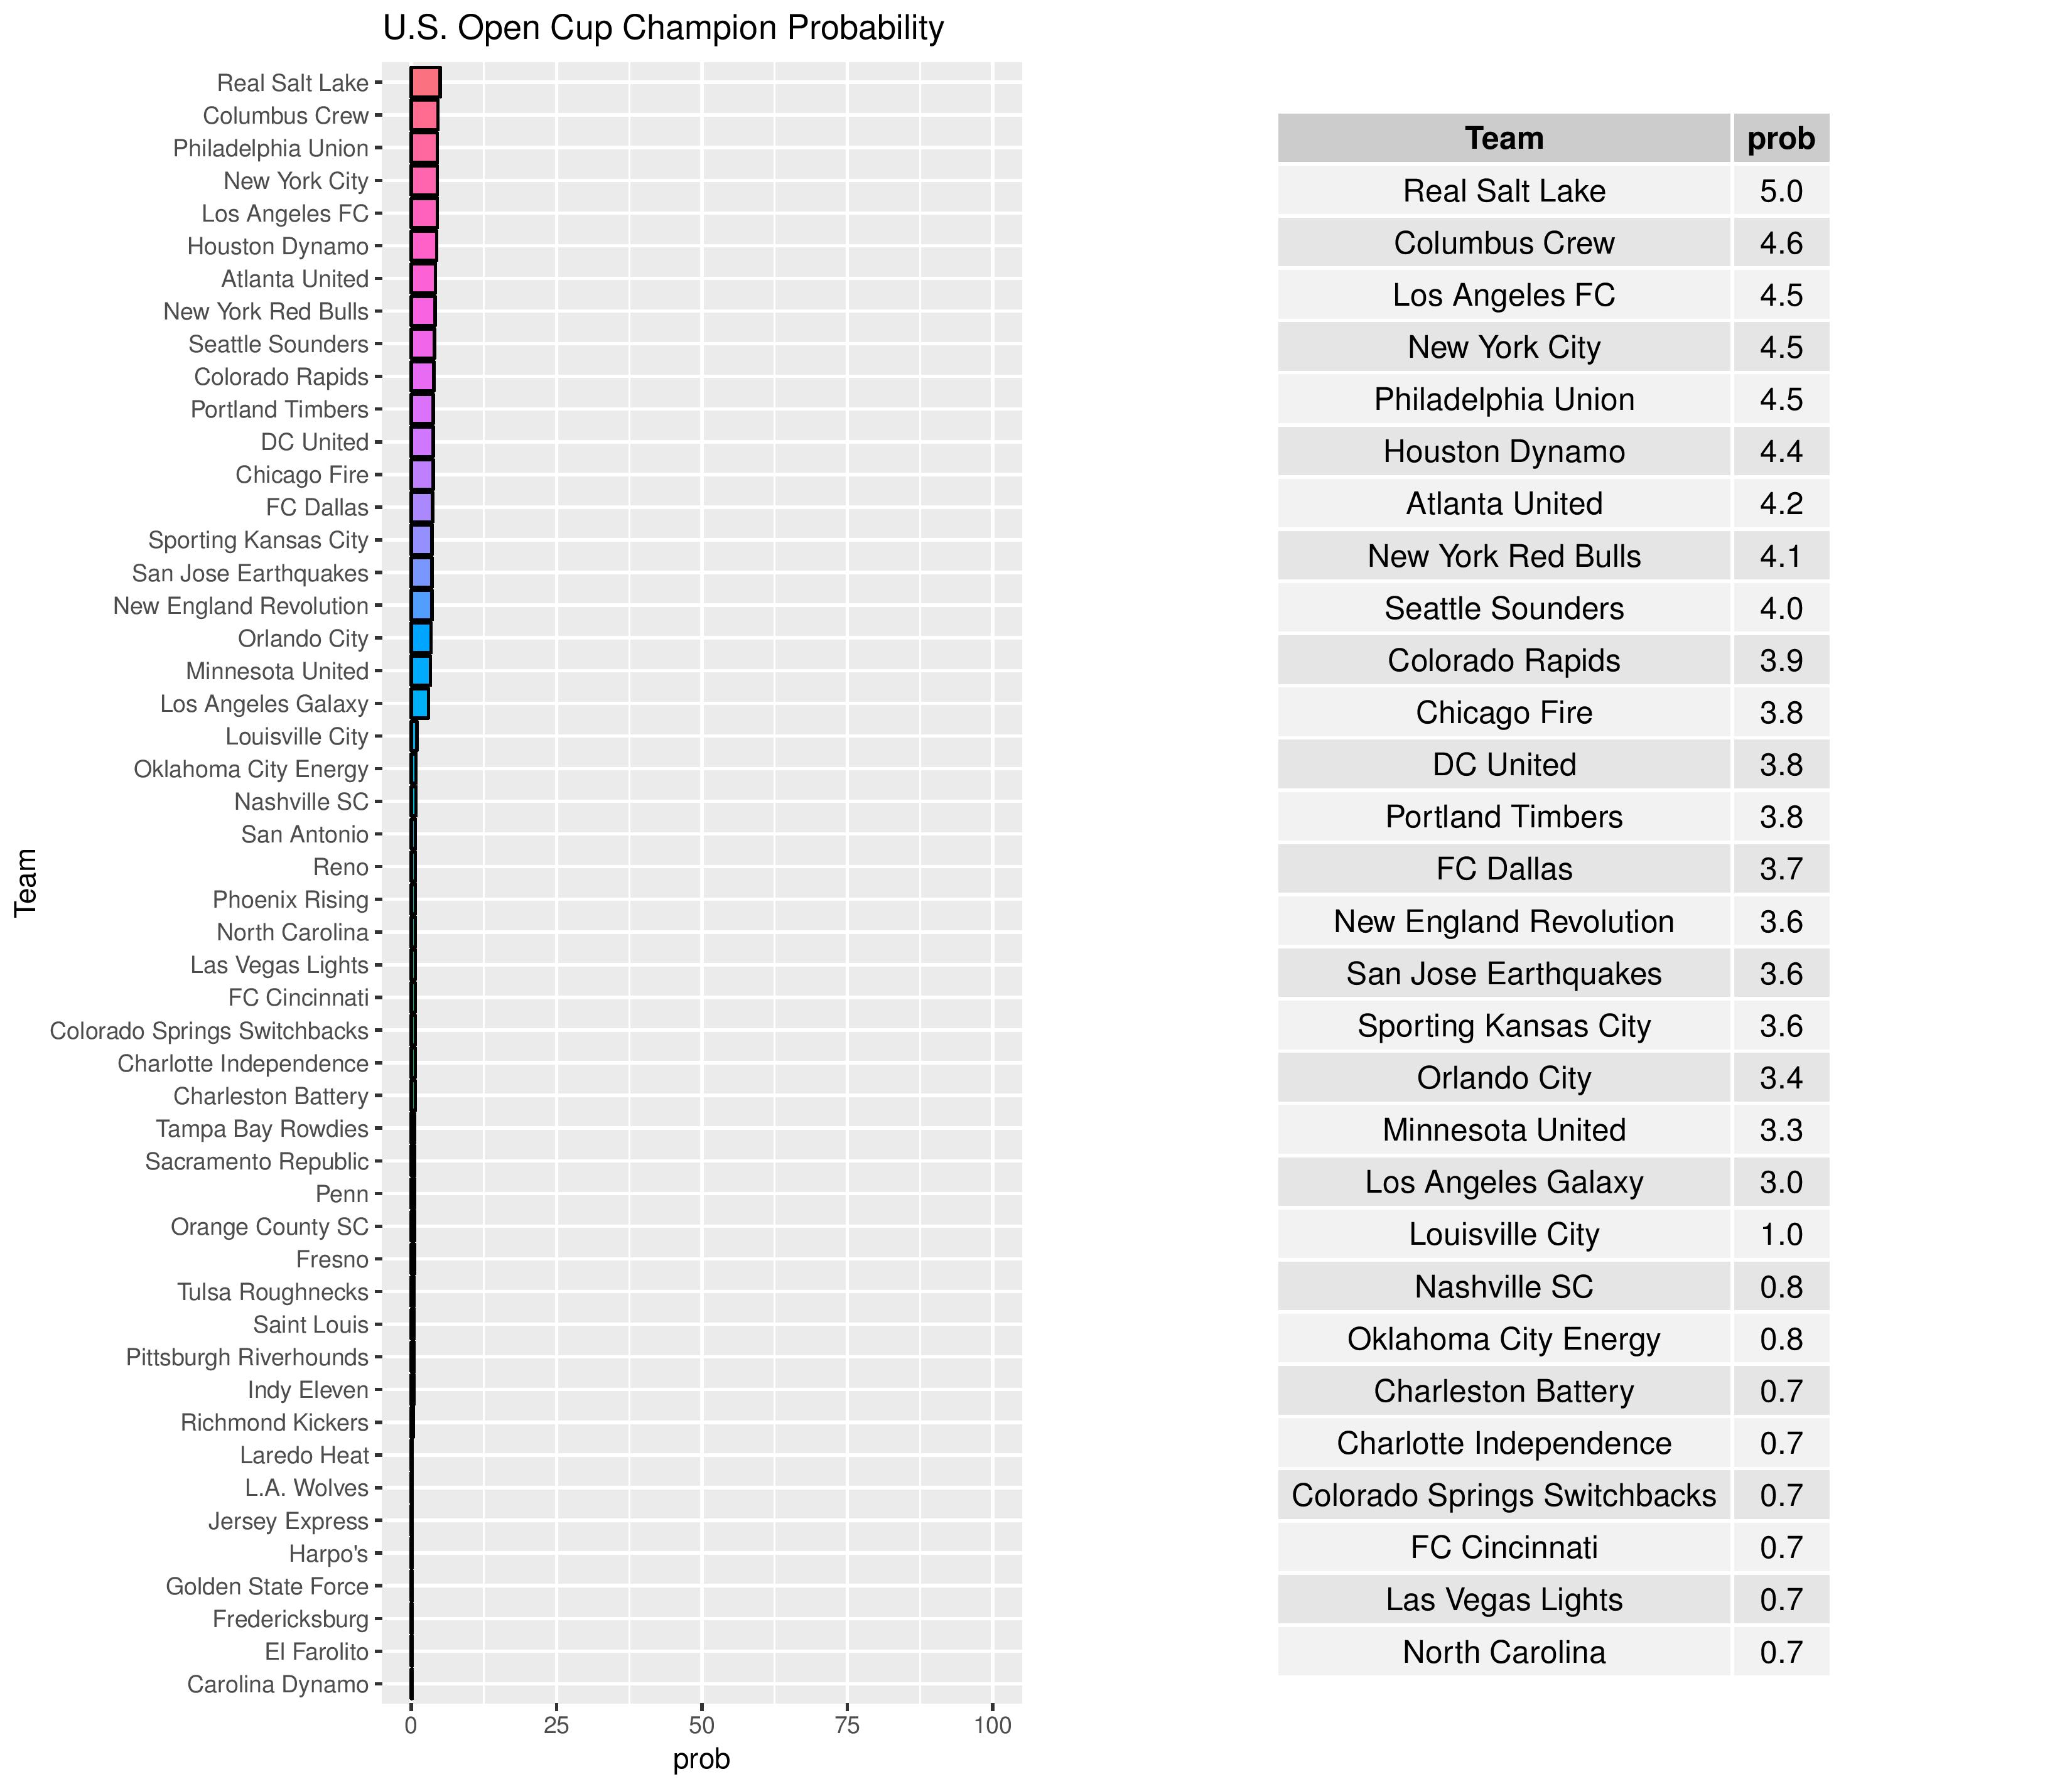
* I now have assumed to exclude NASL clubs from USOC as their season was cancelled, and I would guess that those clubs that moved to the NPSL are too late to attempt qualification.
Philadelphia’s chances of having a U.S. Open Cup win increased from 4.2% to 4.5%.
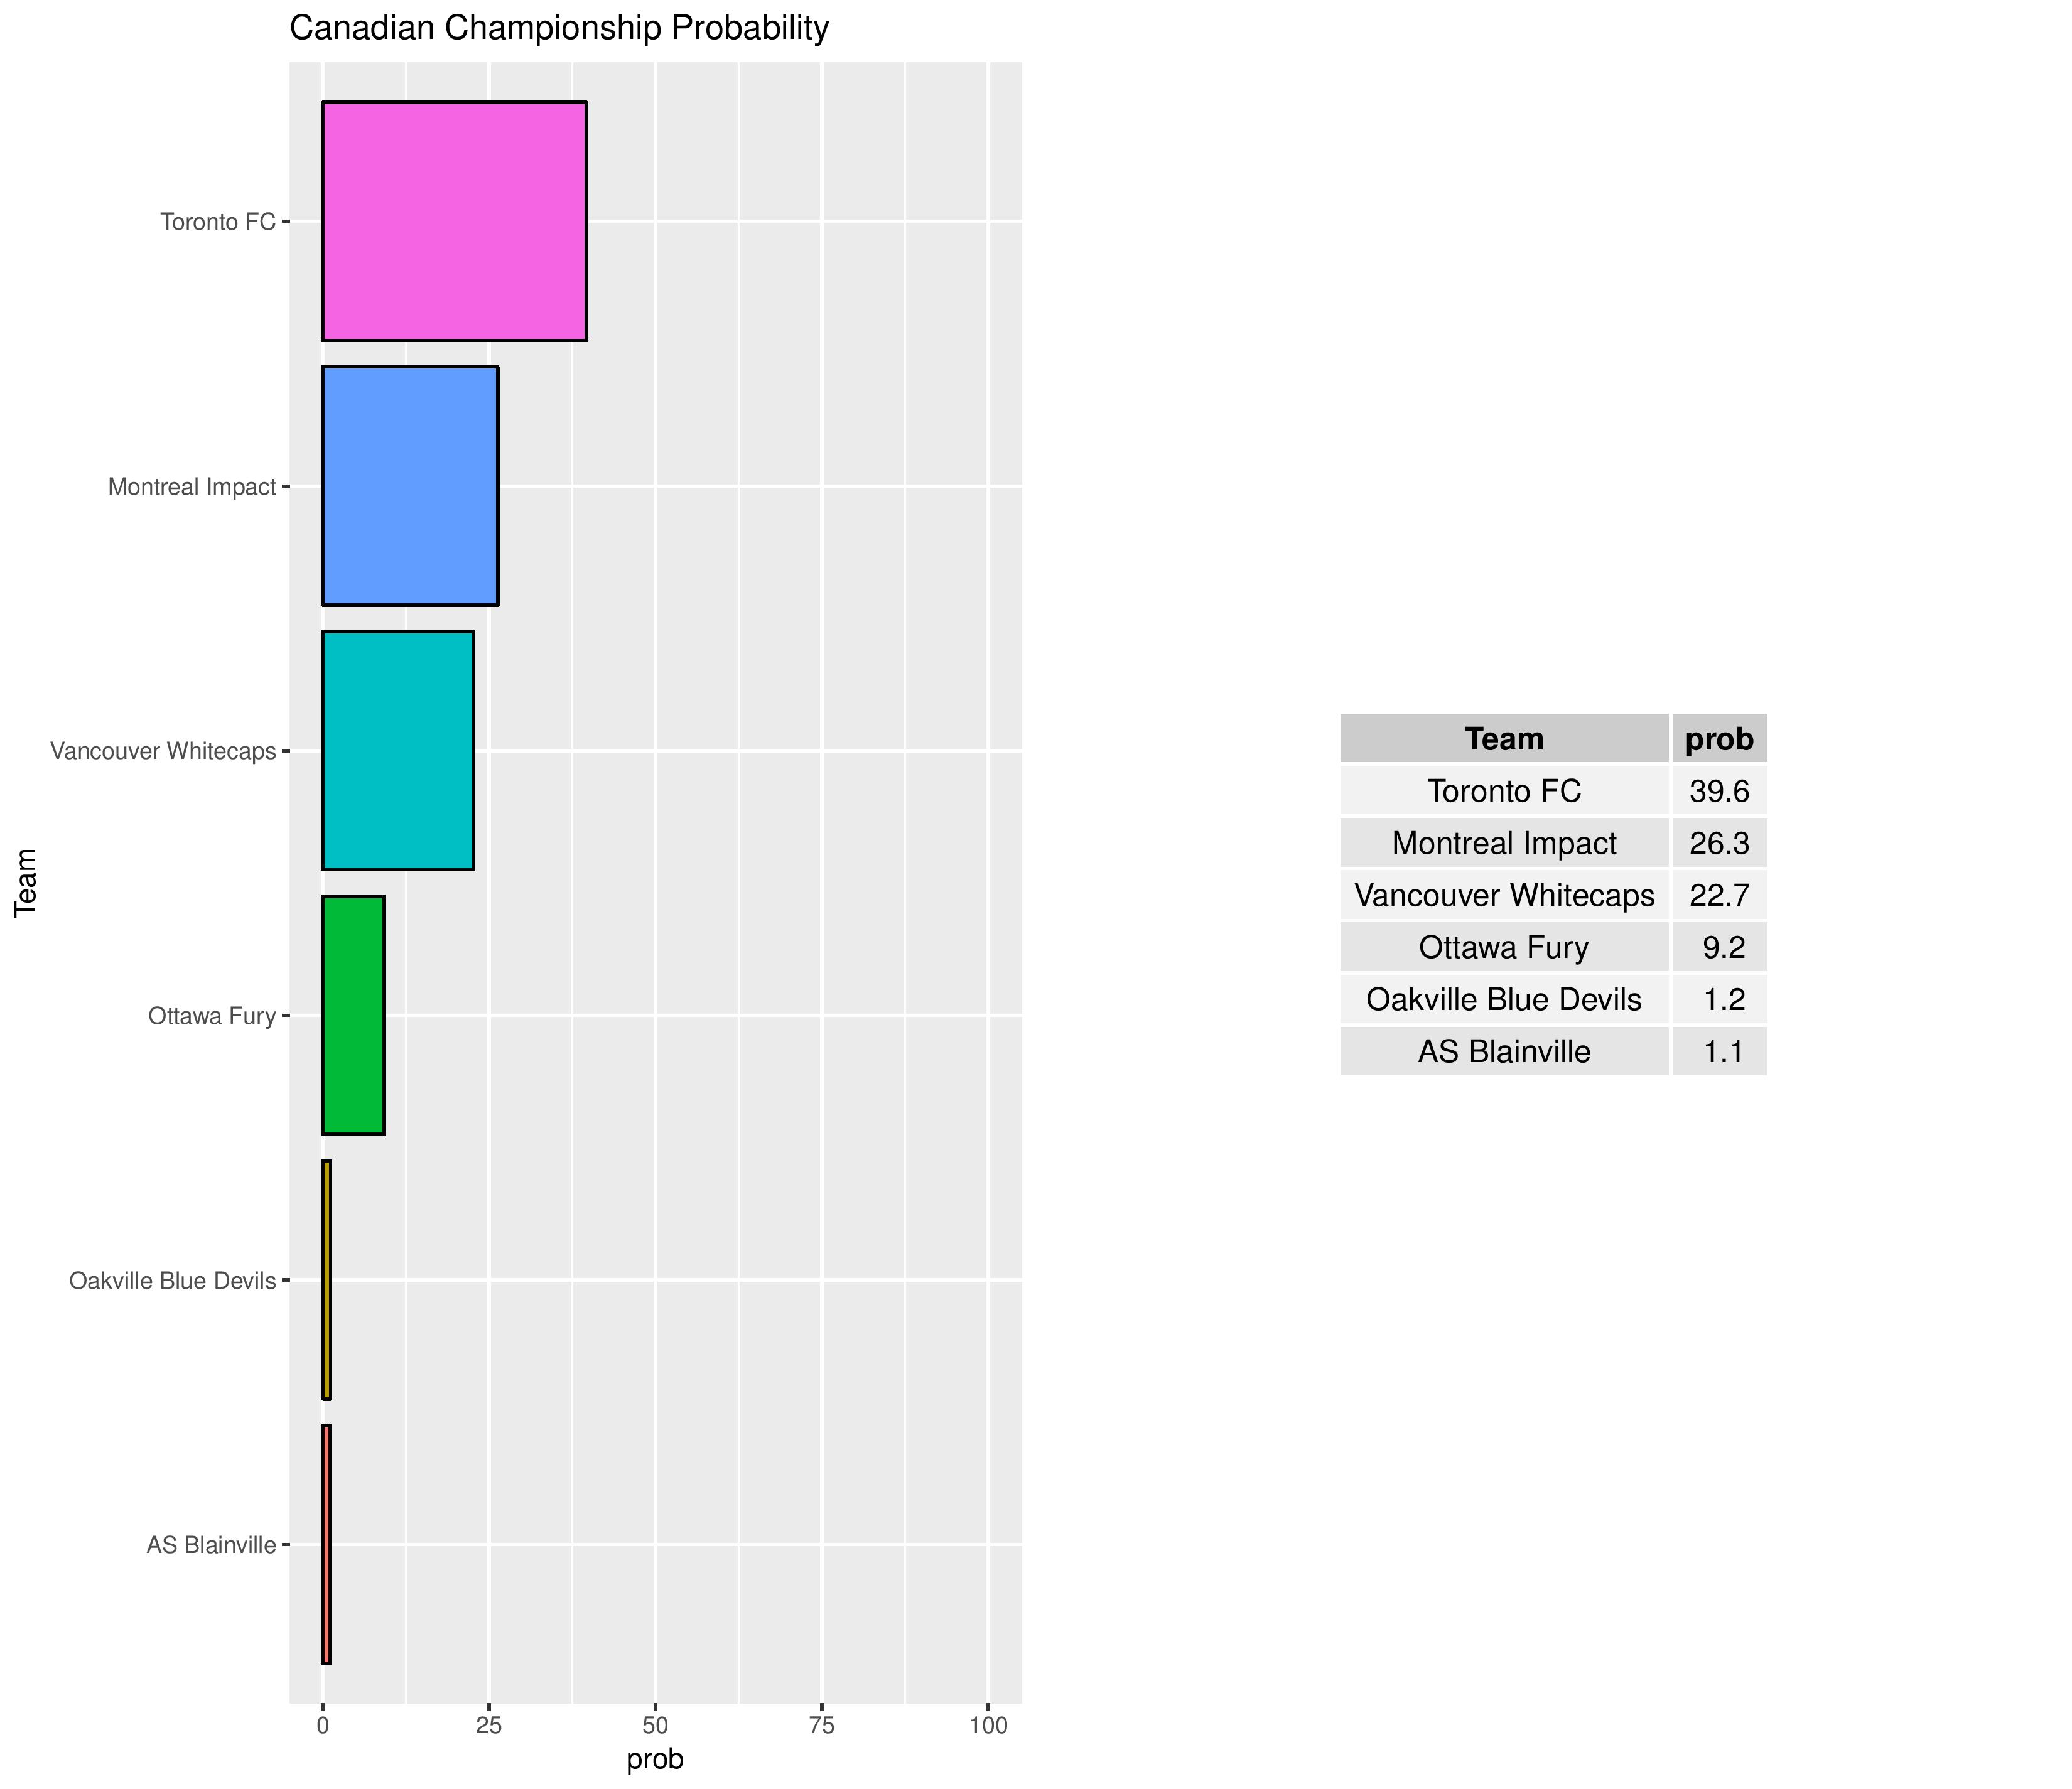
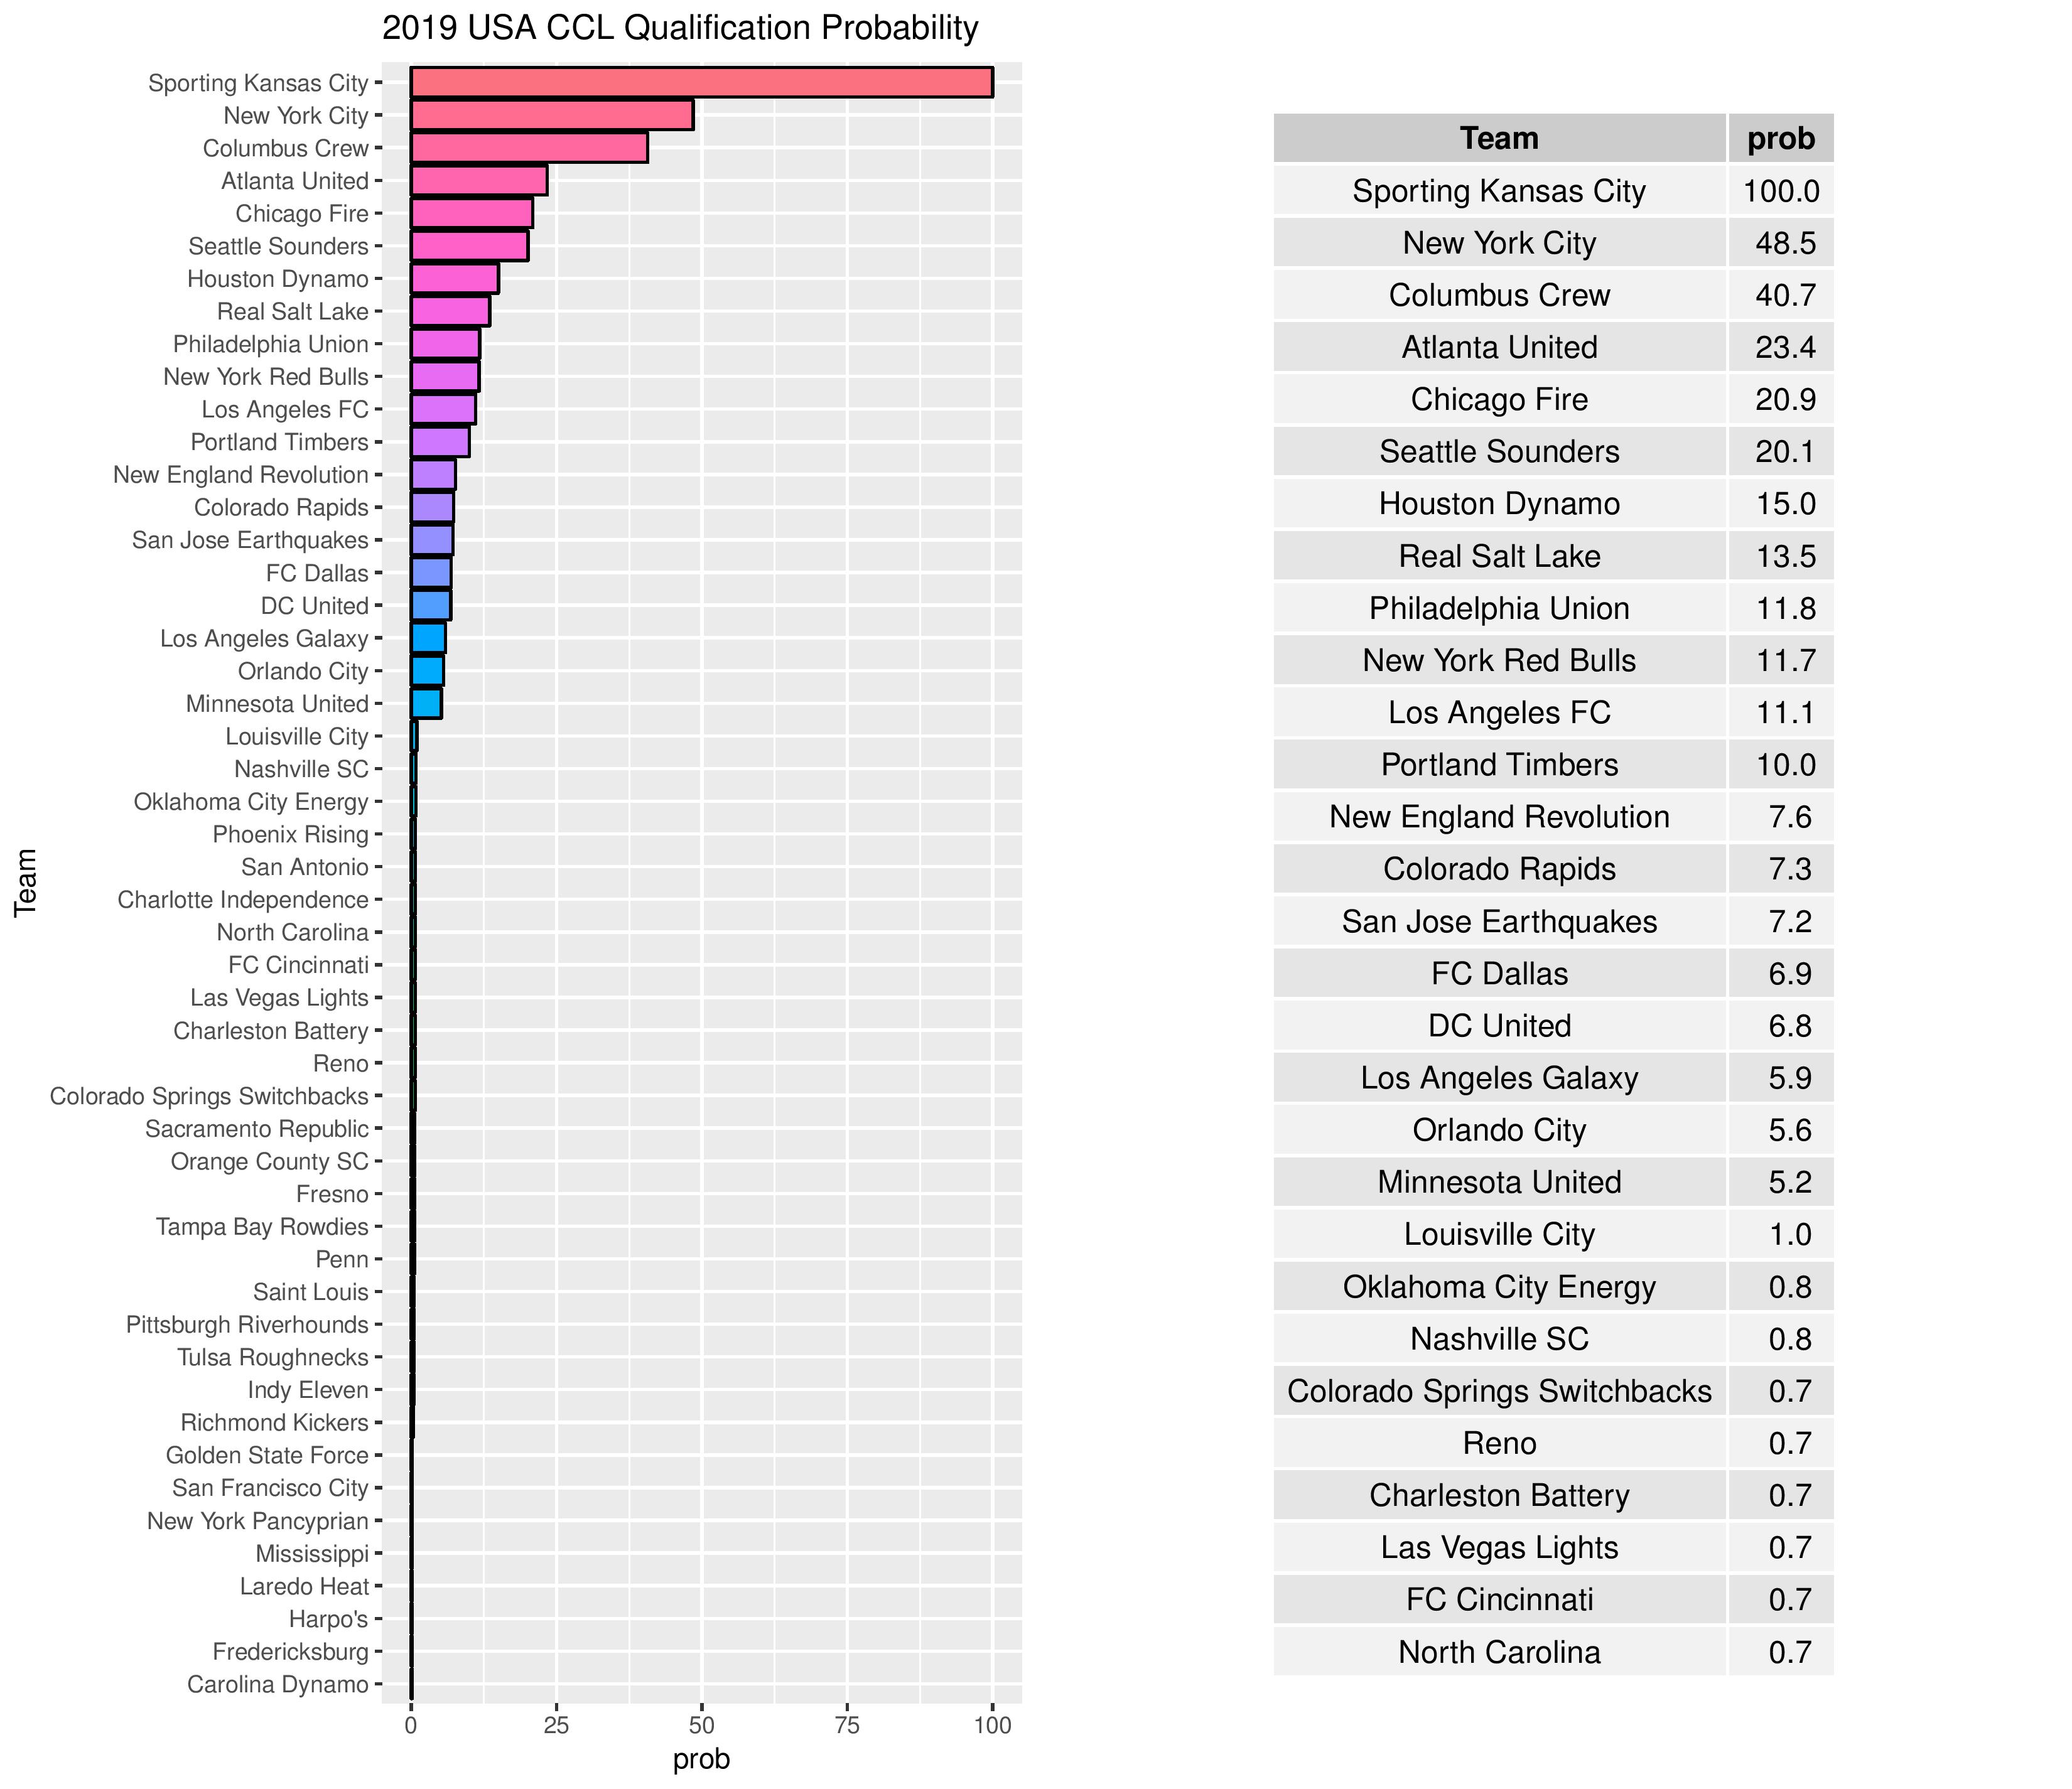
The following 2018 CCL Champion odds do not include Tuesday night’s two matches.

The 2019 CONCACAF Champions League qualification from the U.S. was supposed to be the 2017 & 2018 winners of the U.S. Open Cup and the MLS Cup. This is why Kansas City has already qualified. However, since Toronto (not eligible for a U.S. qualification slot) won the MLS Cup, that slot (and any other future Canadian or Kansas City wins) will be given to the club with the most regular season points over both 2017 and 2018.
Philadelphia has increased from an 8.1% to a 11.8% chance of qualifying for the 2019 edition of the CONCACAF Champions League.

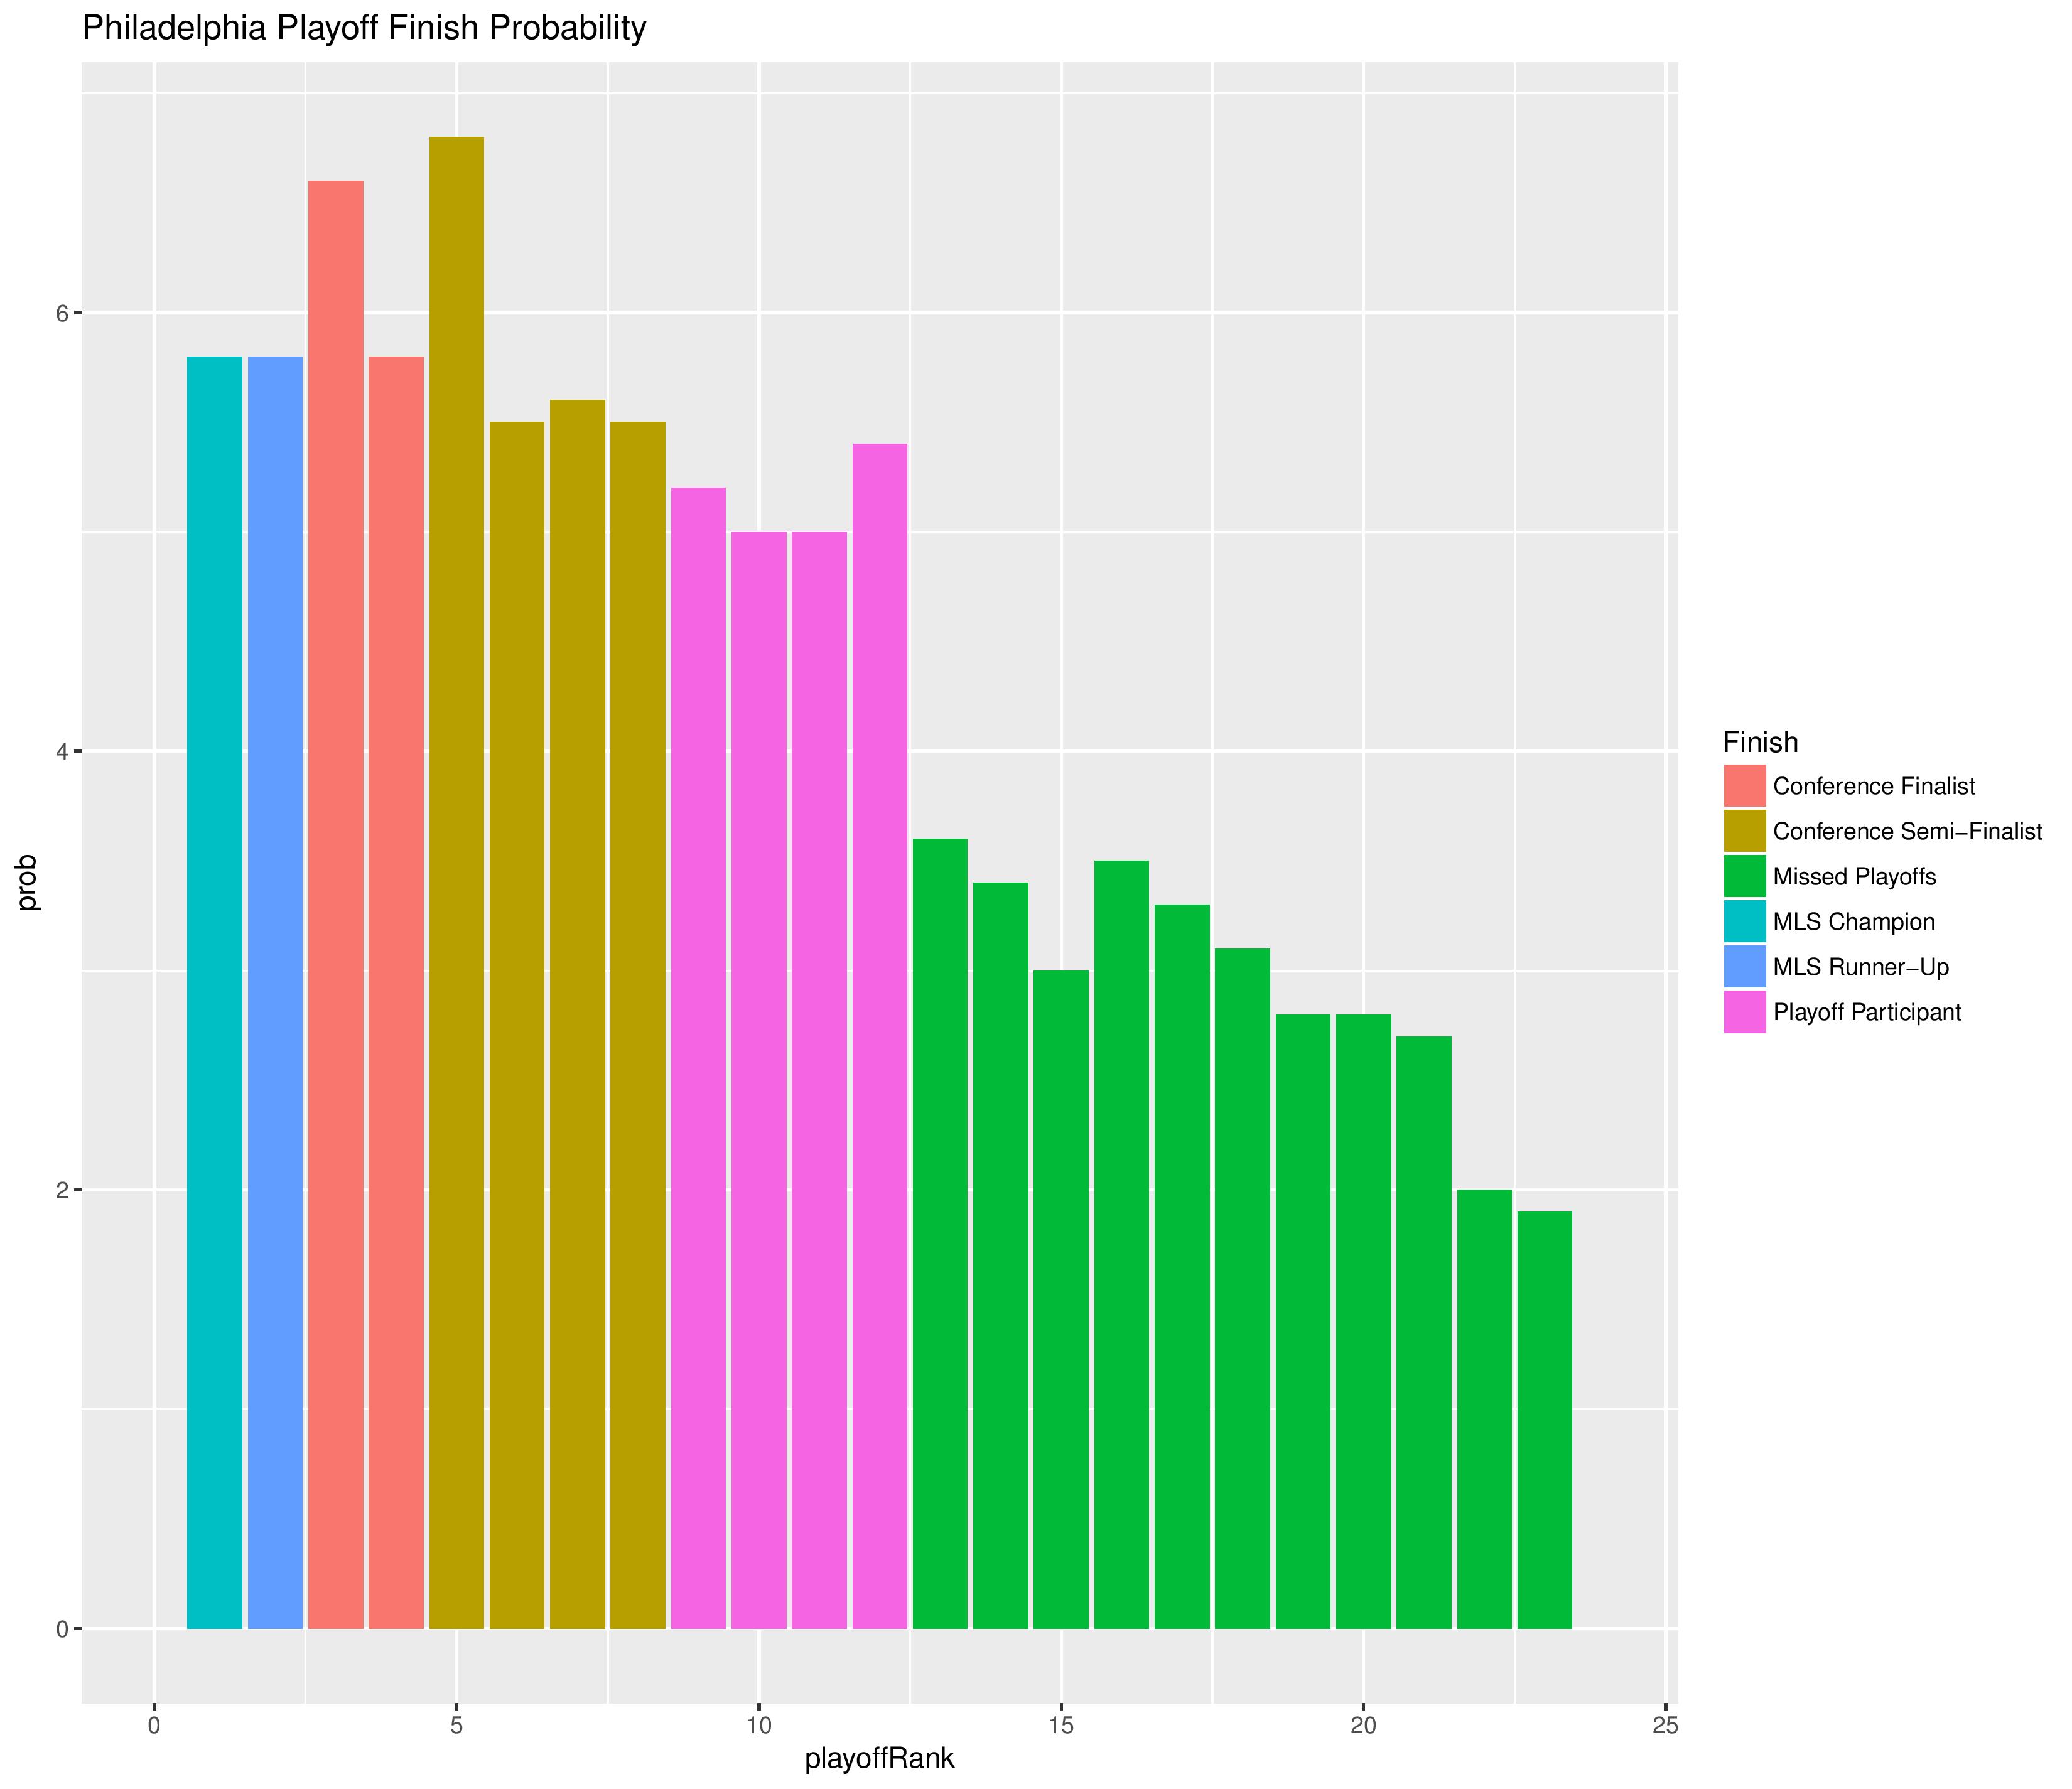
The following are the probabilities of each final playoffs placement for Philadelphia.
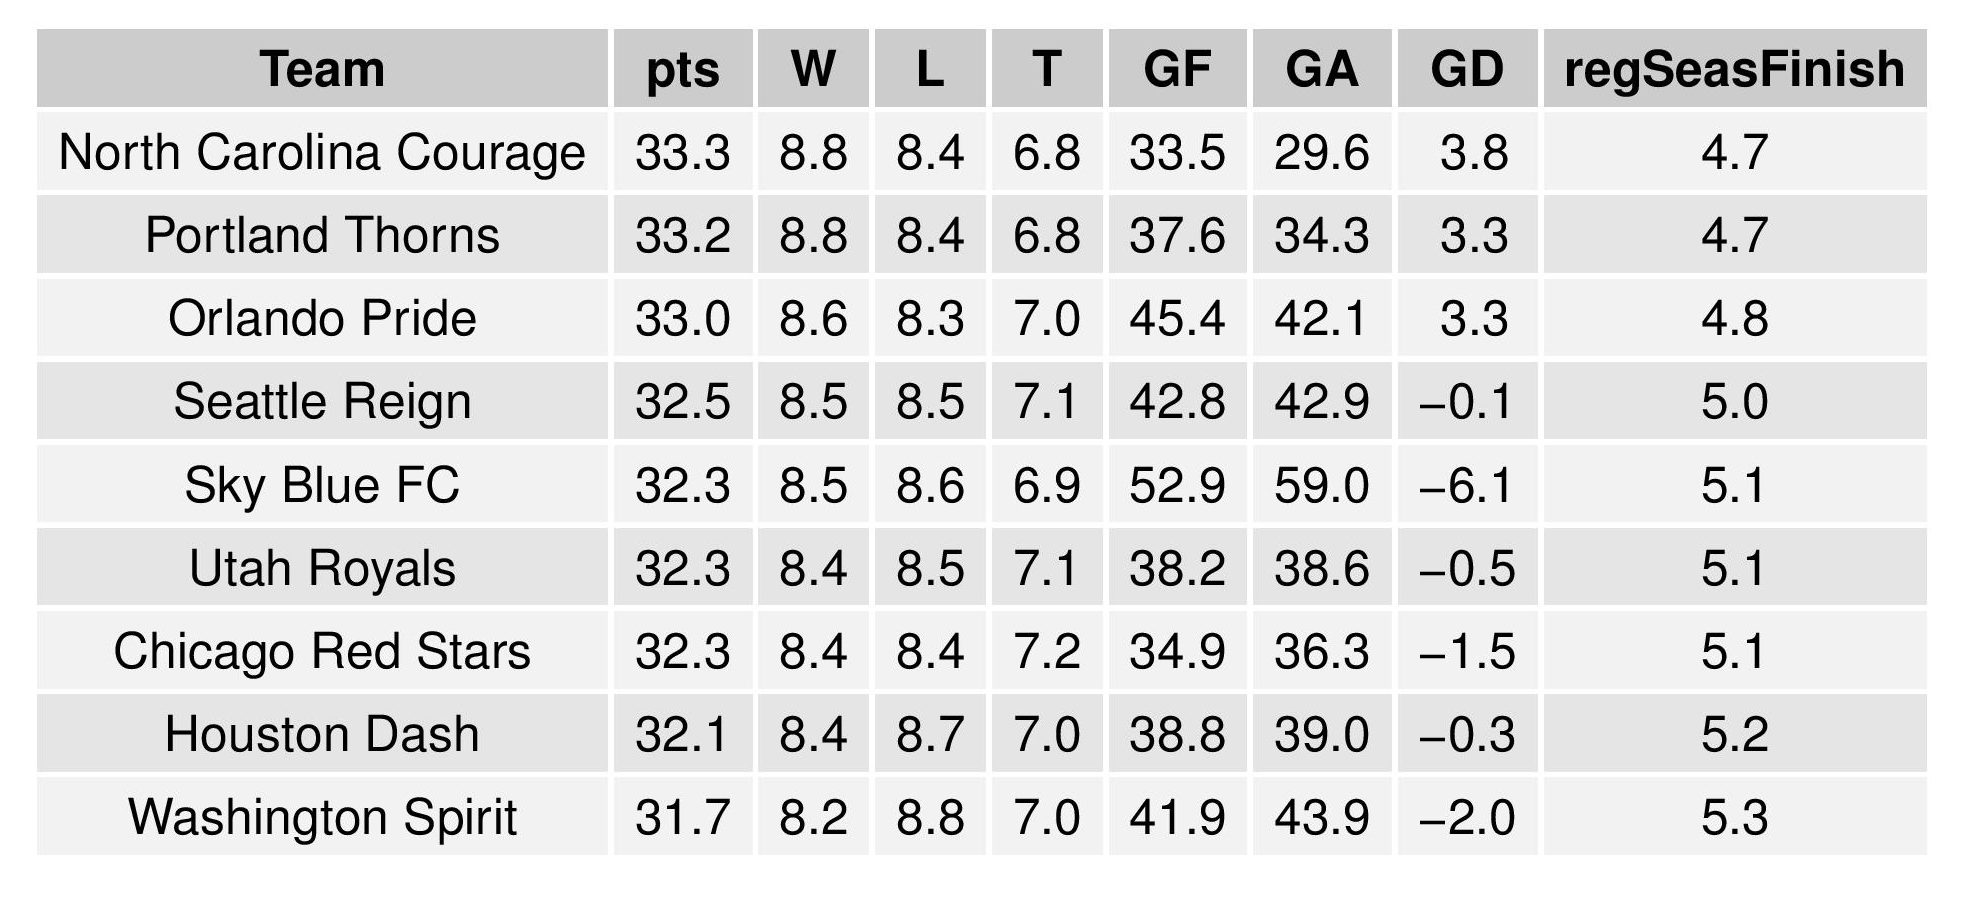
The following shows the summary of the simulations in an easy table format.
| Team | Conf | pts | W | L | T | GF | GA | GD | powerRk | pwrScr | Plyfs | MLSCup | Shld | USOCChmp | CANChmp | CCLQual | CCLChmp | confRegSeasFinish | regSeasFinish | plyfFinish |
|---|---|---|---|---|---|---|---|---|---|---|---|---|---|---|---|---|---|---|---|---|
| New York Red Bulls | East | 71 | 22 | 7 | 5 | 62 | 33 | 29 | 2 | 1.852 | 100 | 30.7 | 100 | 0 | NA | 69.7 | 0 | 1 | 1 | 2.9 |
| Atlanta United | East | 69 | 21 | 7 | 6 | 70 | 44 | 26 | 1 | 1.871 | 100 | 24.1 | 0 | 0 | NA | 100 | NA | 2 | 2 | 3.3 |
| Sporting Kansas City | West | 62 | 18 | 8 | 8 | 65 | 40 | 25 | 3 | 1.736 | 100 | 14.9 | 0 | 0 | NA | 100 | NA | 1 | 3 | 3.6 |
| Seattle Sounders | West | 59 | 18 | 11 | 5 | 52 | 37 | 15 | 5 | 1.613 | 100 | 8.1 | 0 | 0 | NA | 8.1 | 0 | 2 | 4 | 4.4 |
| Los Angeles FC | West | 57 | 16 | 9 | 9 | 68 | 52 | 16 | 4 | 1.65 | 100 | 7.7 | 0 | 0 | NA | 7.7 | NA | 3 | 5 | 5.2 |
| FC Dallas | West | 57 | 16 | 9 | 9 | 52 | 44 | 8 | 6 | 1.571 | 100 | 4.2 | 0 | 0 | NA | 4.2 | 0 | 4 | 6 | 6.4 |
| New York City | East | 56 | 16 | 10 | 8 | 59 | 45 | 14 | 8 | 1.547 | 100 | 3.3 | 0 | 0 | NA | 3.3 | NA | 3 | 7 | 6.7 |
| Portland Timbers | West | 54 | 15 | 10 | 9 | 54 | 48 | 6 | 7 | 1.554 | 100 | 1.8 | 0 | 0 | NA | 1.8 | NA | 5 | 8 | 8.2 |
| DC United | East | 51 | 14 | 11 | 9 | 60 | 50 | 10 | 9 | 1.521 | 100 | 3.5 | 0 | 0 | NA | 3.5 | NA | 4 | 9 | 7.3 |
| Columbus Crew | East | 51 | 14 | 11 | 9 | 43 | 45 | -2 | 11 | 1.4 | 100 | 0.7 | 0 | 0 | NA | 0.7 | NA | 5 | 10 | 9.3 |
| Philadelphia Union | East | 50 | 15 | 14 | 5 | 49 | 50 | -1 | 10 | 1.416 | 100 | 0.6 | 0 | 0 | NA | 0.6 | NA | 6 | 11 | 9.9 |
| Real Salt Lake | West | 49 | 14 | 13 | 7 | 55 | 58 | -3 | 15 | 1.319 | 100 | 0.3 | 0 | 0 | NA | 0.3 | NA | 6 | 12 | 10.9 |
| Los Angeles Galaxy | West | 48 | 13 | 12 | 9 | 66 | 64 | 2 | 14 | 1.322 | 0 | 0 | 0 | 0 | NA | 0 | NA | 7 | 13 | 13 |
| Vancouver Whitecaps | West | 47 | 13 | 13 | 8 | 54 | 67 | -13 | 16 | 1.227 | 0 | 0 | 0 | NA | 0 | 0 | NA | 8 | 14 | 14 |
| Montreal Impact | East | 46 | 14 | 16 | 4 | 47 | 53 | -6 | 12 | 1.388 | 0 | 0 | 0 | NA | 0 | 0 | NA | 7 | 15 | 15 |
| New England Revolution | East | 41 | 10 | 13 | 11 | 49 | 55 | -6 | 18 | 1.189 | 0 | 0 | 0 | 0 | NA | 0 | NA | 8 | 16 | 16 |
| Houston Dynamo | West | 38 | 10 | 16 | 8 | 58 | 58 | 0 | 17 | 1.199 | 0 | 0 | 0 | 100 | NA | 100 | NA | 9 | 17 | 17 |
| Minnesota United | West | 36 | 11 | 20 | 3 | 49 | 71 | -22 | 21 | 0.963 | 0 | 0 | 0 | 0 | NA | 0 | NA | 10 | 18 | 18 |
| Toronto FC | East | 36 | 10 | 18 | 6 | 59 | 64 | -5 | 13 | 1.342 | 0 | 0 | 0 | NA | 100 | 100 | 0 | 9 | 19 | 19 |
| Chicago Fire | East | 32 | 8 | 18 | 8 | 48 | 61 | -13 | 19 | 1.068 | 0 | 0 | 0 | 0 | NA | 0 | NA | 10 | 20 | 20 |
| Colorado Rapids | West | 31 | 8 | 19 | 7 | 36 | 63 | -27 | 22 | 0.926 | 0 | 0 | 0 | 0 | NA | 0 | 0 | 11 | 21 | 21 |
| Orlando City | East | 28 | 8 | 22 | 4 | 43 | 74 | -31 | 20 | 0.975 | 0 | 0 | 0 | 0 | NA | 0 | NA | 11 | 22 | 22 |
| San Jose Earthquakes | West | 21 | 4 | 21 | 9 | 49 | 71 | -22 | 23 | 0.806 | 0 | 0 | 0 | 0 | NA | 0 | NA | 12 | 23 | 23 |
Next is a table showing the difference between this forecast and the last forecast.
| Team | Conf | pts | W | L | T | GF | GA | GD | powerRk | pwrScr | Plyfs | MLSCup | Shld | USOCChmp | CANChmp | CCLQual | CCLChmp | confRegSeasFinish | regSeasFinish | plyfFinish |
|---|---|---|---|---|---|---|---|---|---|---|---|---|---|---|---|---|---|---|---|---|
| New York Red Bulls | East | 0.3 | 0.1 | -0.1 | -0.1 | -1.7 | -0.7 | -1 | 0 | 0.017 | 0 | 1.4 | 55.6 | 0 | NA | 0.4 | 0 | -0.6 | -0.6 | -0.1 |
| Atlanta United | East | -1.6 | -0.5 | 0.6 | -0.1 | -1 | 2.1 | -3.1 | 0 | -0.047 | 0 | -3.4 | -55.6 | 0 | NA | 0 | NA | 0.6 | 0.6 | 0.3 |
| Sporting Kansas City | West | 1 | 0.4 | -0.2 | -0.2 | 0 | -0.2 | 0.2 | 0 | 0.03 | 0 | 2.4 | 0 | 0 | NA | 0 | NA | -0.5 | -0.5 | -0.4 |
| Seattle Sounders | West | 0.4 | 0.2 | -0.1 | -0.1 | -0.1 | 0.2 | -0.4 | -1 | 0.017 | 0 | 1.5 | 0 | 0 | NA | 1.5 | 0 | -0.7 | -0.7 | -0.7 |
| Los Angeles FC | West | -0.8 | -0.2 | 0.4 | -0.2 | -0.2 | 0 | -0.2 | 0 | -0.009 | 0 | -0.3 | 0 | 0 | NA | -0.3 | NA | 0 | 0 | -0.1 |
| FC Dallas | West | -1.7 | -0.5 | 0.7 | -0.2 | -0.7 | 0.7 | -1.4 | -1 | -0.02 | 0 | -1.7 | 0 | 0 | NA | -1.7 | 0 | 1.1 | 1.1 | 0.9 |
| New York City | East | 1.1 | 0.4 | -0.3 | -0.1 | 1.1 | -0.1 | 1.2 | -1 | 0.048 | 0 | 1.3 | 0 | 0 | NA | 1.3 | NA | -0.4 | -1 | -0.8 |
| Portland Timbers | West | -1.4 | -0.4 | 0.6 | -0.2 | -0.7 | 0.3 | -1 | 2 | -0.045 | 0 | -1.1 | 0 | 0 | NA | -1.1 | NA | 0.2 | 0.7 | 0.5 |
| DC United | East | -0.4 | -0.4 | -0.4 | 0.8 | -1.7 | -1.7 | 0 | 1 | -0.025 | 0 | 0.7 | 0 | 0 | NA | 0.7 | NA | -0.8 | -1.1 | -1 |
| Columbus Crew | East | 0.6 | 0.2 | -0.1 | -0.1 | 0.9 | 1.2 | -0.3 | -1 | -0.001 | 7.9 | 0 | 0 | 0 | NA | 0 | NA | -0.3 | -1.3 | -0.6 |
| Philadelphia Union | East | -1 | -0.3 | 0.4 | -0.1 | -0.1 | 1.1 | -1.2 | 0 | -0.009 | 0 | -0.4 | 0 | 0 | NA | -0.4 | NA | 1.4 | 1 | 1 |
| Real Salt Lake | West | 0 | 0 | 0 | 0 | 0 | 0 | 0 | 1 | 0.013 | 70 | 0.2 | 0 | 0 | NA | 0.2 | NA | -0.7 | -0.8 | -1.6 |
| Los Angeles Galaxy | West | -2.2 | -0.7 | 0.8 | -0.1 | -0.6 | 1.2 | -1.8 | 1 | -0.059 | -70 | -0.7 | 0 | 0 | NA | -0.7 | NA | 0.7 | 2.1 | 2.4 |
| Vancouver Whitecaps | West | 1.5 | 0.6 | -0.4 | -0.2 | 0.3 | -0.7 | 1 | 0 | 0.023 | 0 | 0 | 0 | NA | 0 | 0 | NA | 0 | -0.8 | -0.8 |
| Montreal Impact | East | -1.1 | -0.3 | 0.5 | -0.1 | -1.3 | -0.9 | -0.5 | 1 | -0.024 | -7.9 | 0 | 0 | NA | 0 | 0 | NA | 0.1 | 1.3 | 1.3 |
| New England Revolution | East | 1.2 | 0.5 | -0.3 | -0.1 | -0.9 | -1.3 | 0.5 | 1 | 0.018 | 0 | 0 | 0 | 0 | NA | 0 | NA | 0 | -0.1 | -0.1 |
| Houston Dynamo | West | 2.4 | 0.8 | -0.7 | -0.1 | 1.2 | -0.6 | 1.8 | -1 | 0.048 | 0 | 0 | 0 | 0 | NA | 0 | NA | -0.9 | -1.1 | -1.1 |
| Minnesota United | West | -0.5 | -0.1 | 0.2 | -0.1 | 1.2 | 0.9 | 0.3 | 1 | -0.023 | 0 | 0 | 0 | 0 | NA | 0 | NA | 0.9 | 0.9 | 0.9 |
| Toronto FC | East | 1.7 | 0.6 | -0.5 | -0.1 | 2.1 | -1 | 3.1 | -2 | 0.055 | 0 | 0 | 0 | NA | 0 | 0 | 0 | -0.2 | 0.1 | 0.1 |
| Chicago Fire | East | -0.4 | -0.4 | -0.4 | 0.8 | -1.7 | -1.7 | 0 | 0 | -0.028 | 0 | 0 | 0 | 0 | NA | 0 | NA | 0.2 | 0.2 | 0.2 |
| Colorado Rapids | West | 1.9 | 0.7 | -0.5 | -0.2 | 0.7 | -0.7 | 1.4 | 0 | 0.035 | 0 | 0 | 0 | 0 | NA | 0 | 0 | 0 | -0.6 | -0.6 |
| Orlando City | East | -0.2 | -0.1 | 0.1 | -0.1 | -0.7 | -1.7 | 1 | -1 | -0.006 | 0 | 0 | 0 | 0 | NA | 0 | NA | 0 | 0.6 | 0.6 |
| San Jose Earthquakes | West | -0.3 | -0.1 | 0.2 | -0.1 | 0.2 | -0.1 | 0.4 | 0 | -0.006 | 0 | 0 | 0 | 0 | NA | 0 | NA | 0 | 0 | 0 |
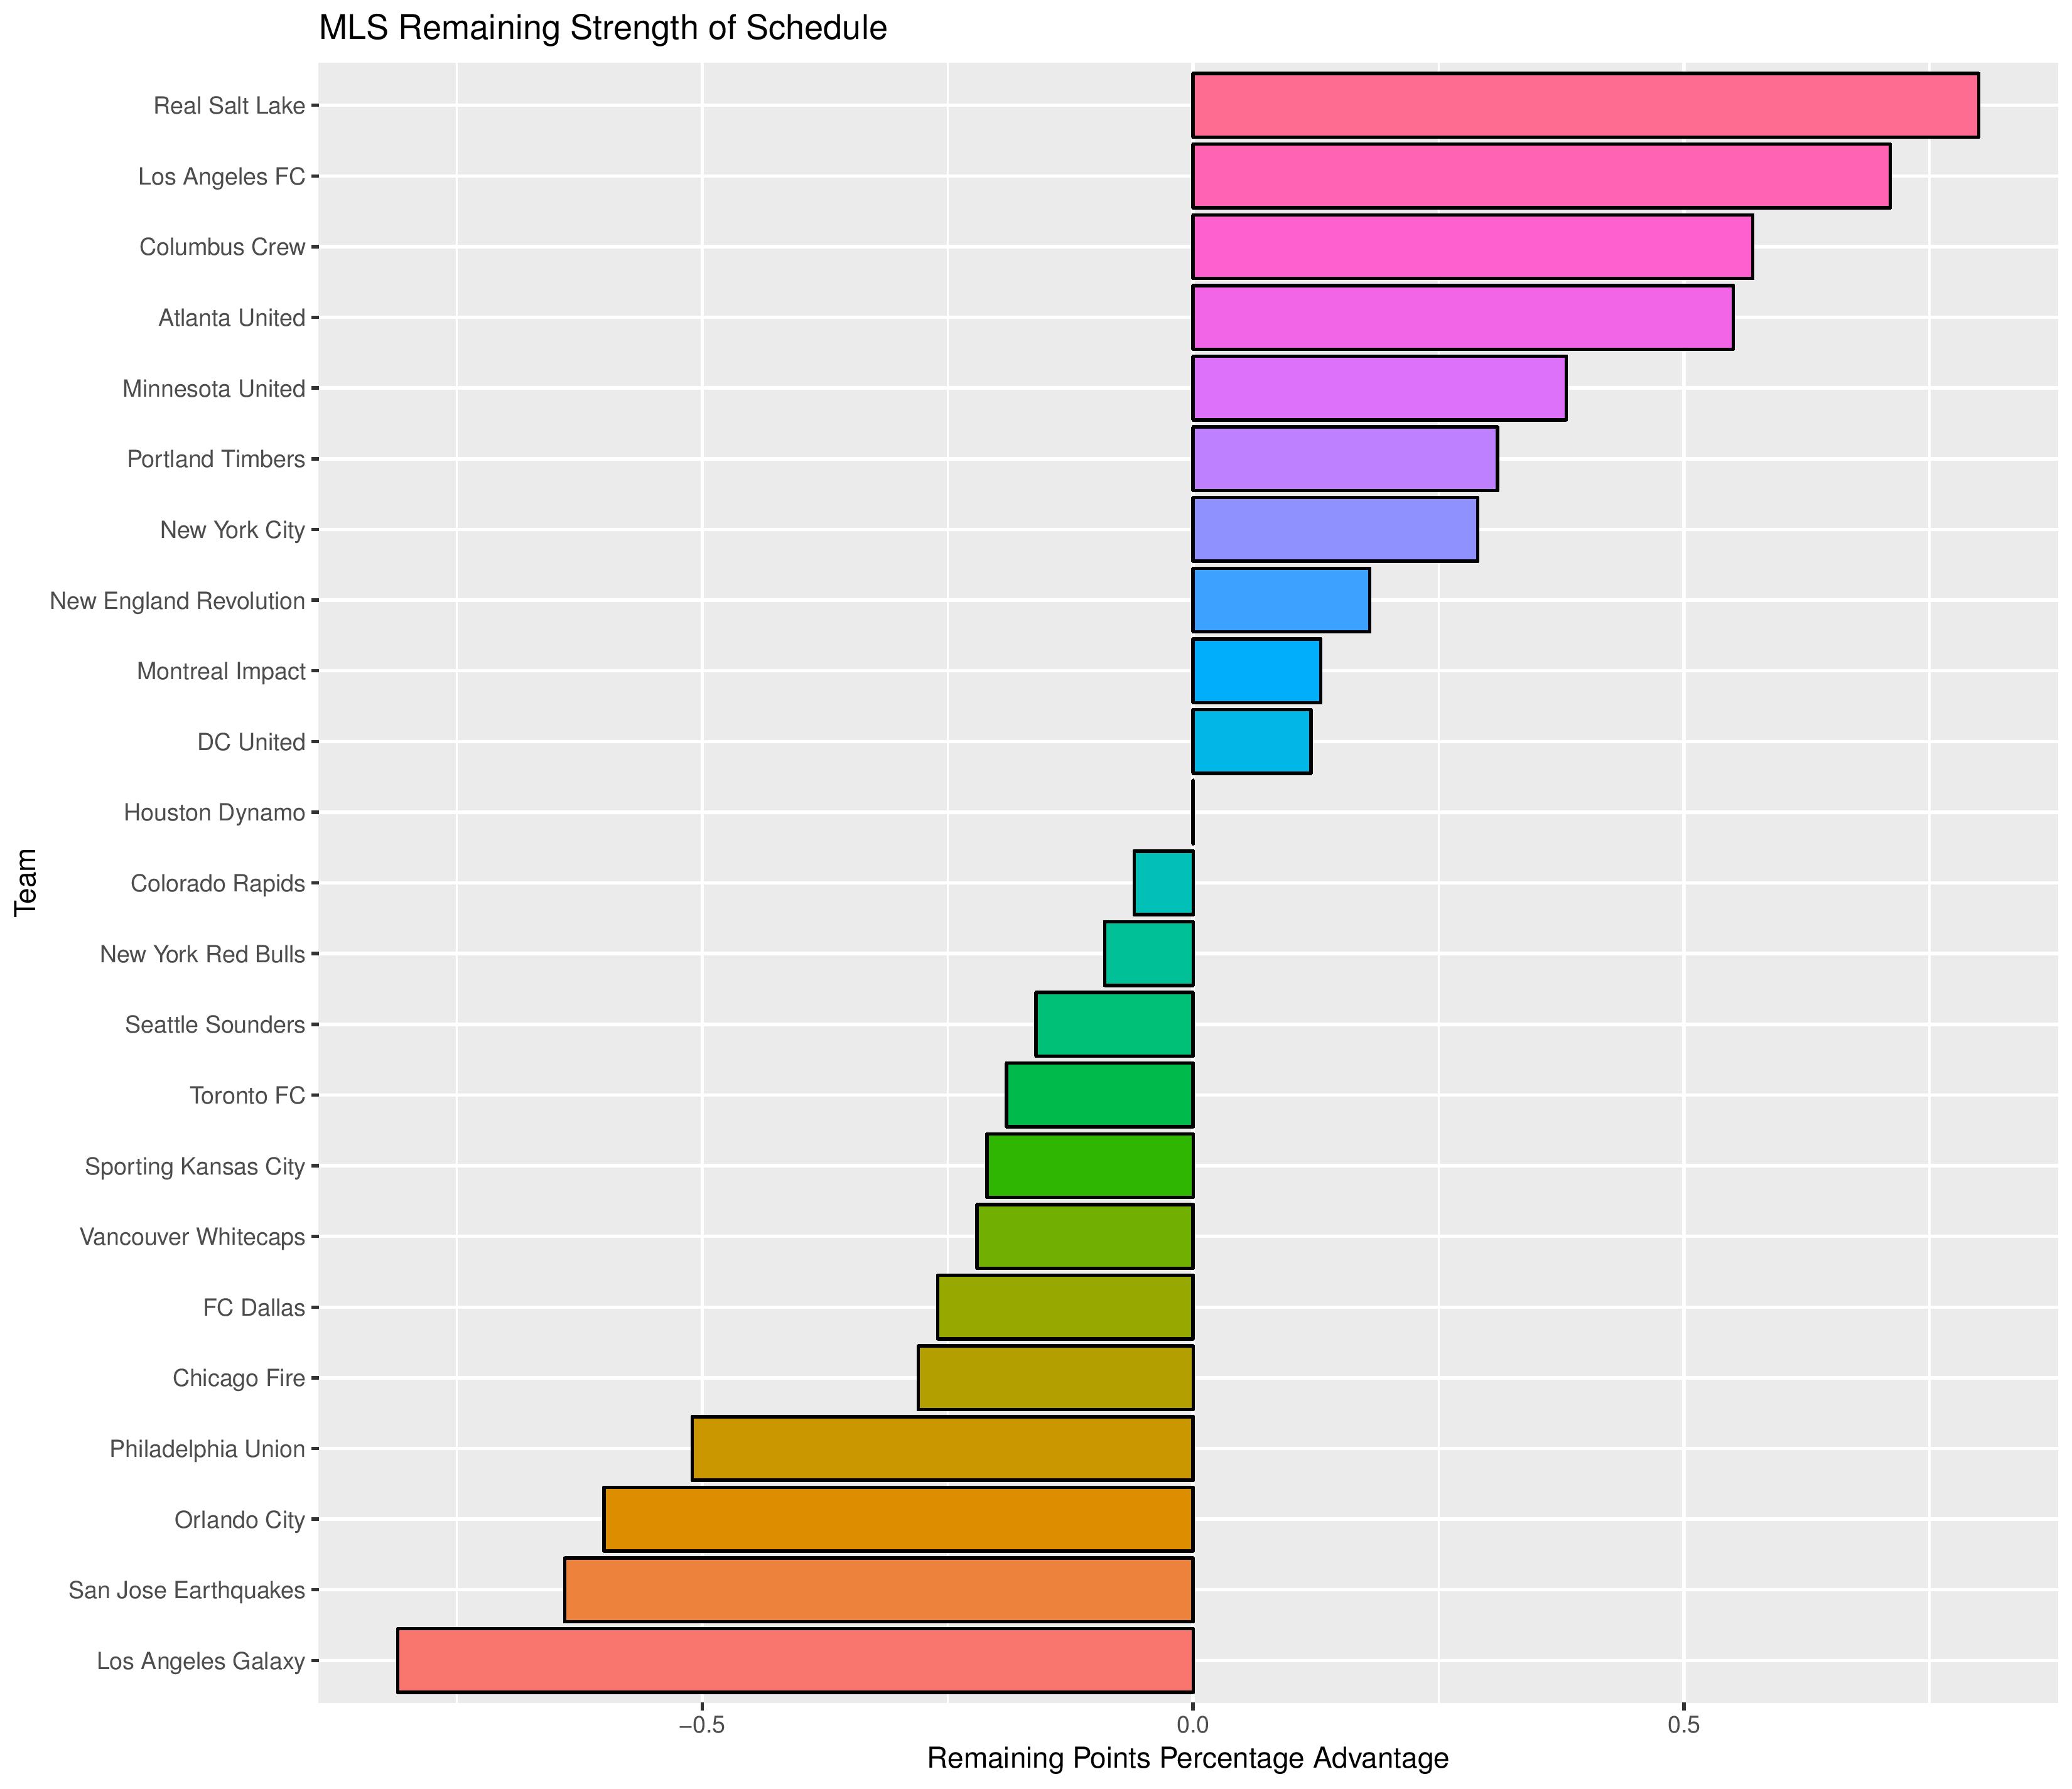
The following shows the difficulty for each team’s remaining schedule
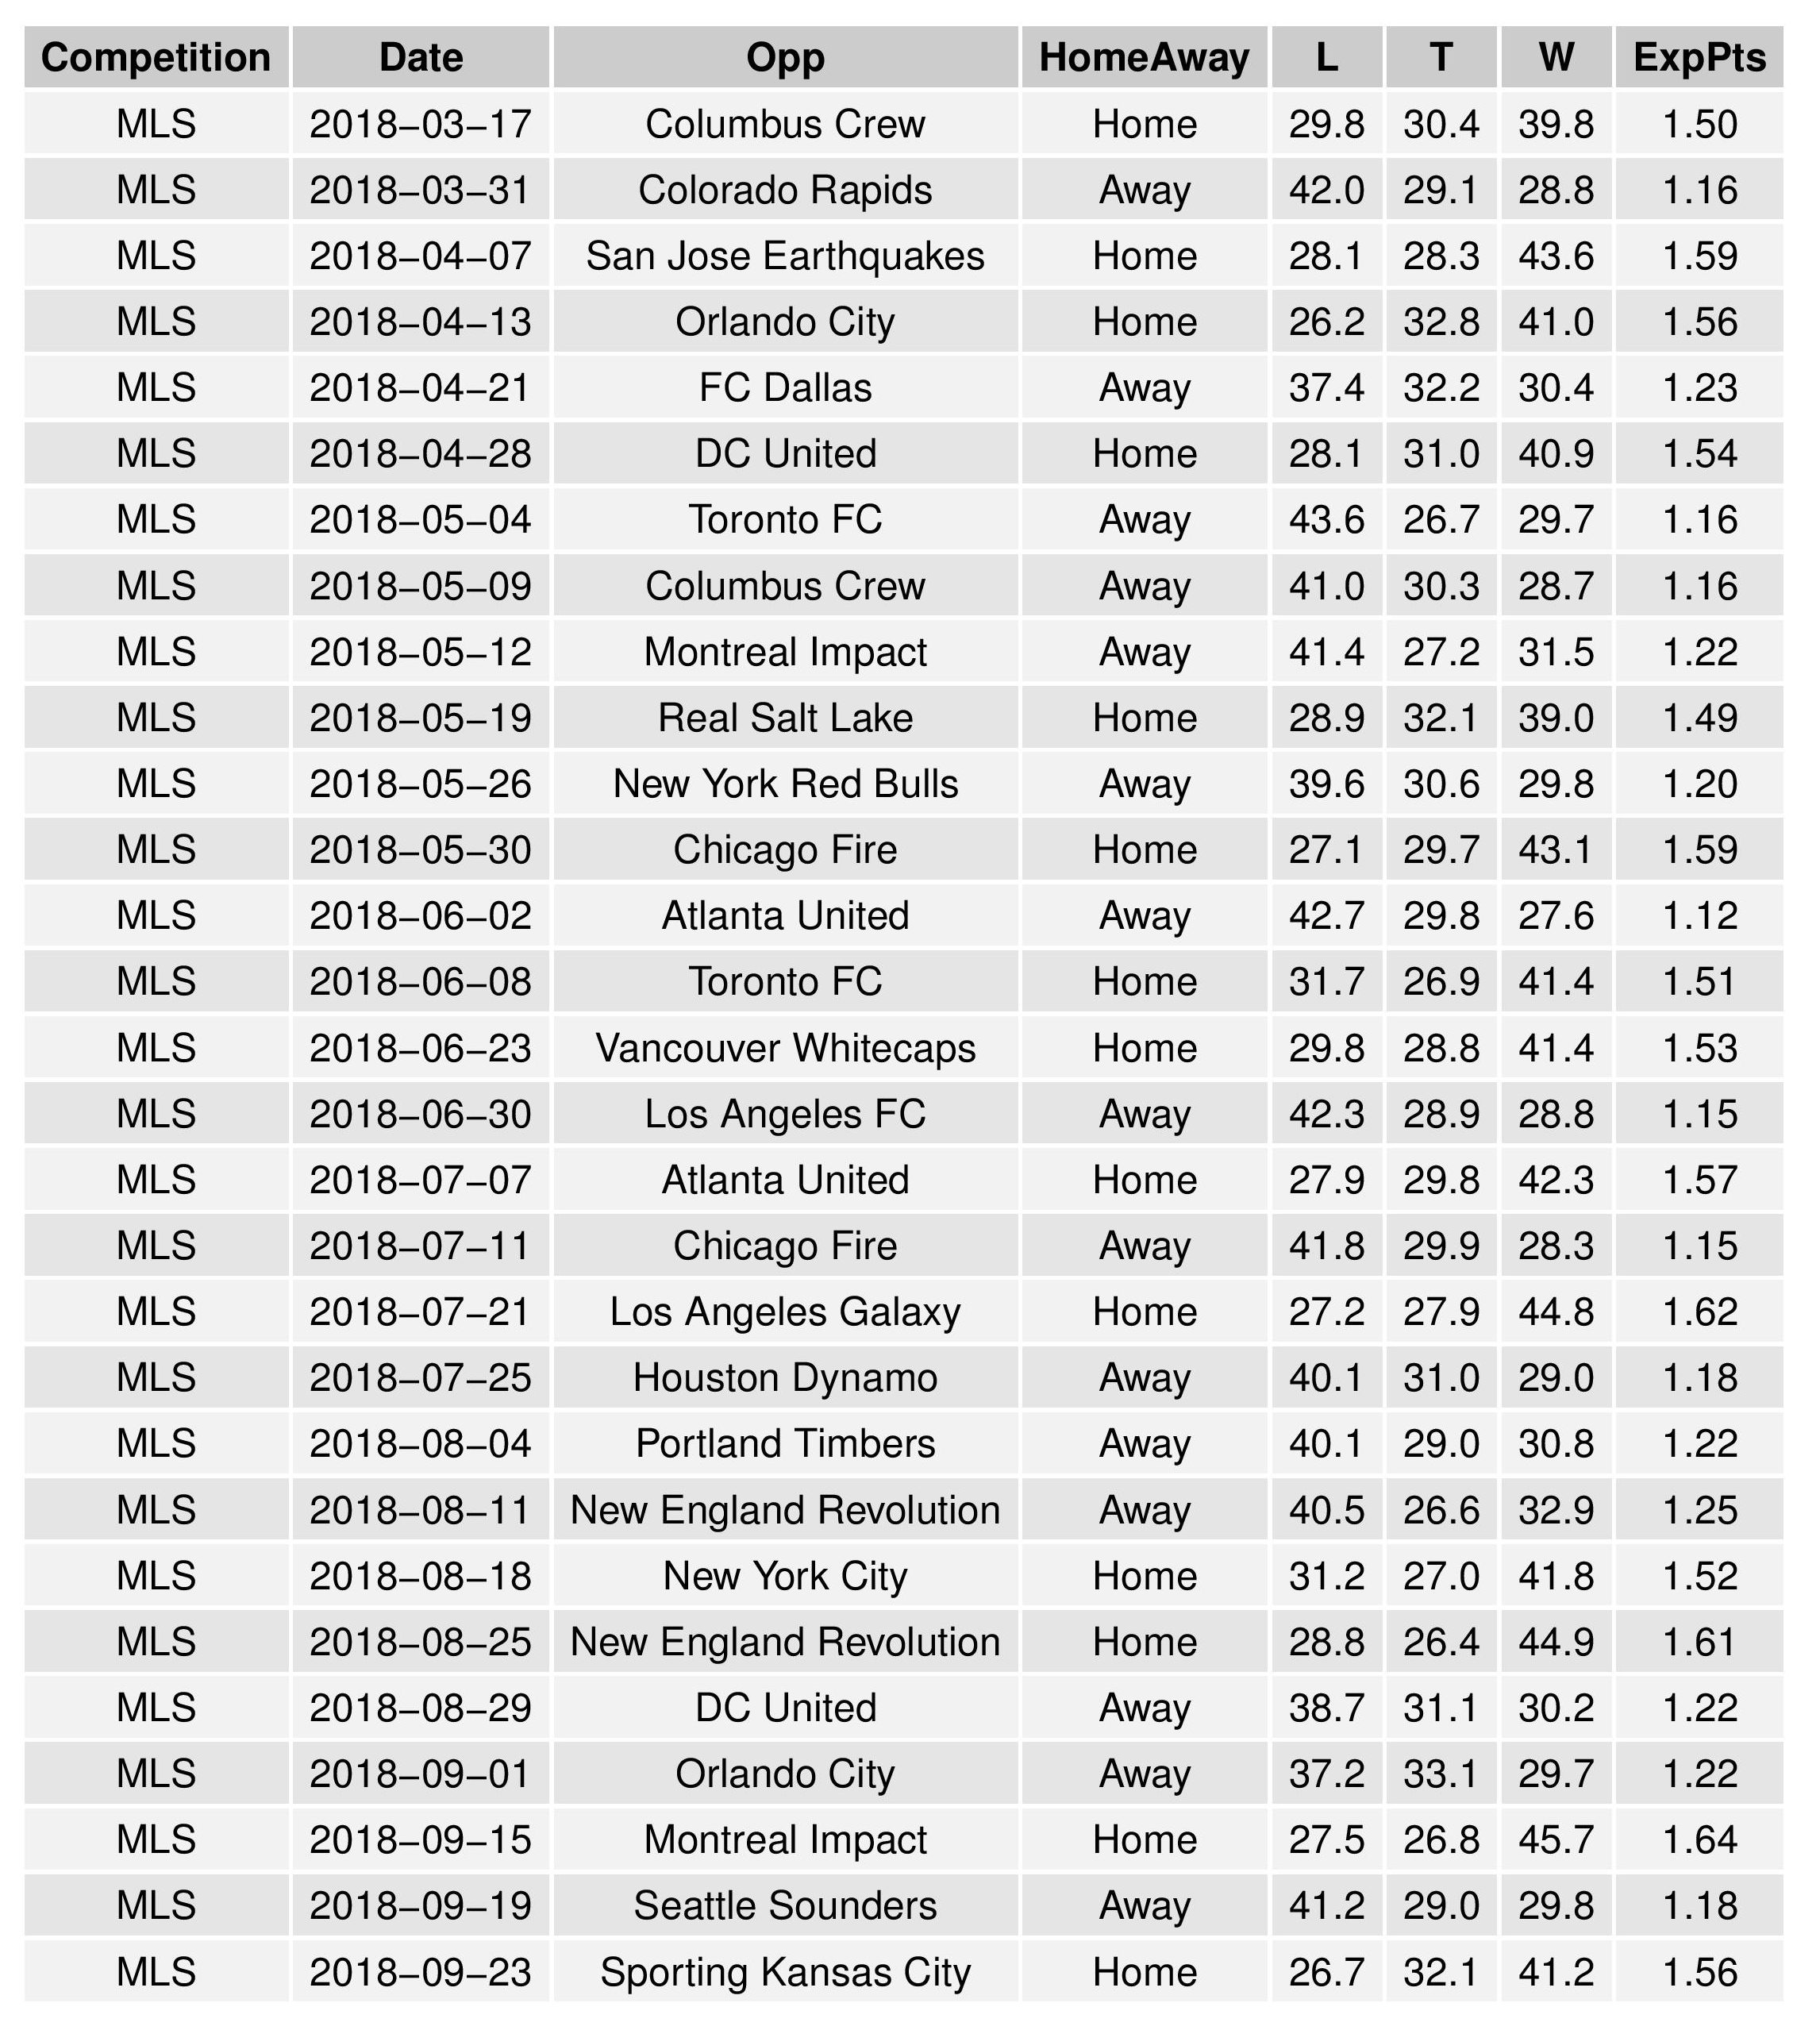
The following shows the expectations for upcoming Philadelphia matches:
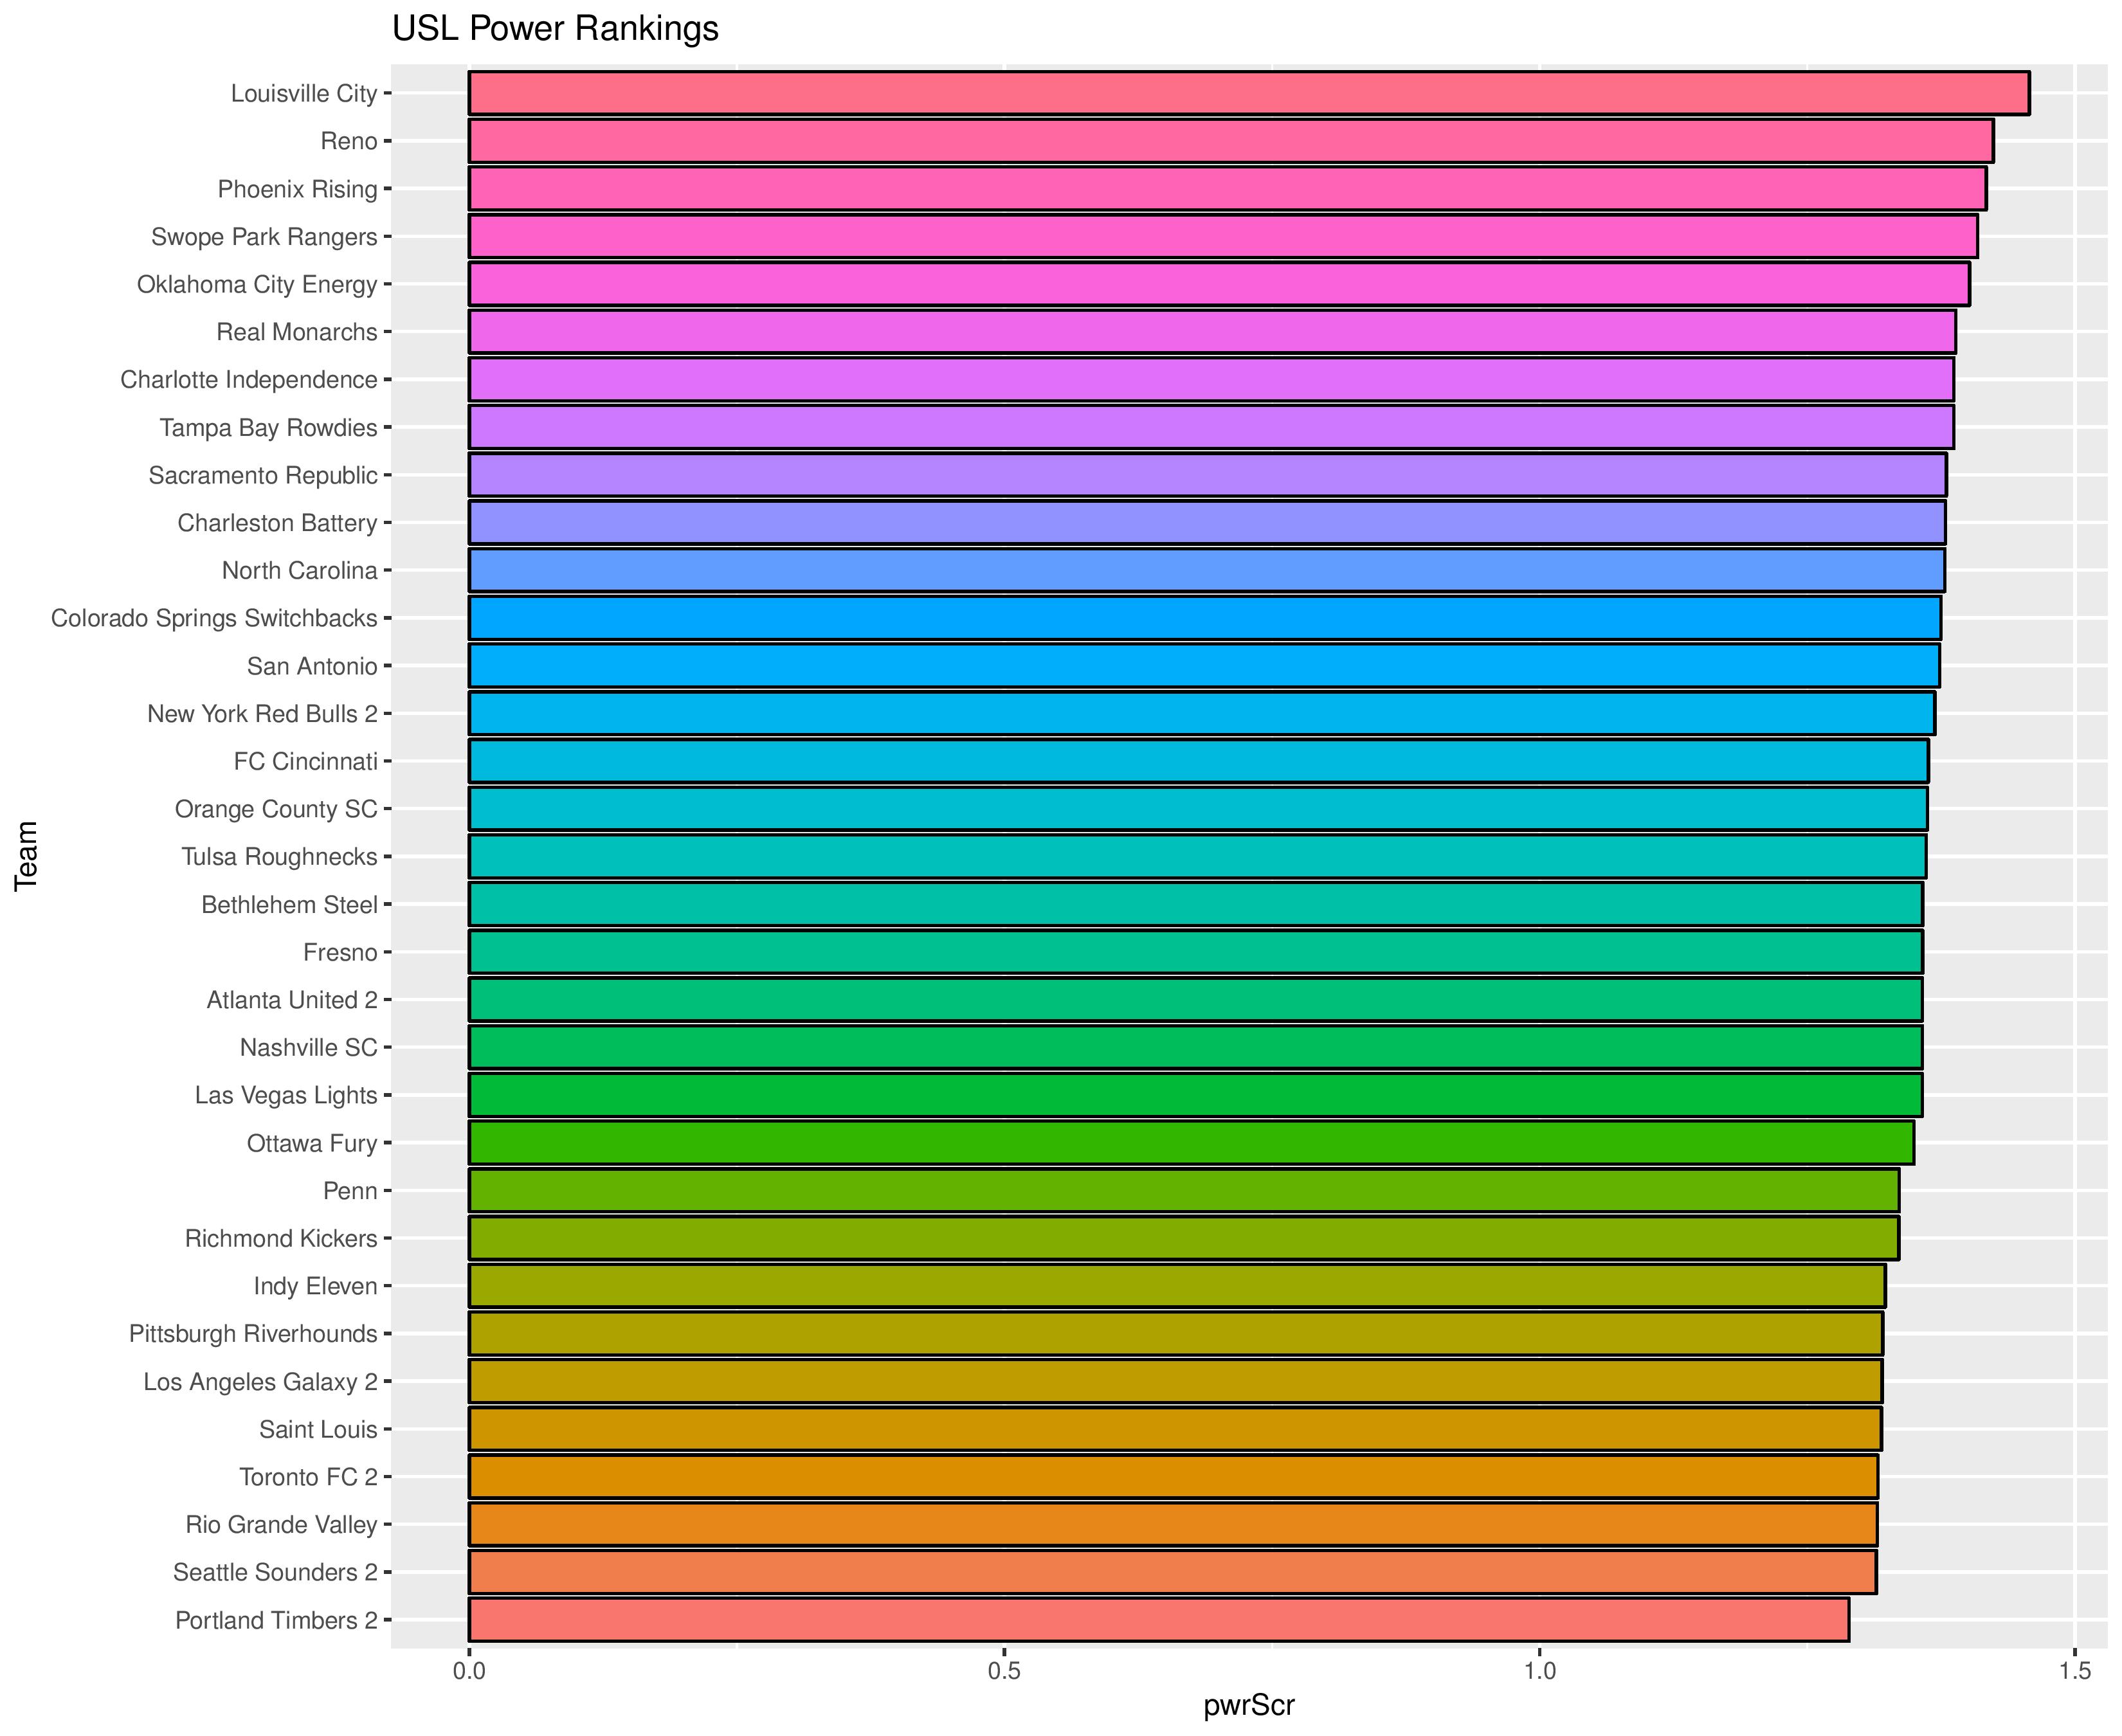
USL
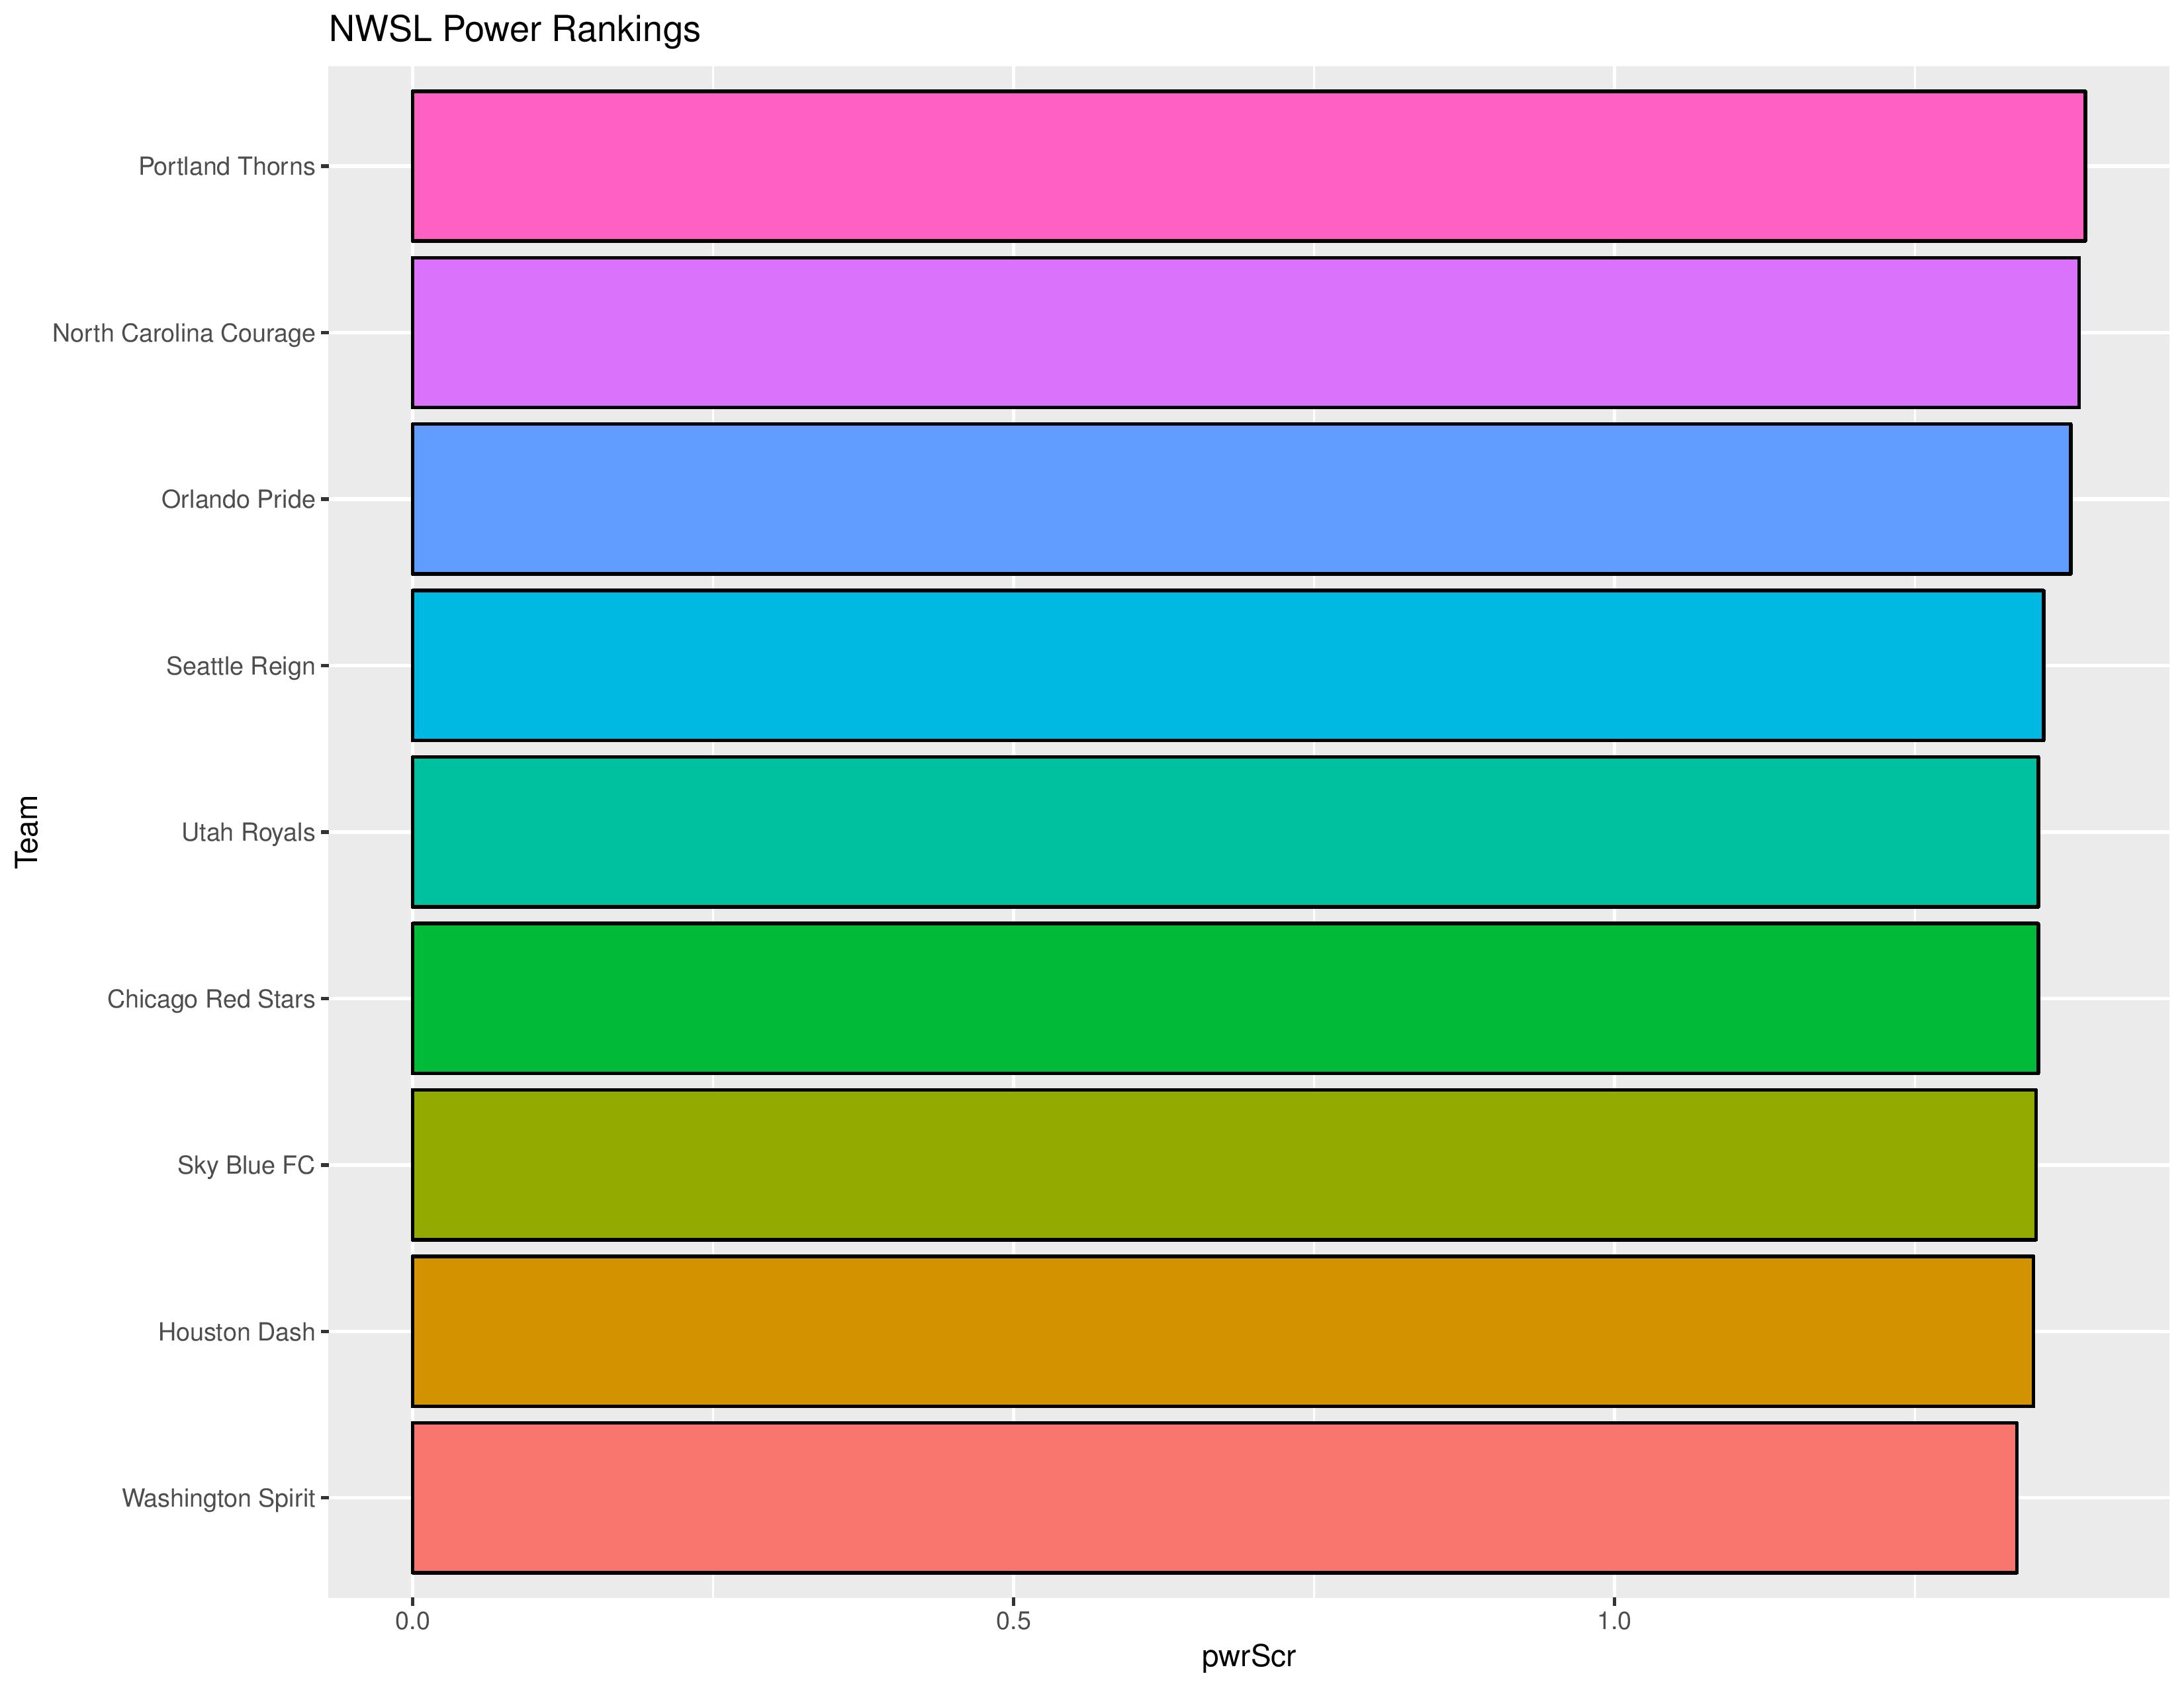
Power Rankings
SEBA has Bethlehem starting out in 18th. However, the model has no data on changes to squads, so this is largely reflective of last season’s finish (and model changes such as distance traveled).
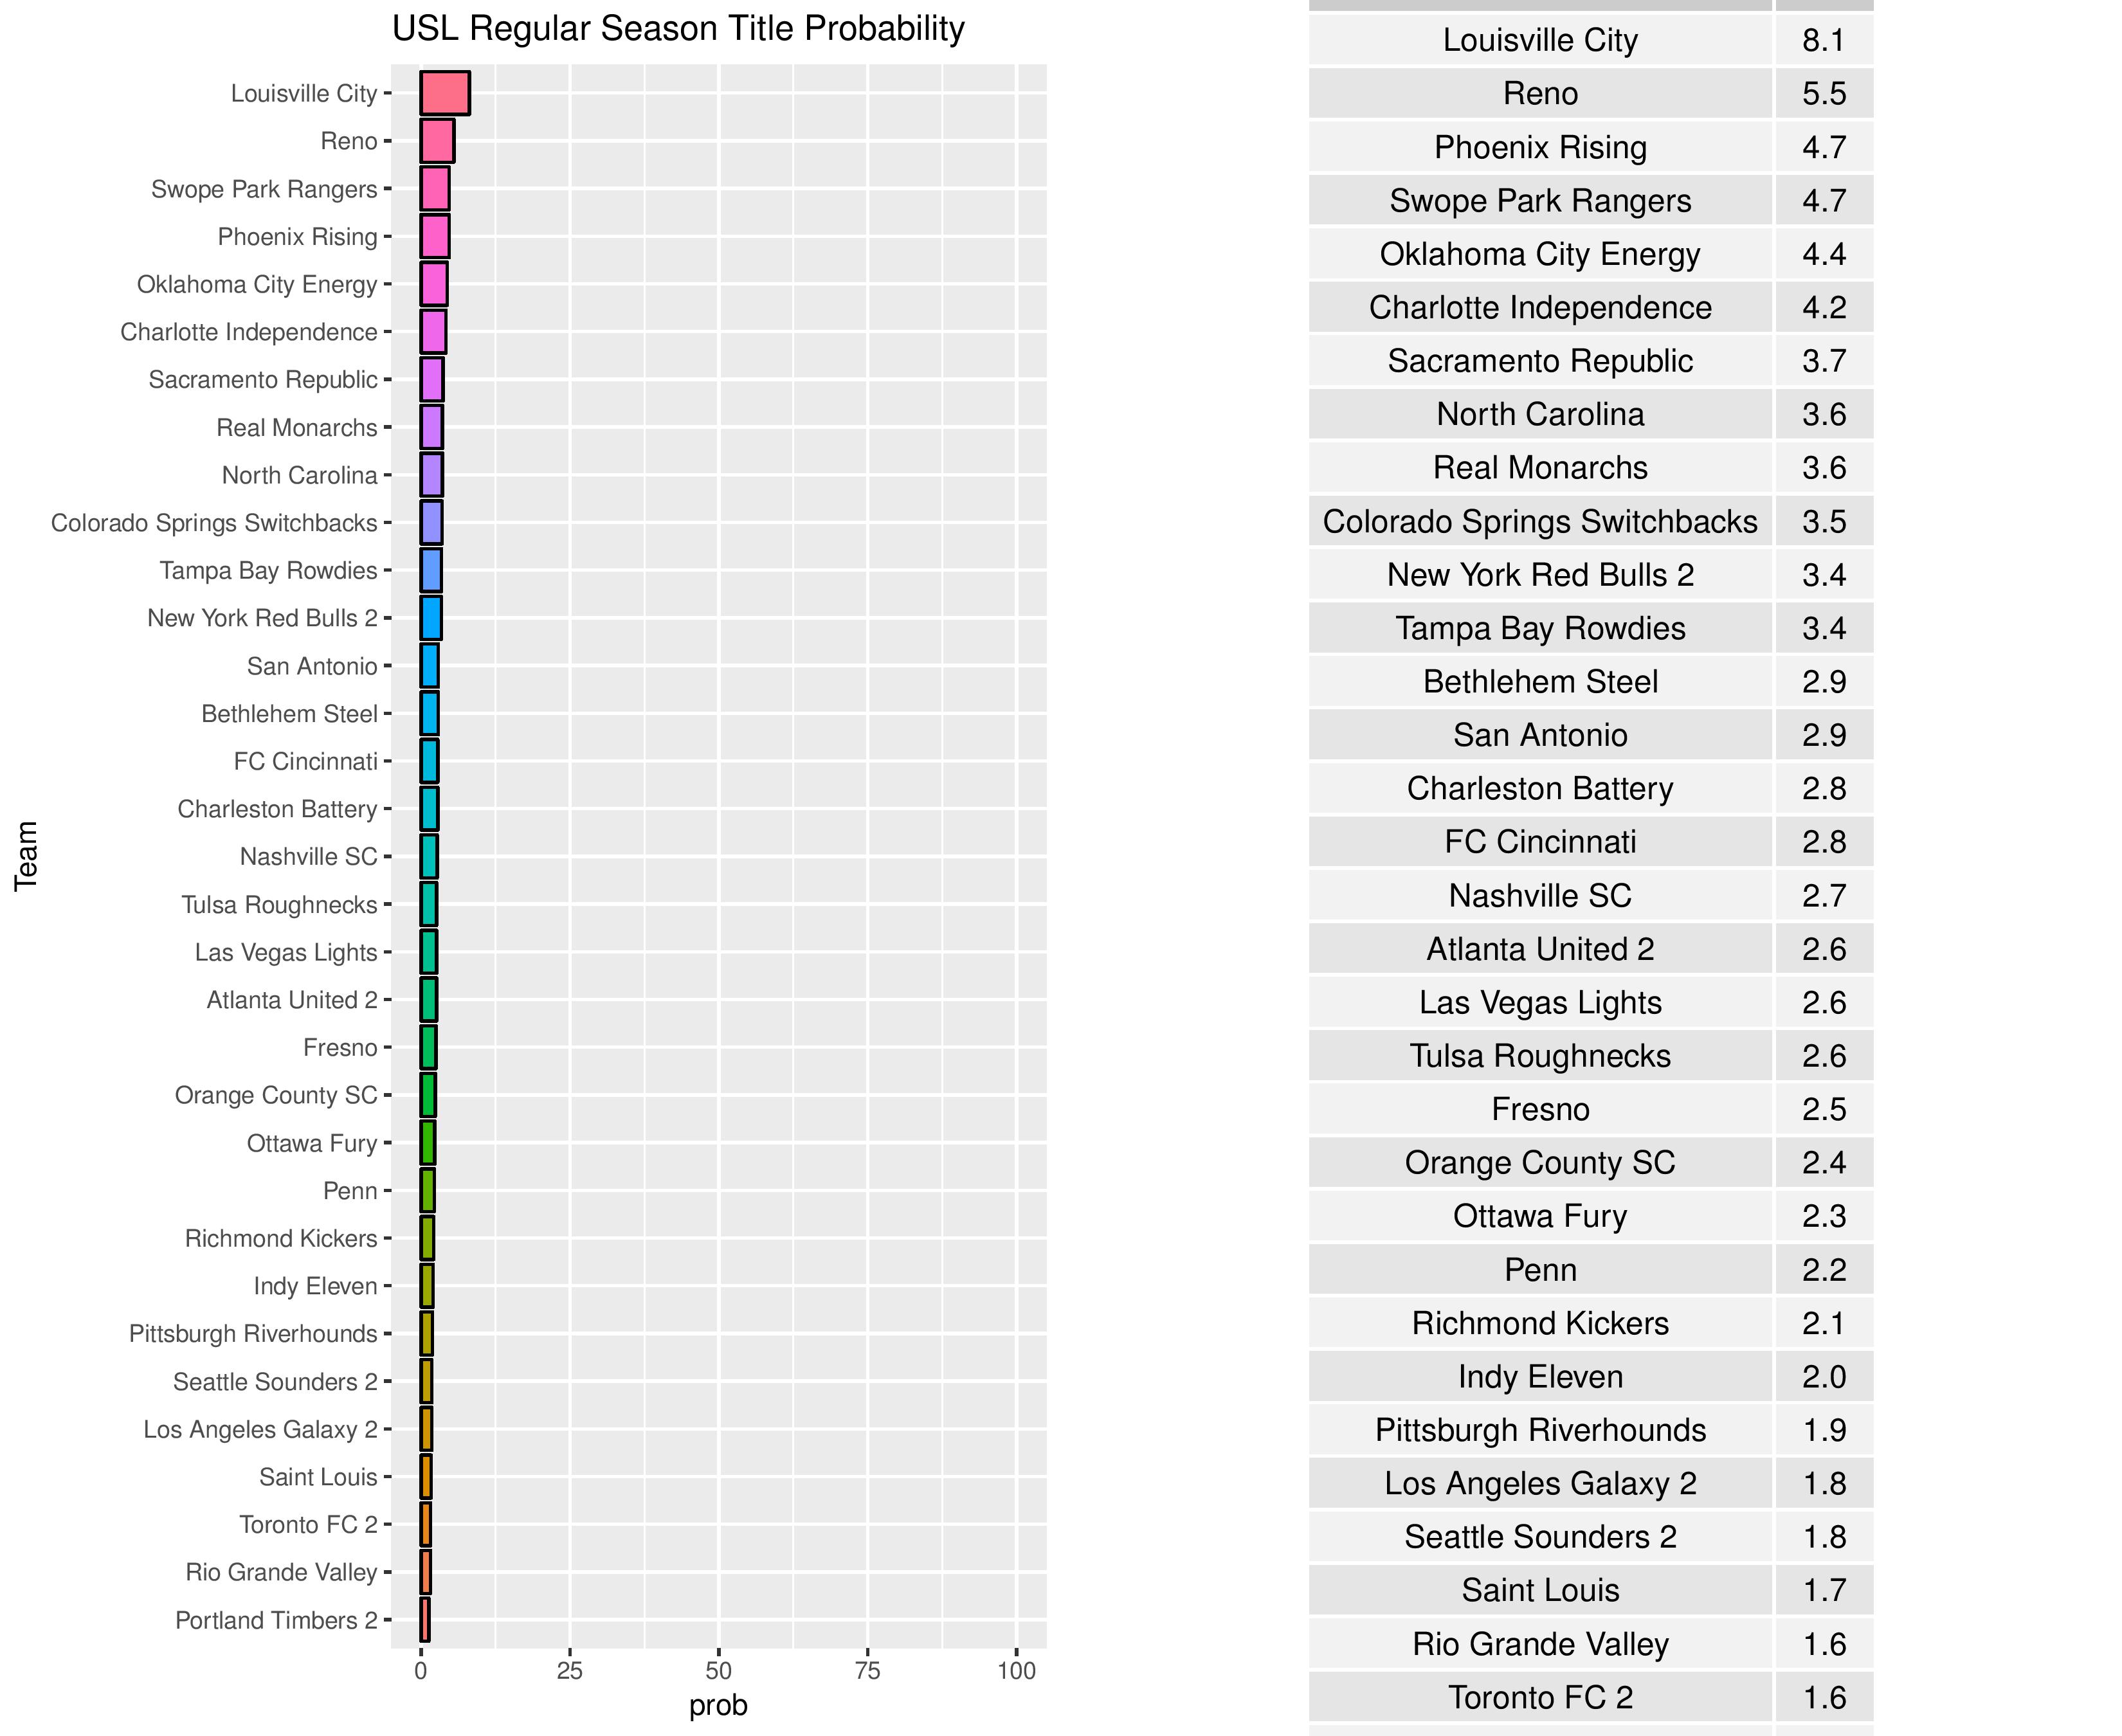
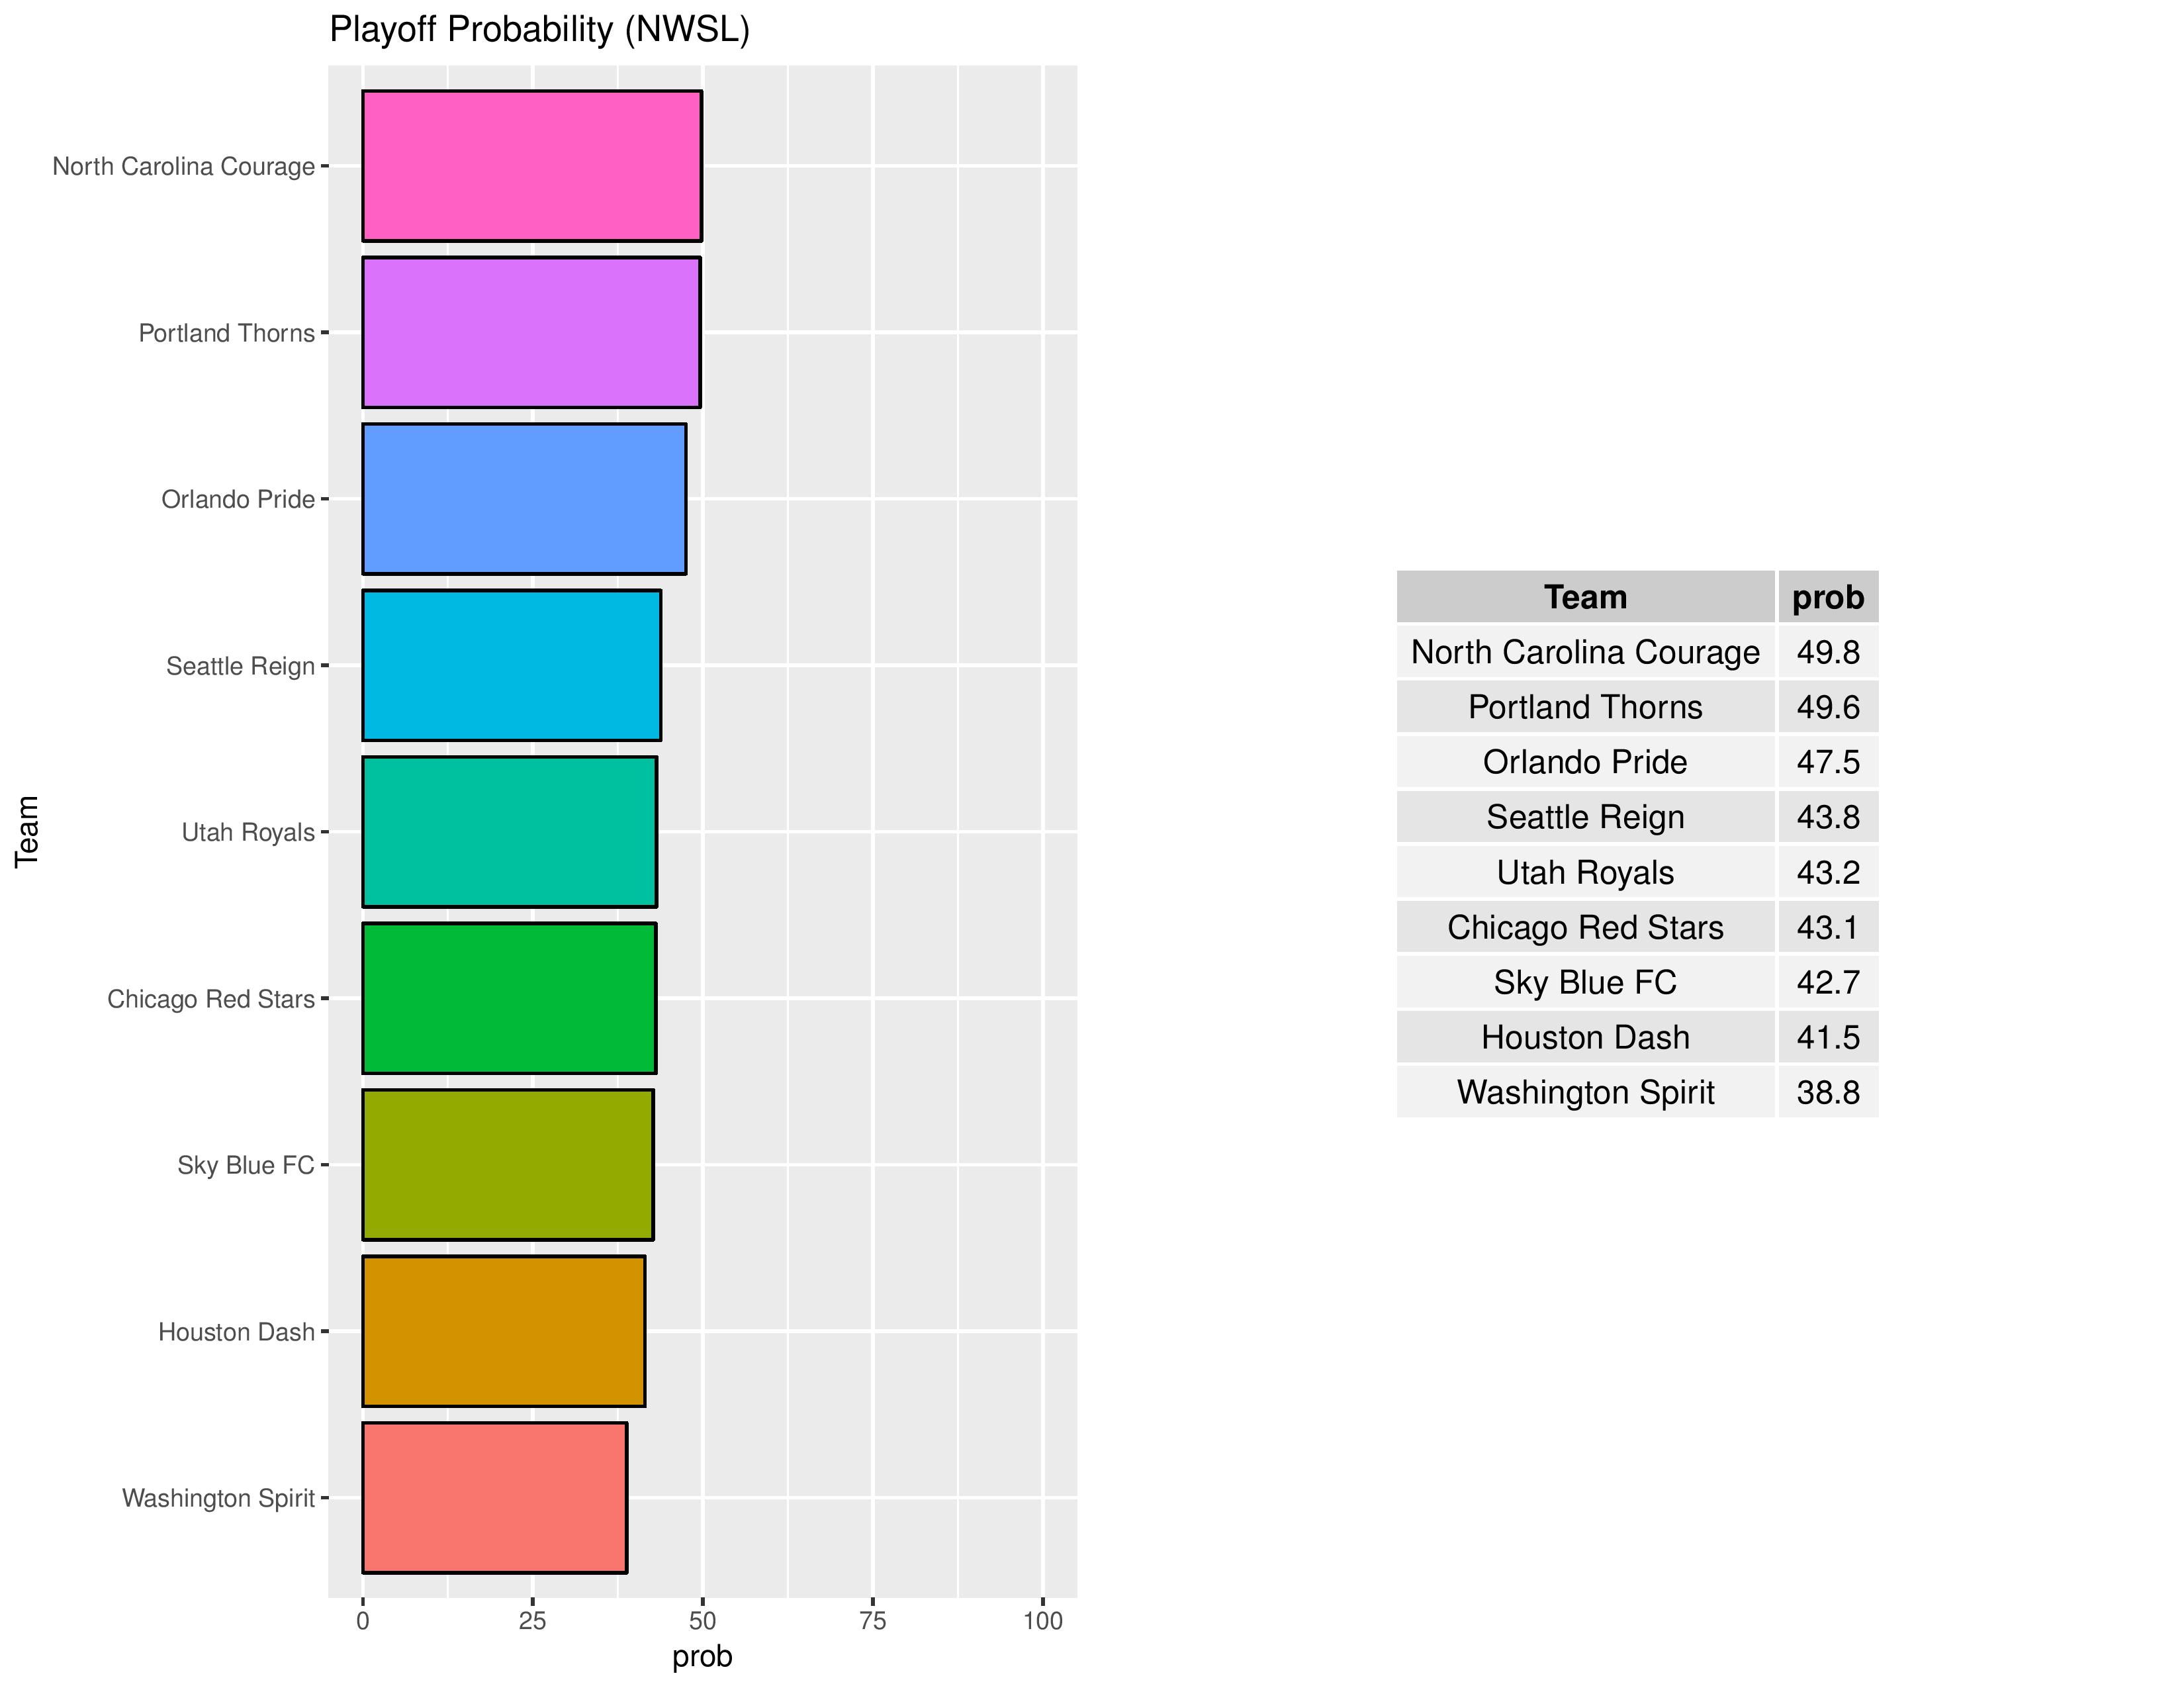
Playoffs probability and more
We start off with Bethlehem at 49.2% chance of making the playoffs. (Sorry for the cutoff table, I’m working on it, but the interactive charts linked above should be easier to read)

We give Bethlehem a 2.9% chance of claiming the USL regular season title.
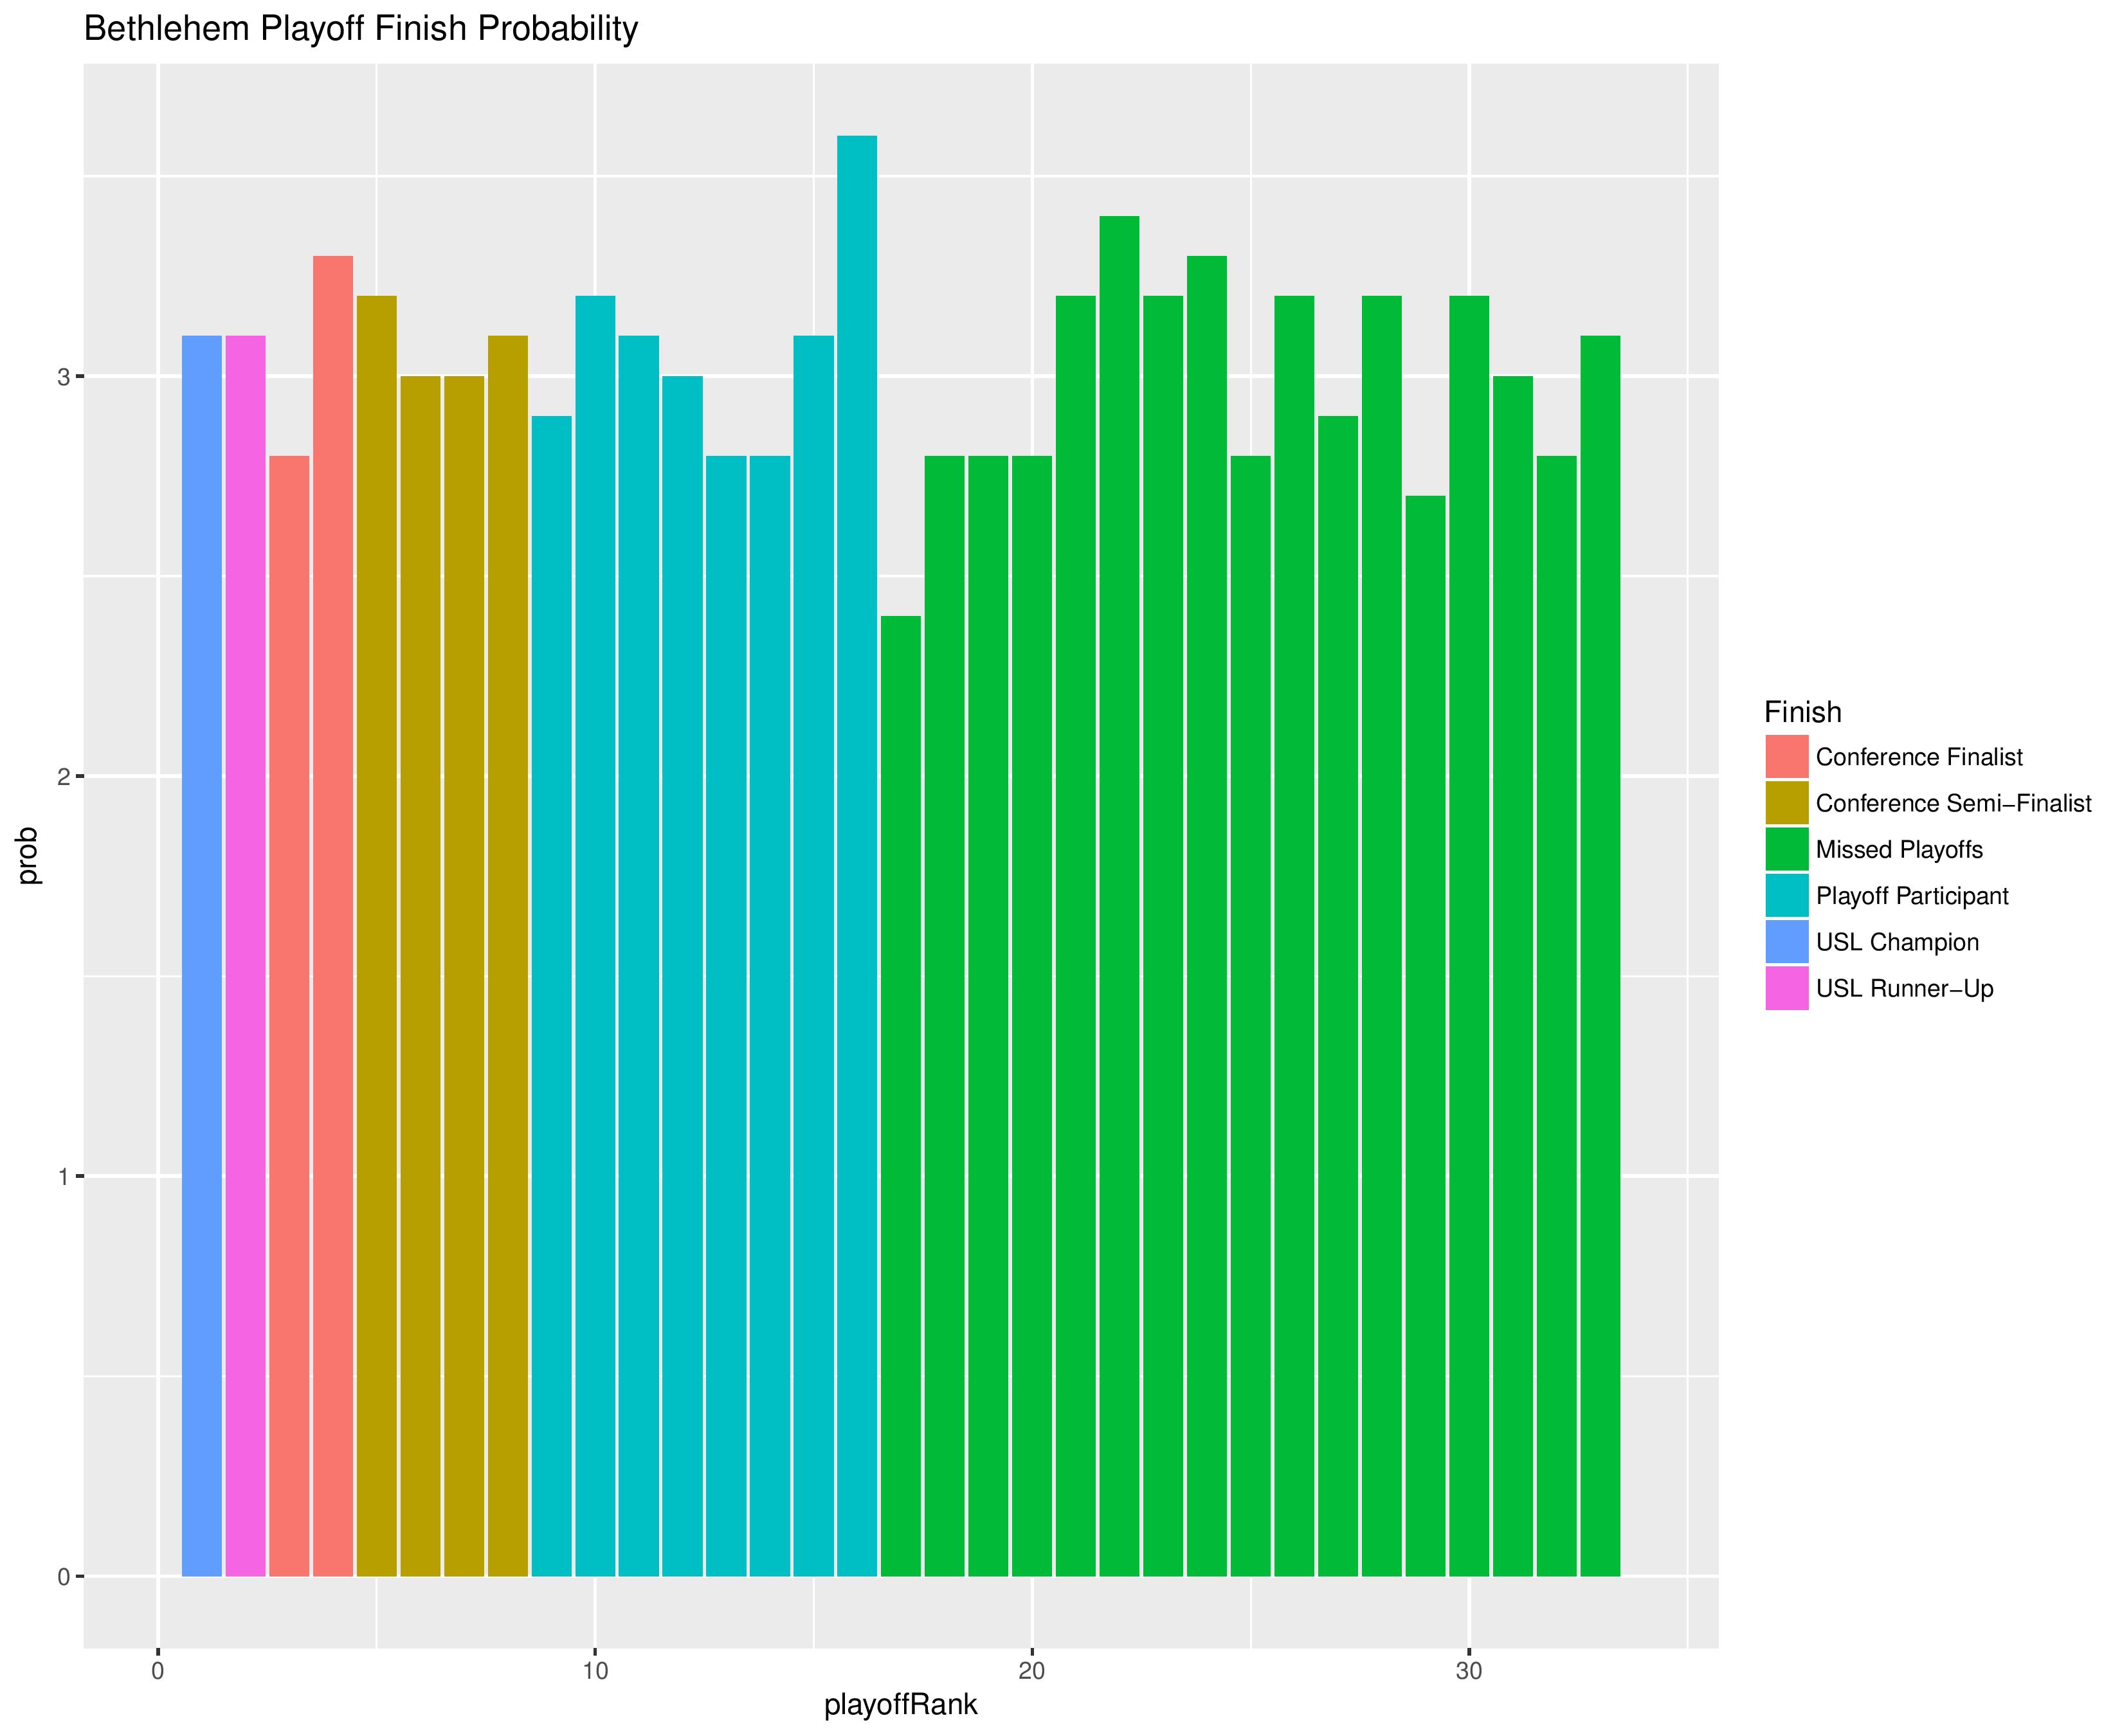
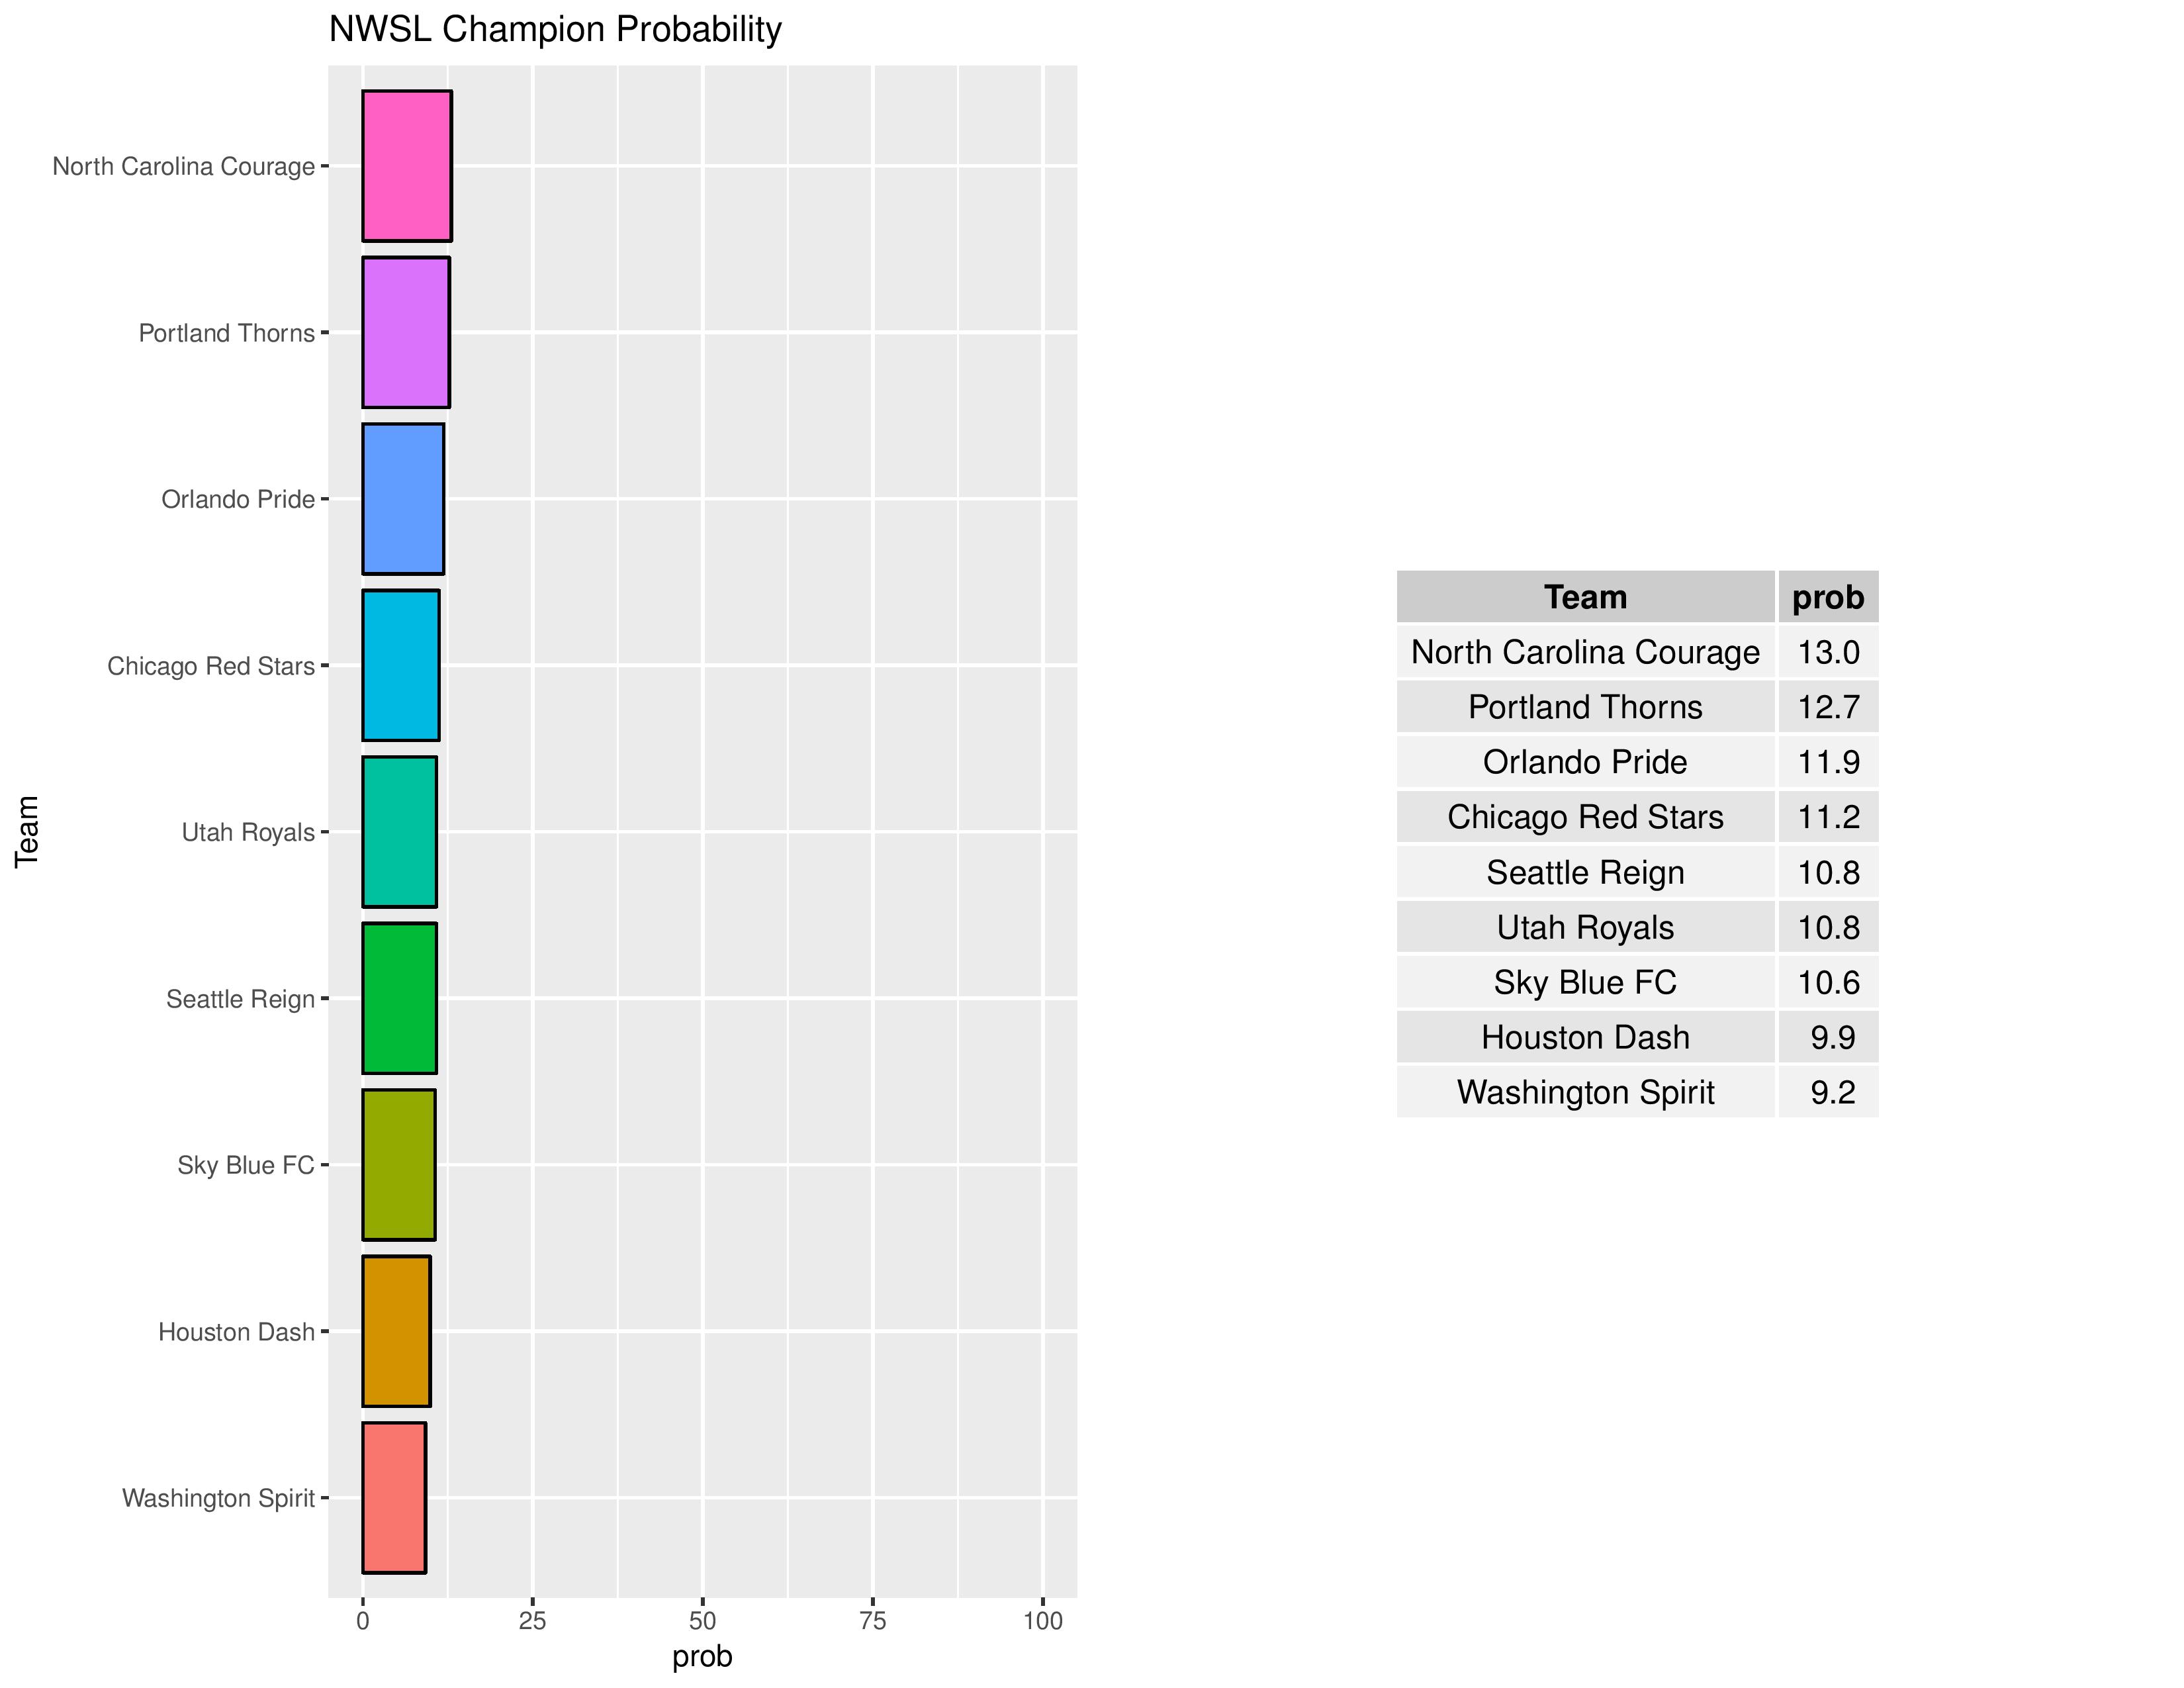
Bethlehem’s odds of winning the USL championship start off at 3.1%.

The following shows the probability of each post-playoff ranking finish:
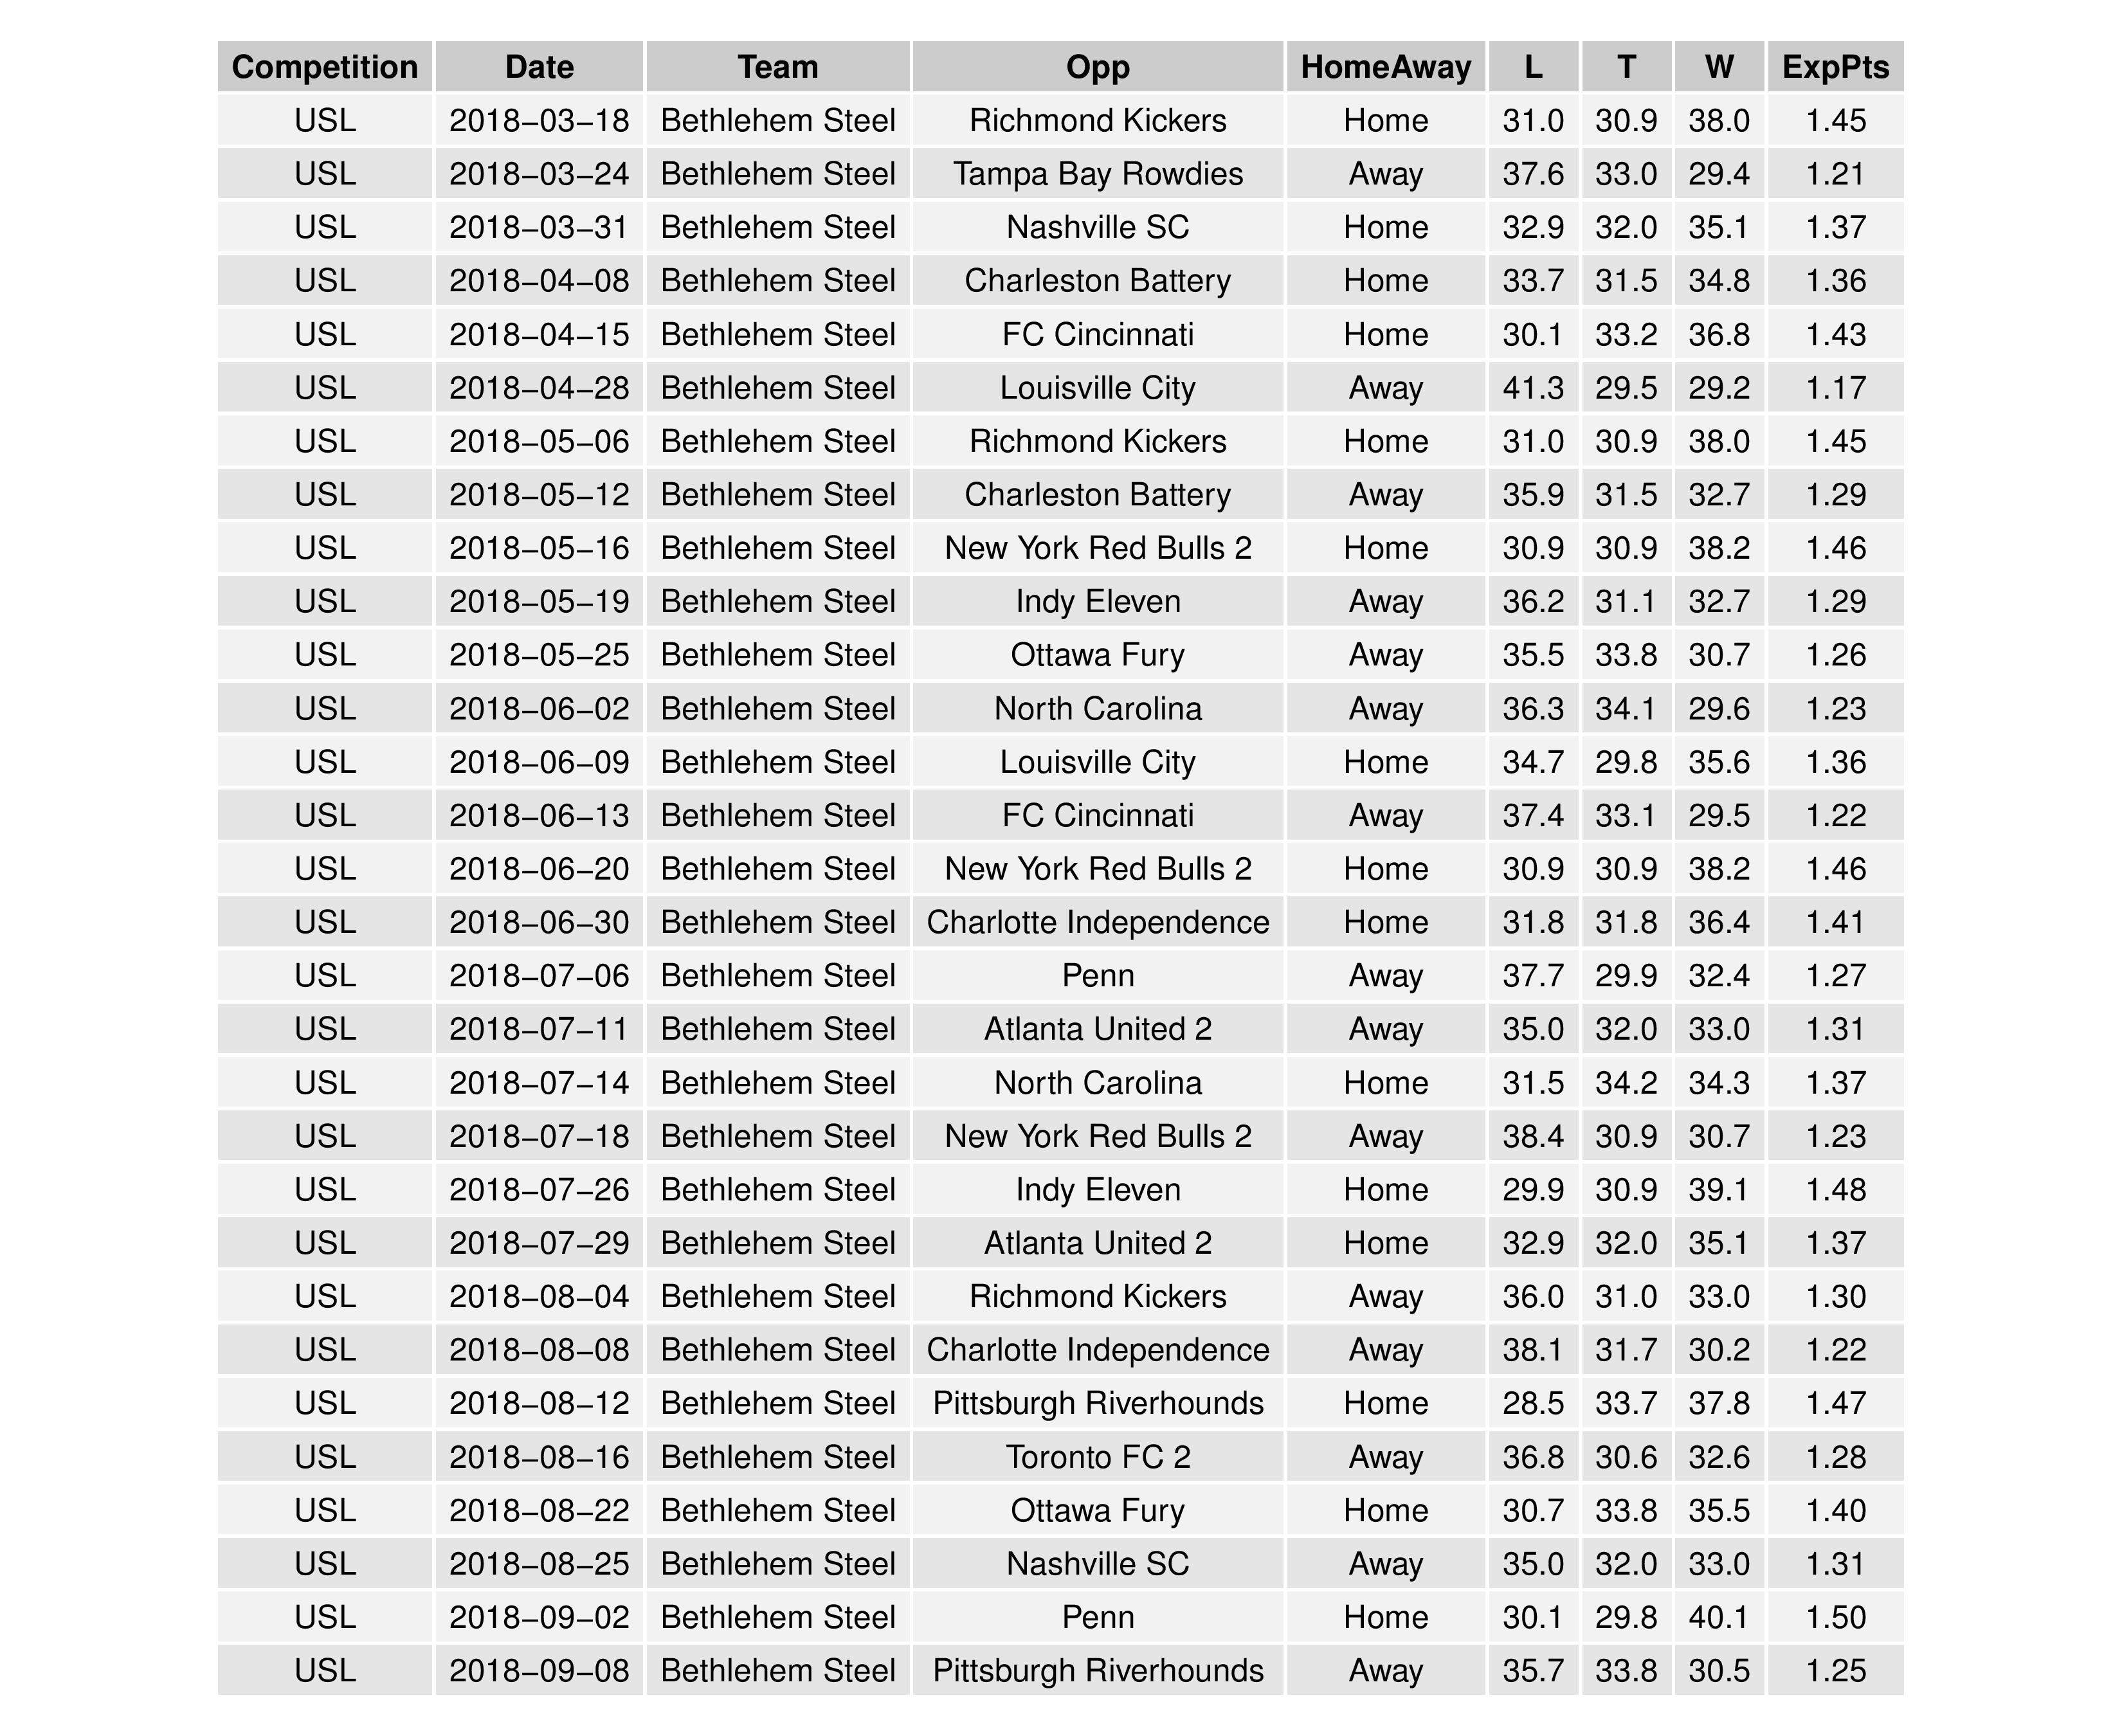
The following are the upcoming expectations for Bethlehem matches.
NWSL
The following are the initial projections for the 2018 NWSL season. Like the USL, these are based solely on matches from 2017 and the additional factor of distance traveled.

The following shows the strength of schedule, as we project.

Below is the table form of the above. “AdvPerc” is the percentage advantage in points that a team has over the league average, so higher is an easier schedule.


Chris, what informed your “baseline” assumption about each team’s chances? In other words, what was your starting point, before any Week 1 match results?
As far as the team’s assessments (excluding other factors such as home/away and distance traveled), it was based upon the previous season’s results, weighted by how many of the players in those matches were still on the team’s roster.
–
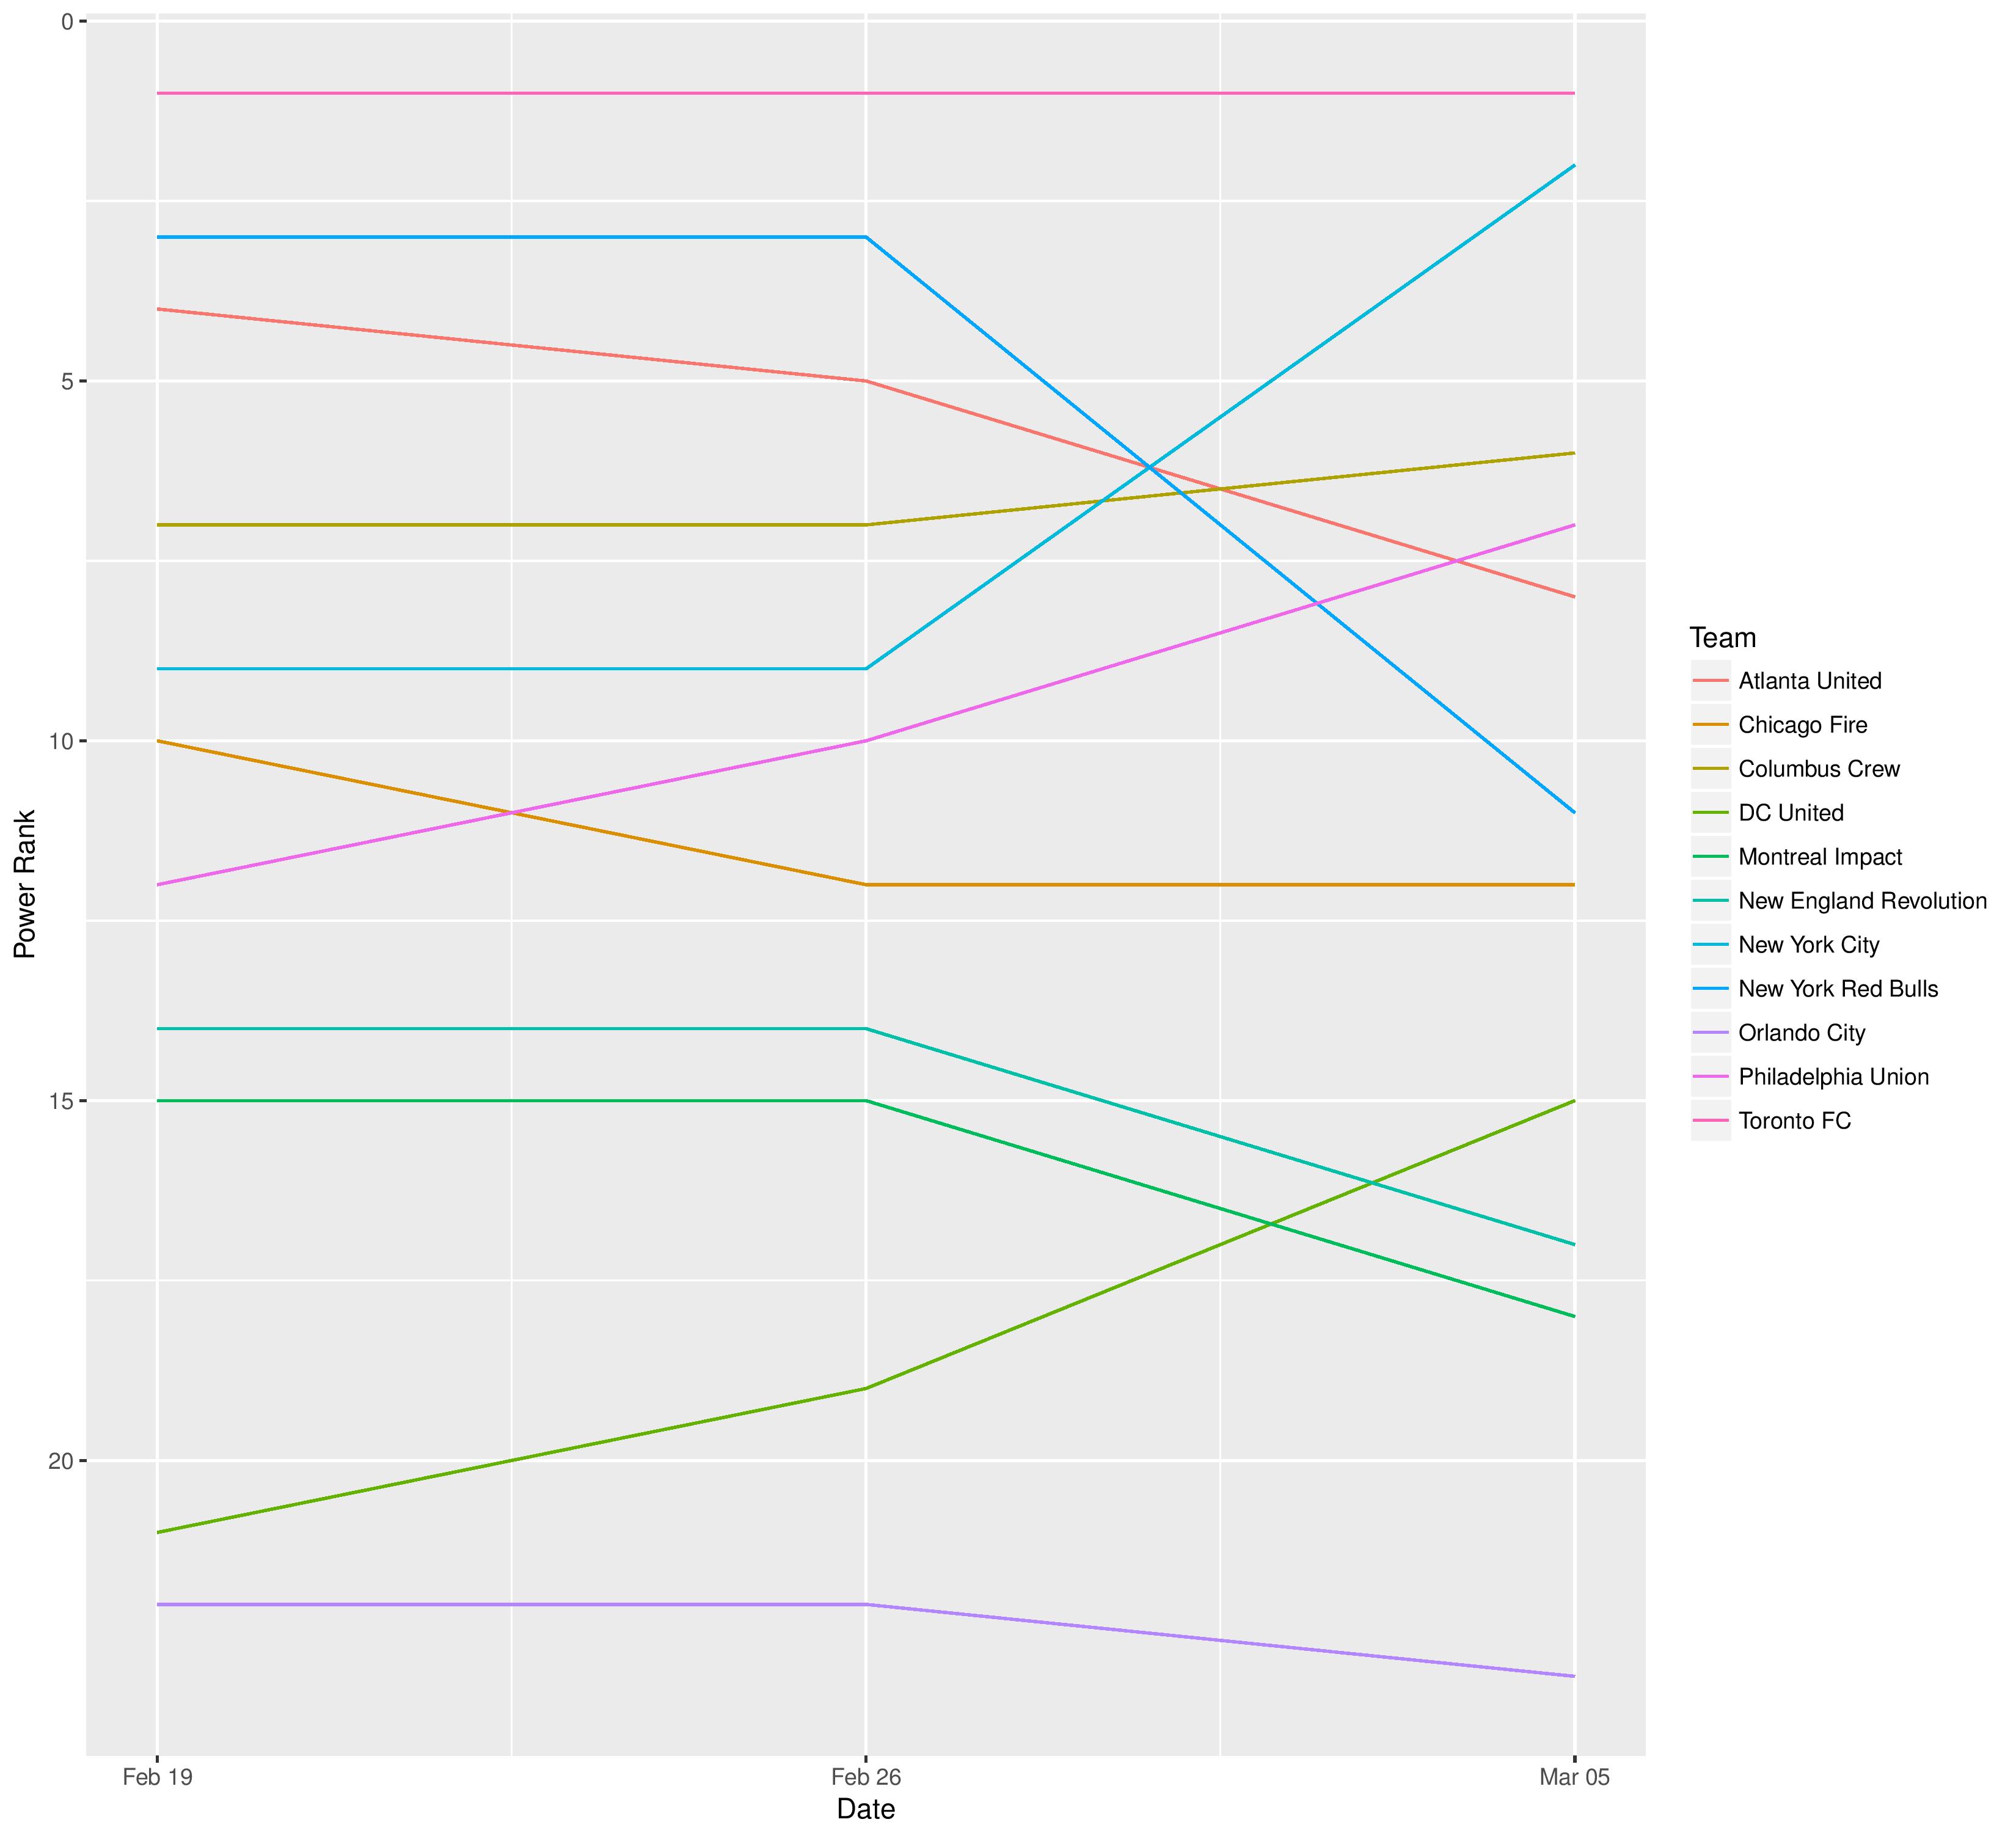
Last week’s post of power rankings should give you a sense for how the model considered them prior to week 1 (although there were a few CCL matches). If you look at the interactive chart’s pwrScr over time, you should have a sense for how the model’s opinion of teams change throughout the course of the season.
–
Did I answer your question?