Below are the updated season forecasts using data from games through April 23, 2017.
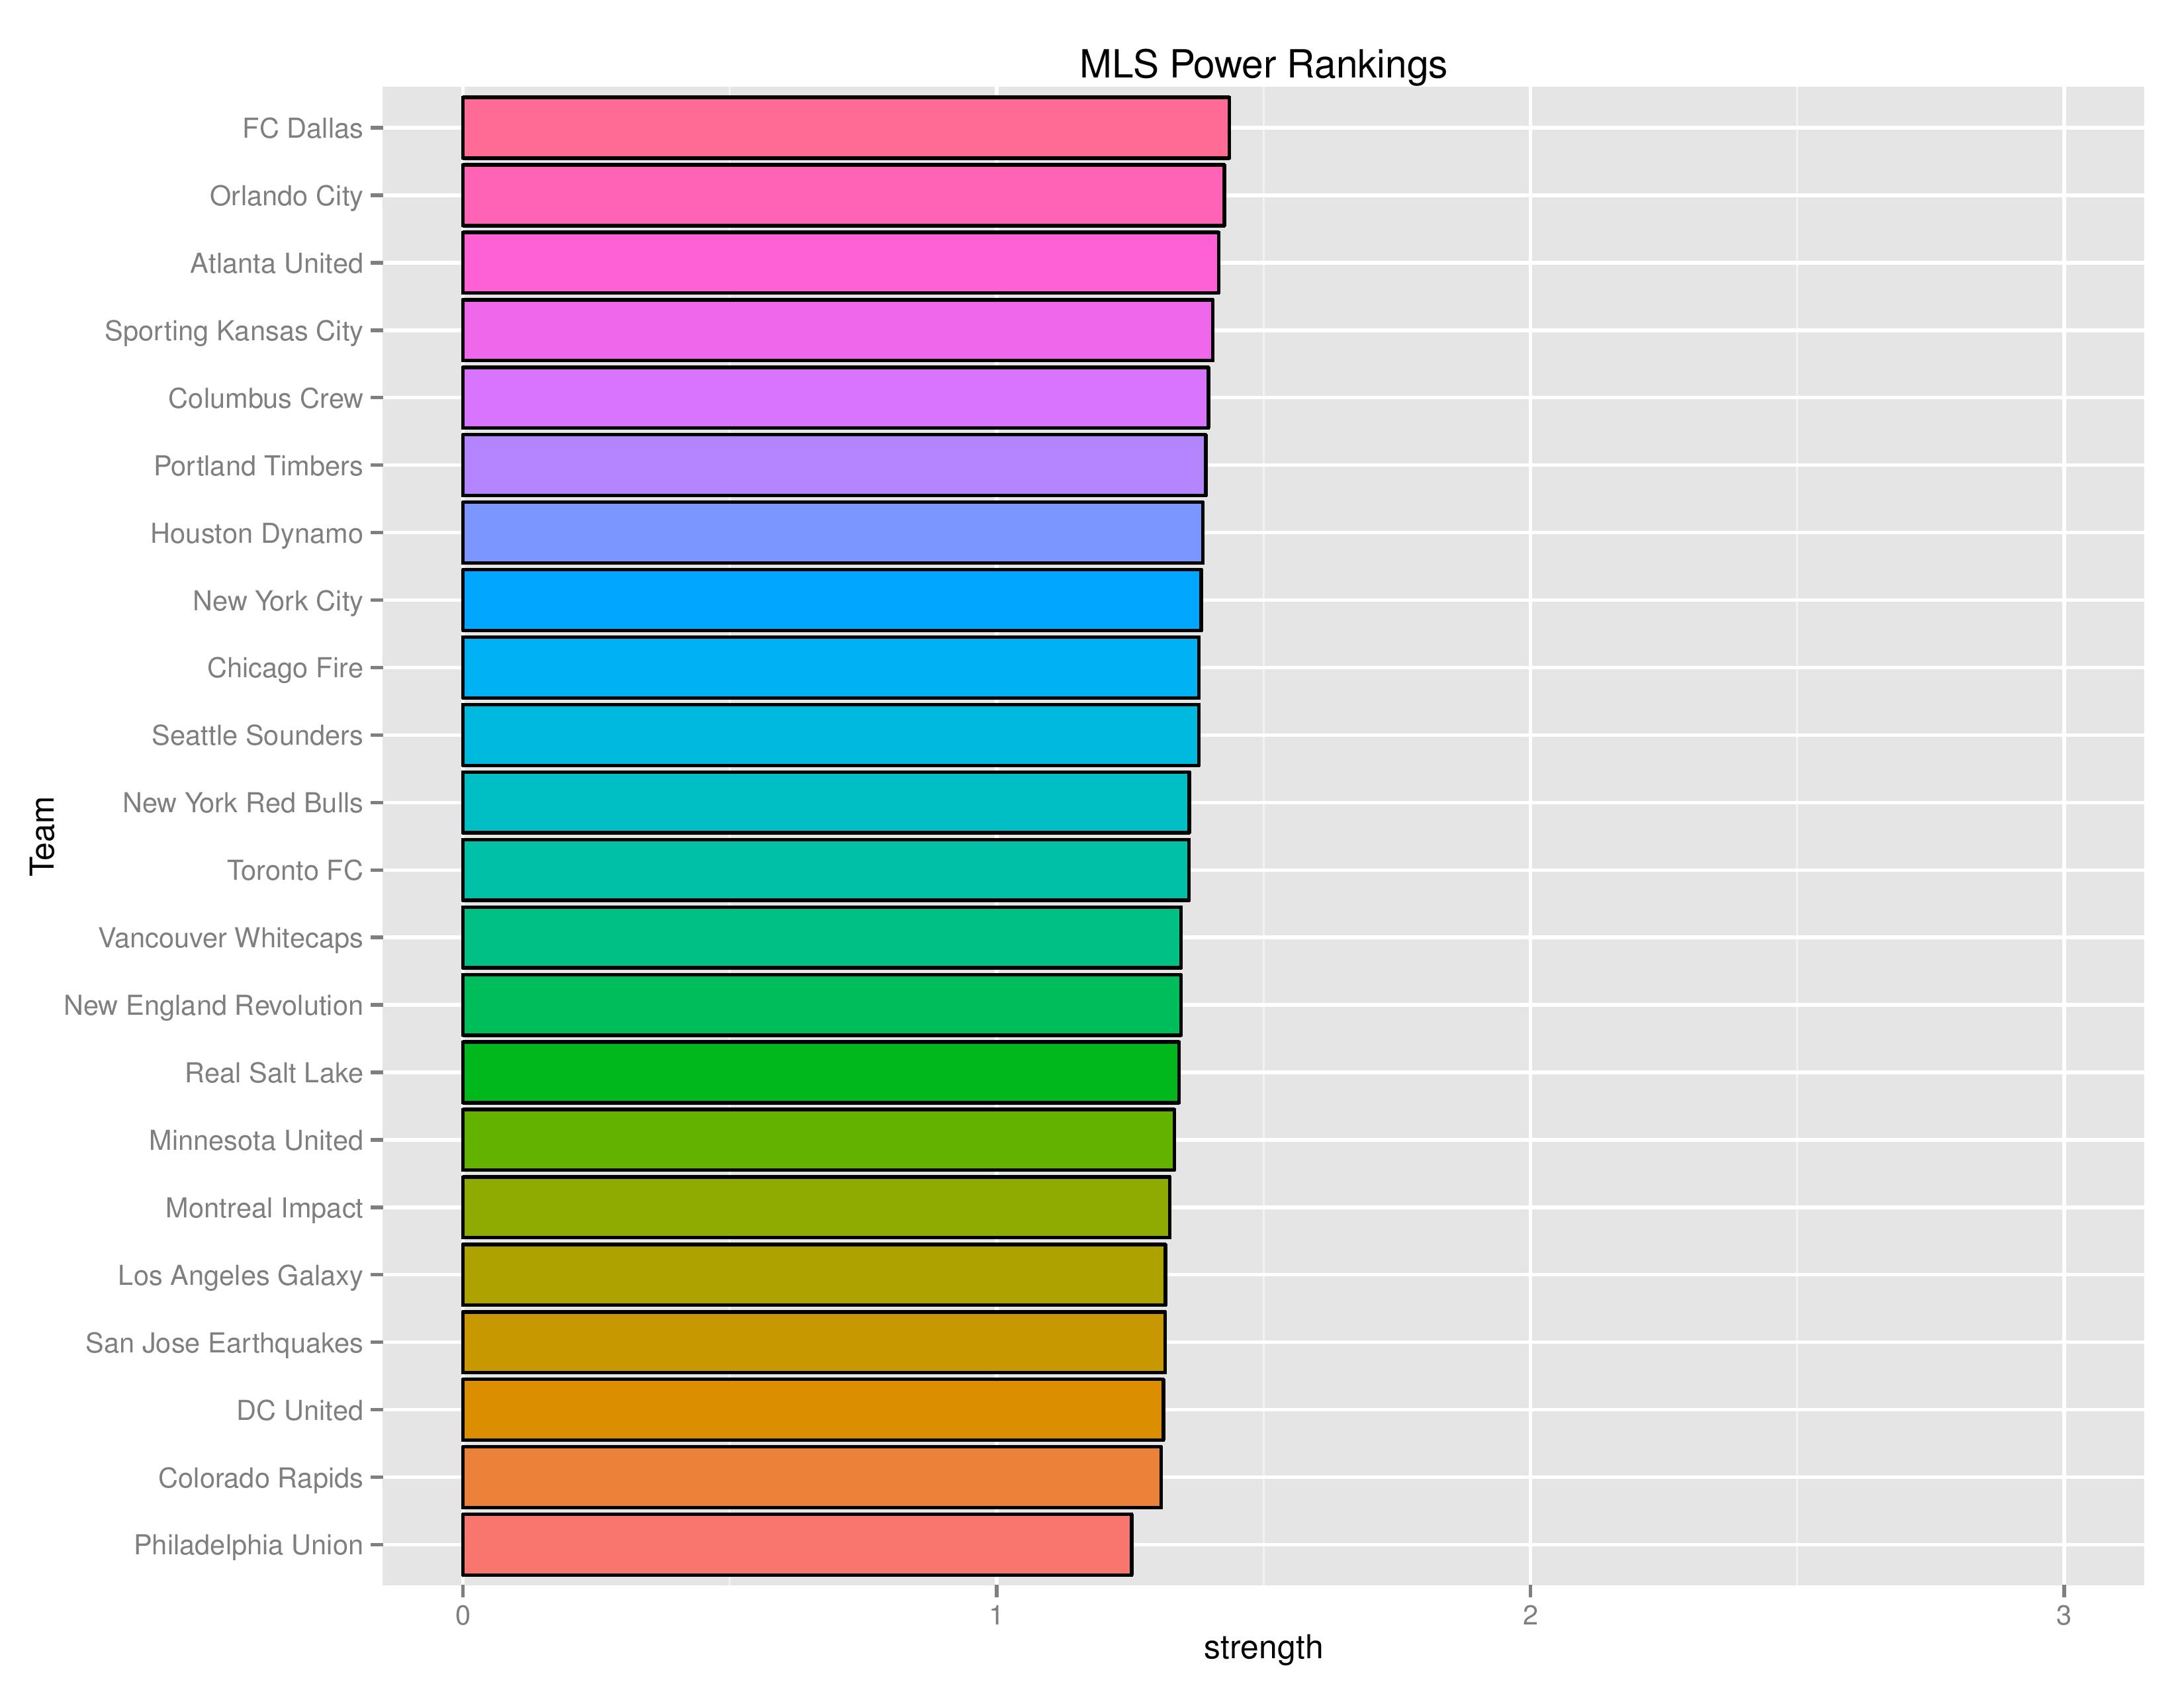
Power Rankings
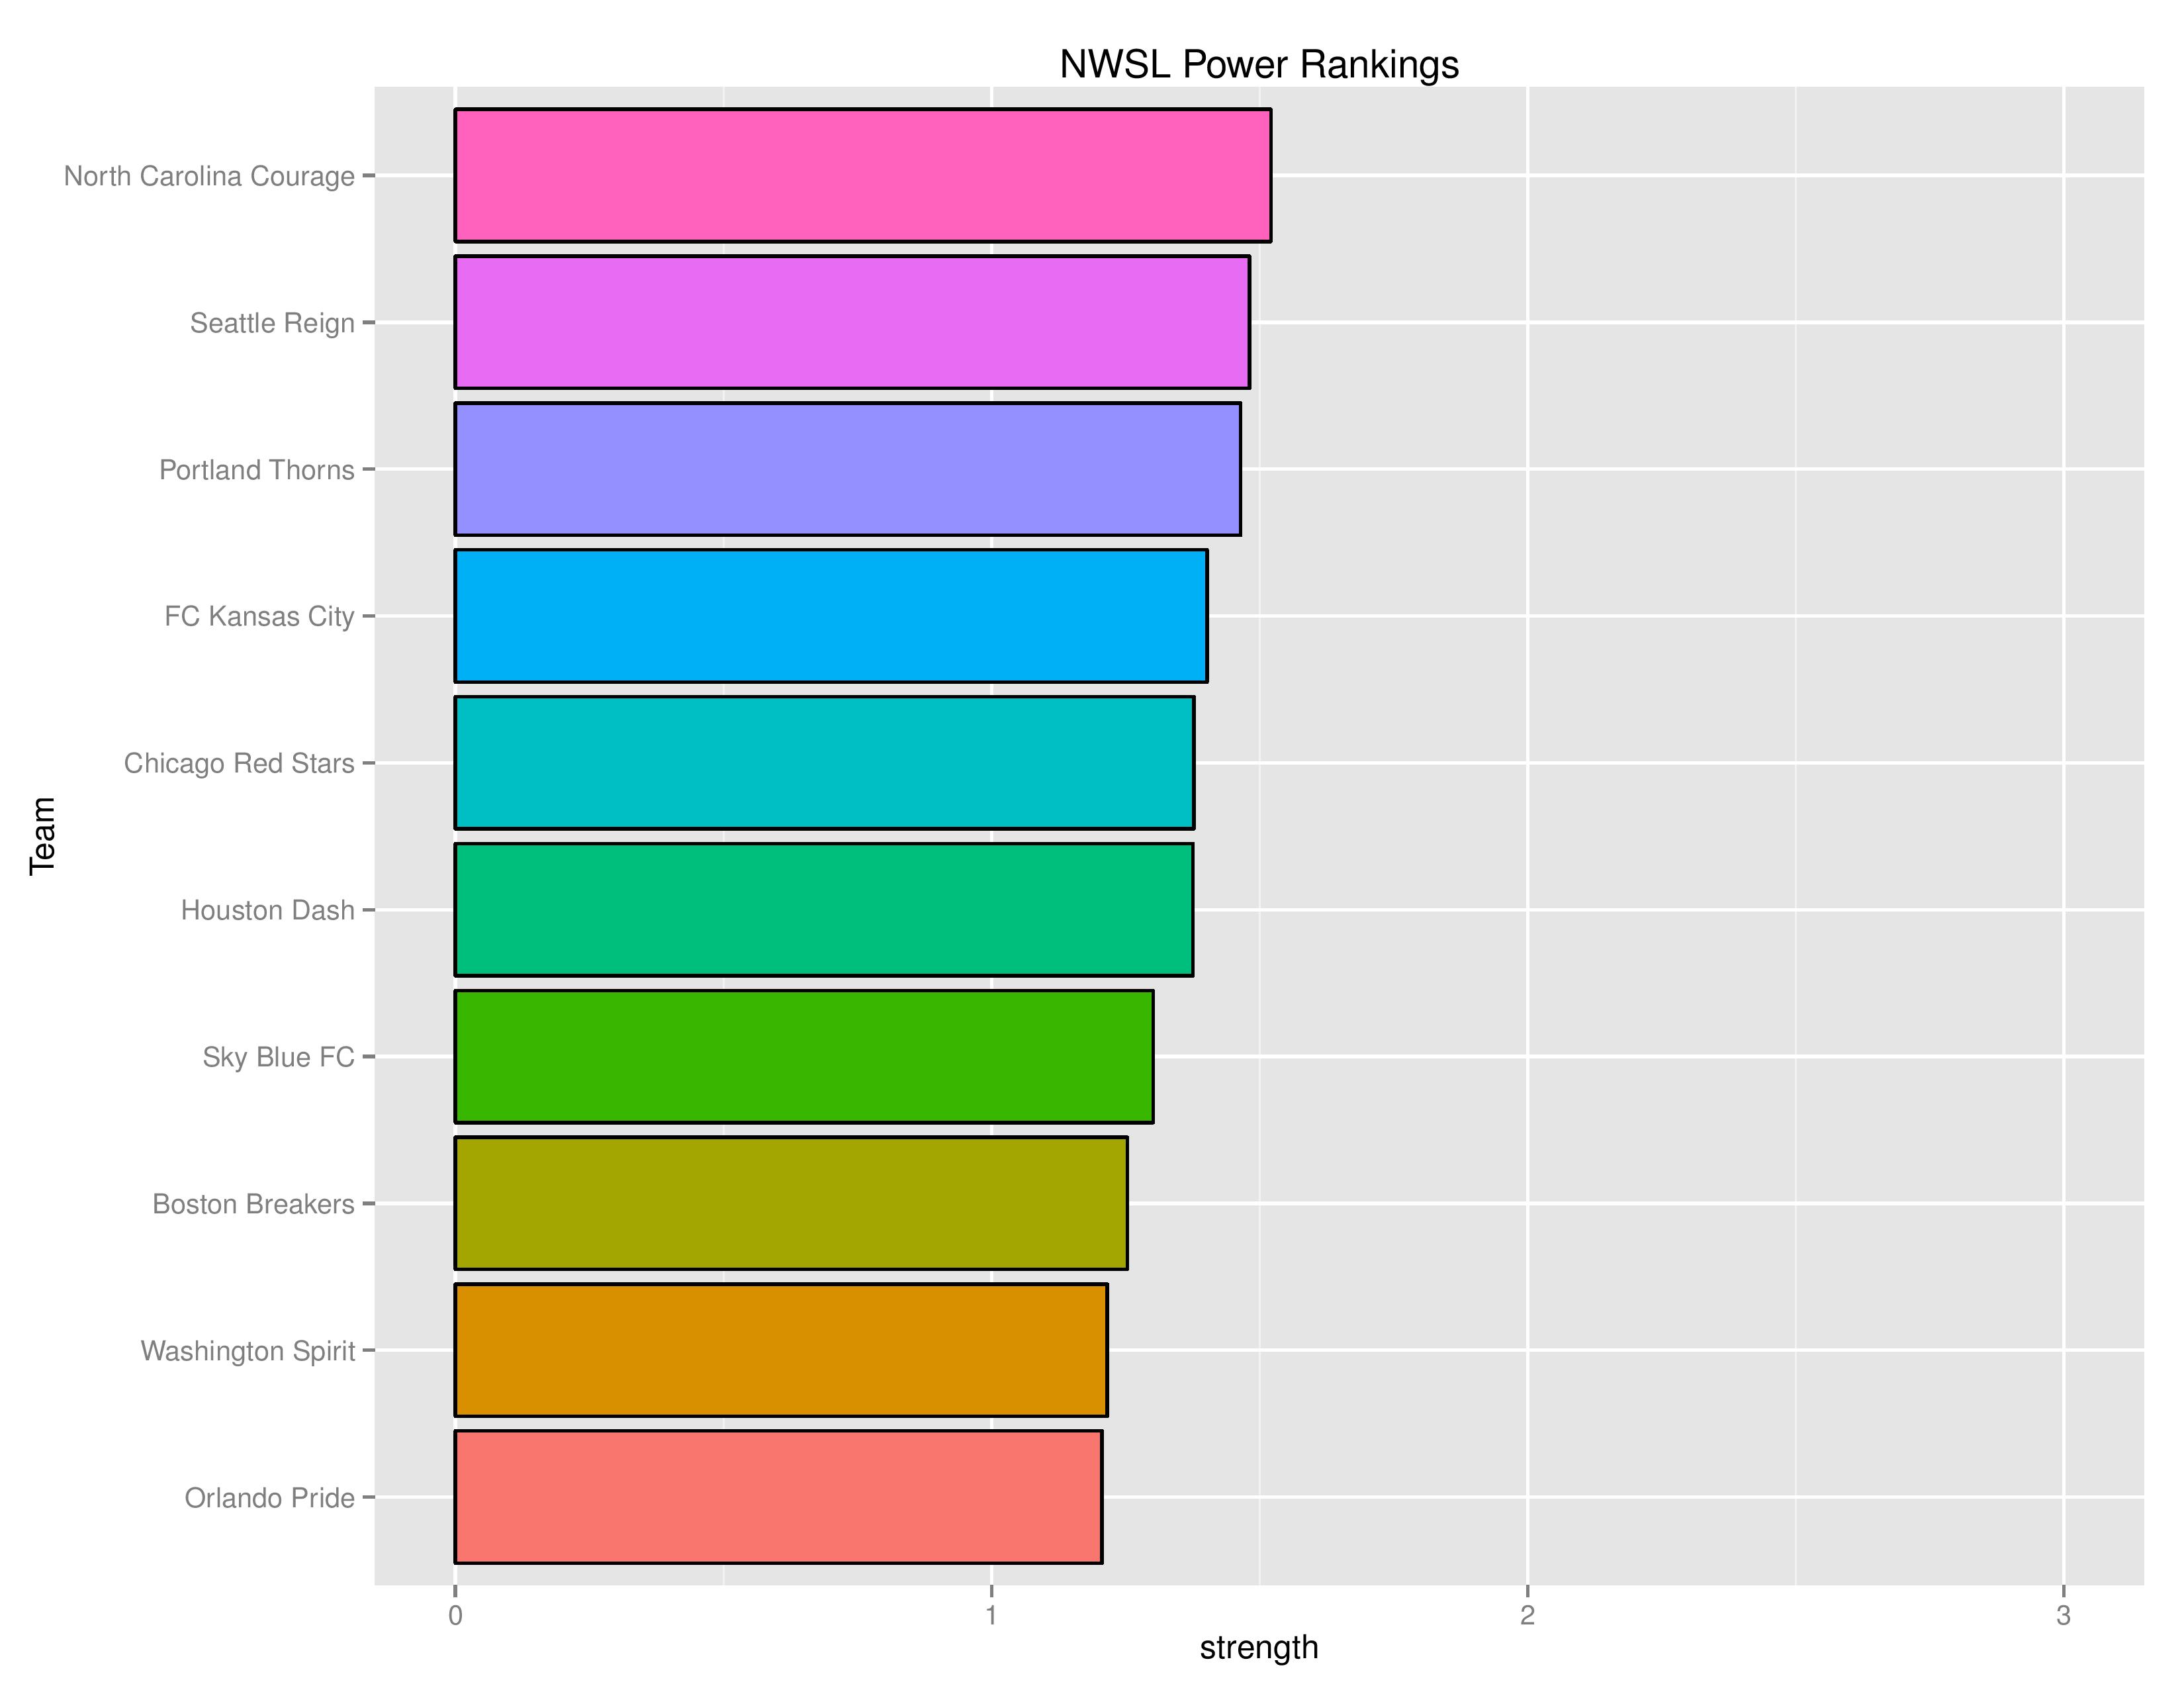
The “Power Rankings” we concoct are the “strength” of the team according to its competitive expectations. They are computed by forecasting the expected points (3 x win-probability + 1 x draw-probability) against every MLS team, both home and away, and taking the average per team.
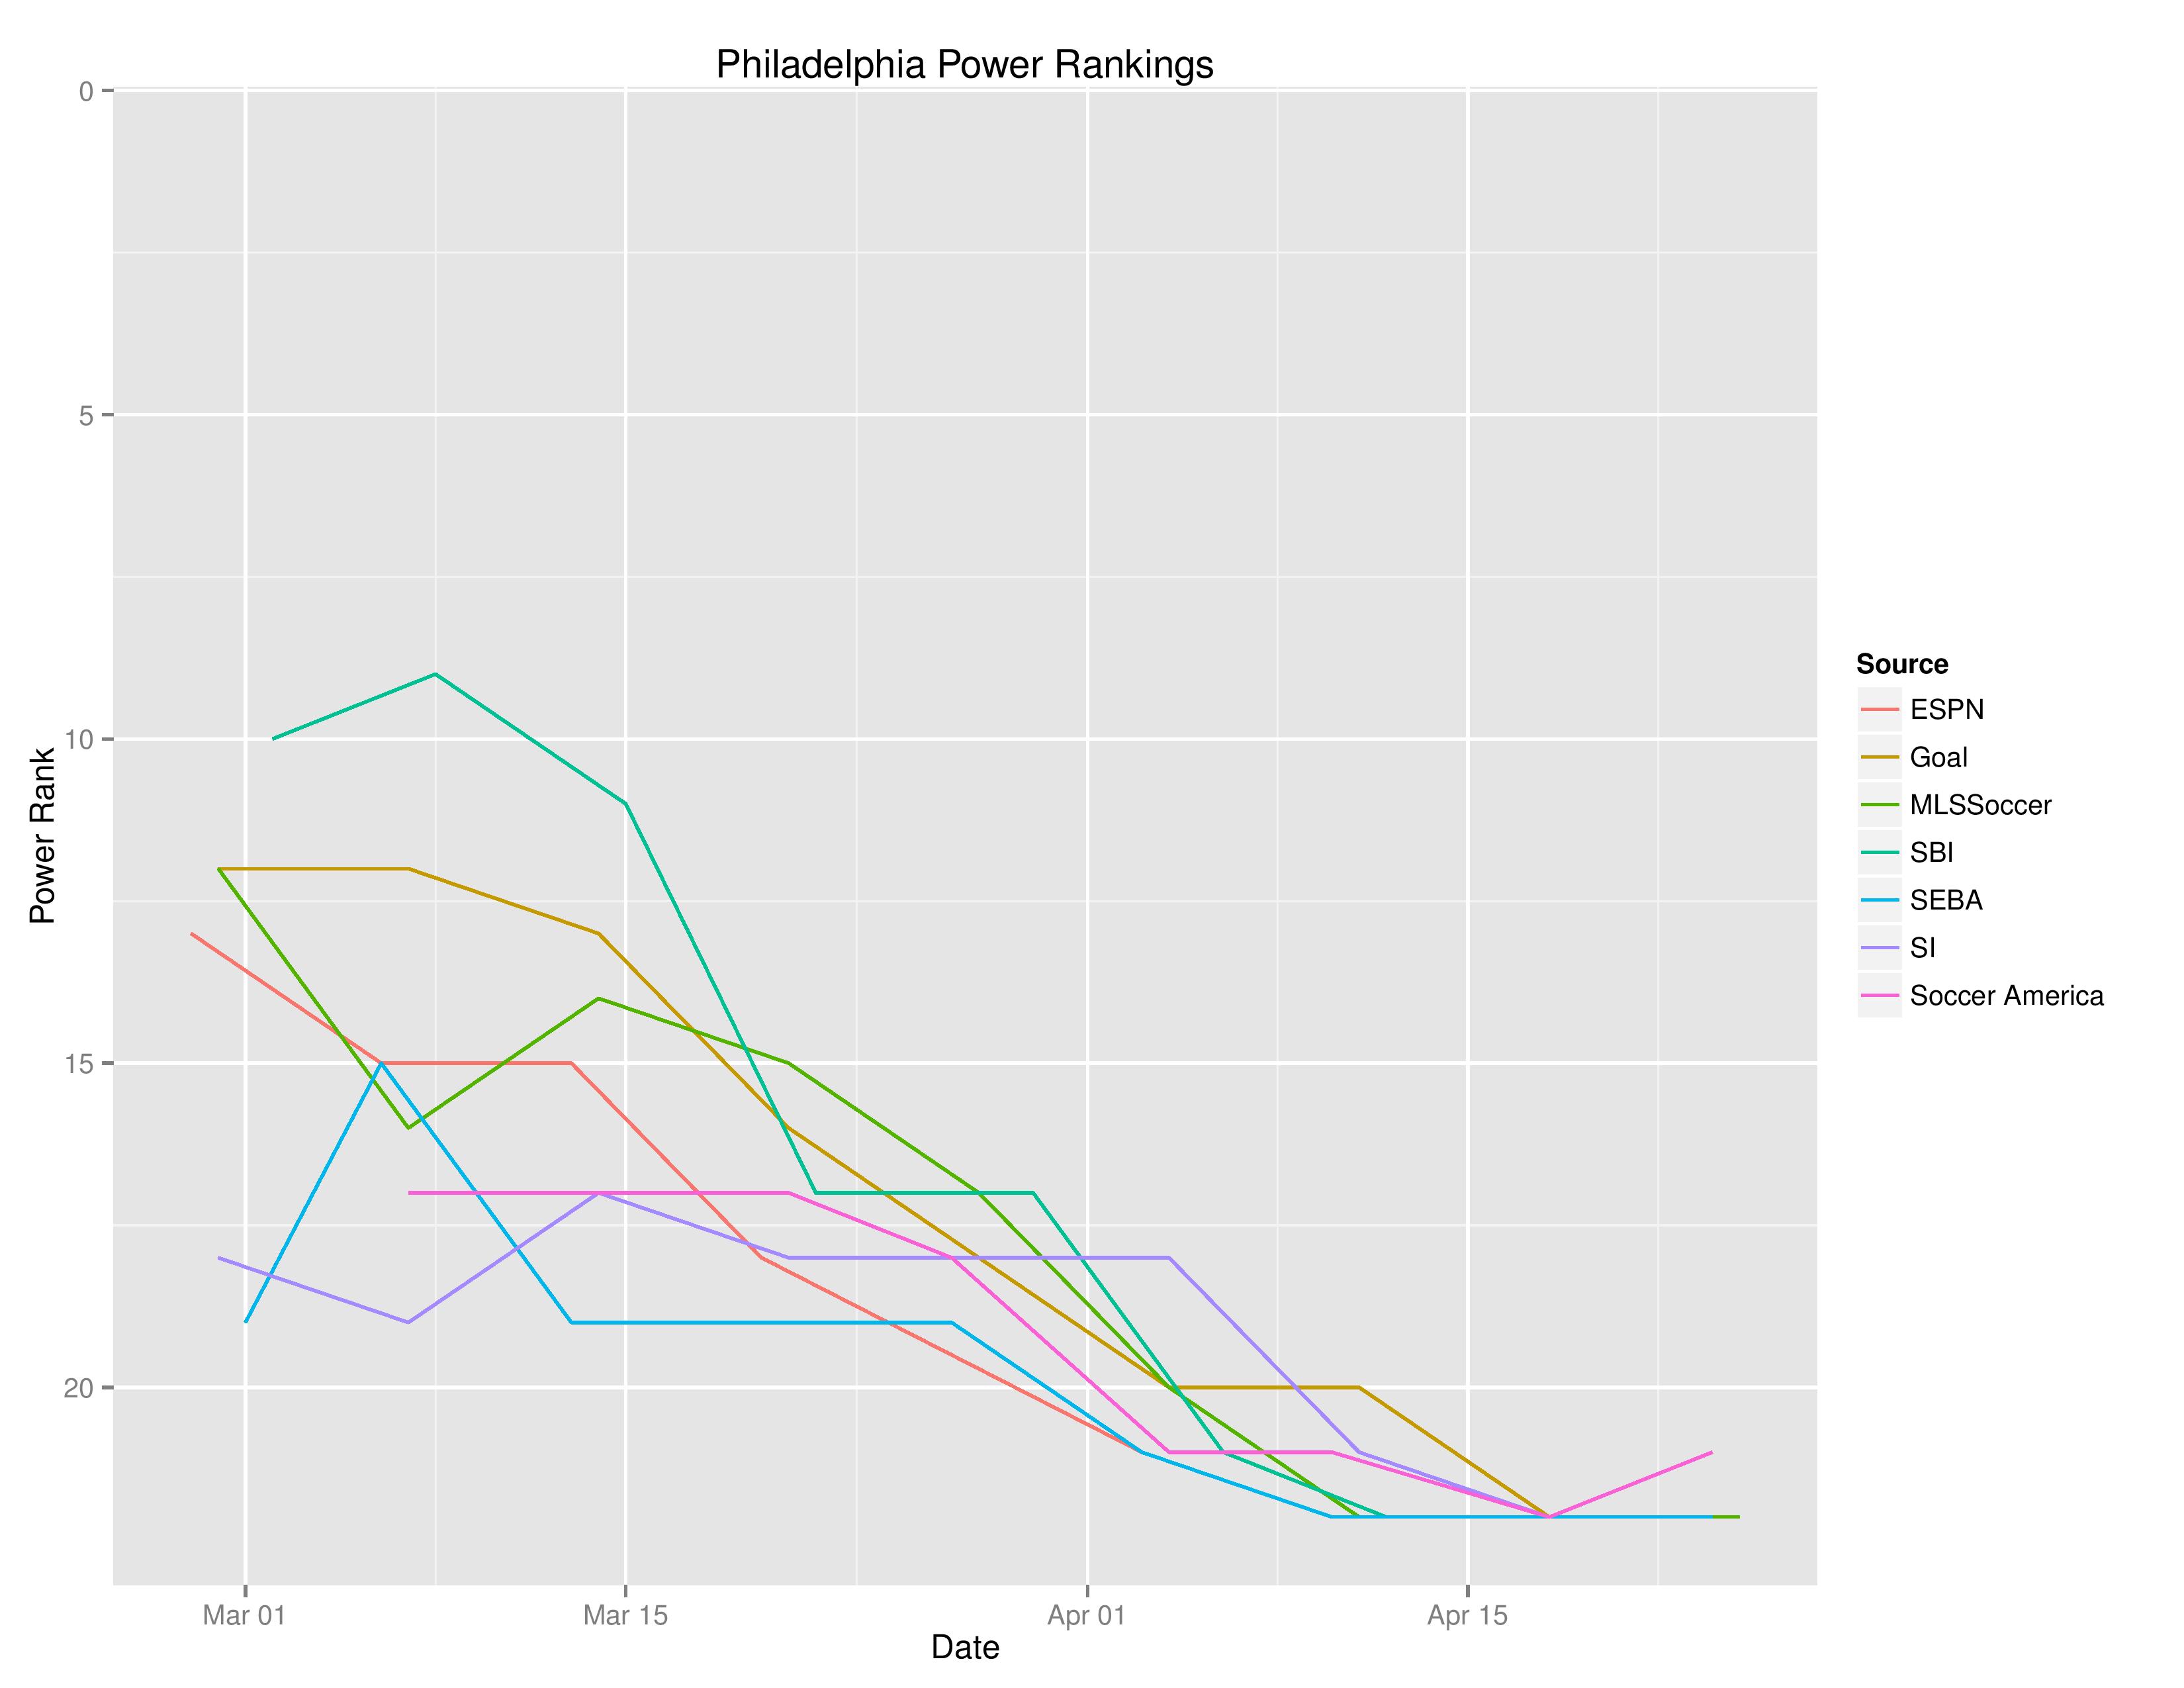
SEBA, ESPN, and MLSSoccer.com all have the Union remaining at 22nd while Soccer America has Philadelphia improving from 22nd to 21st.
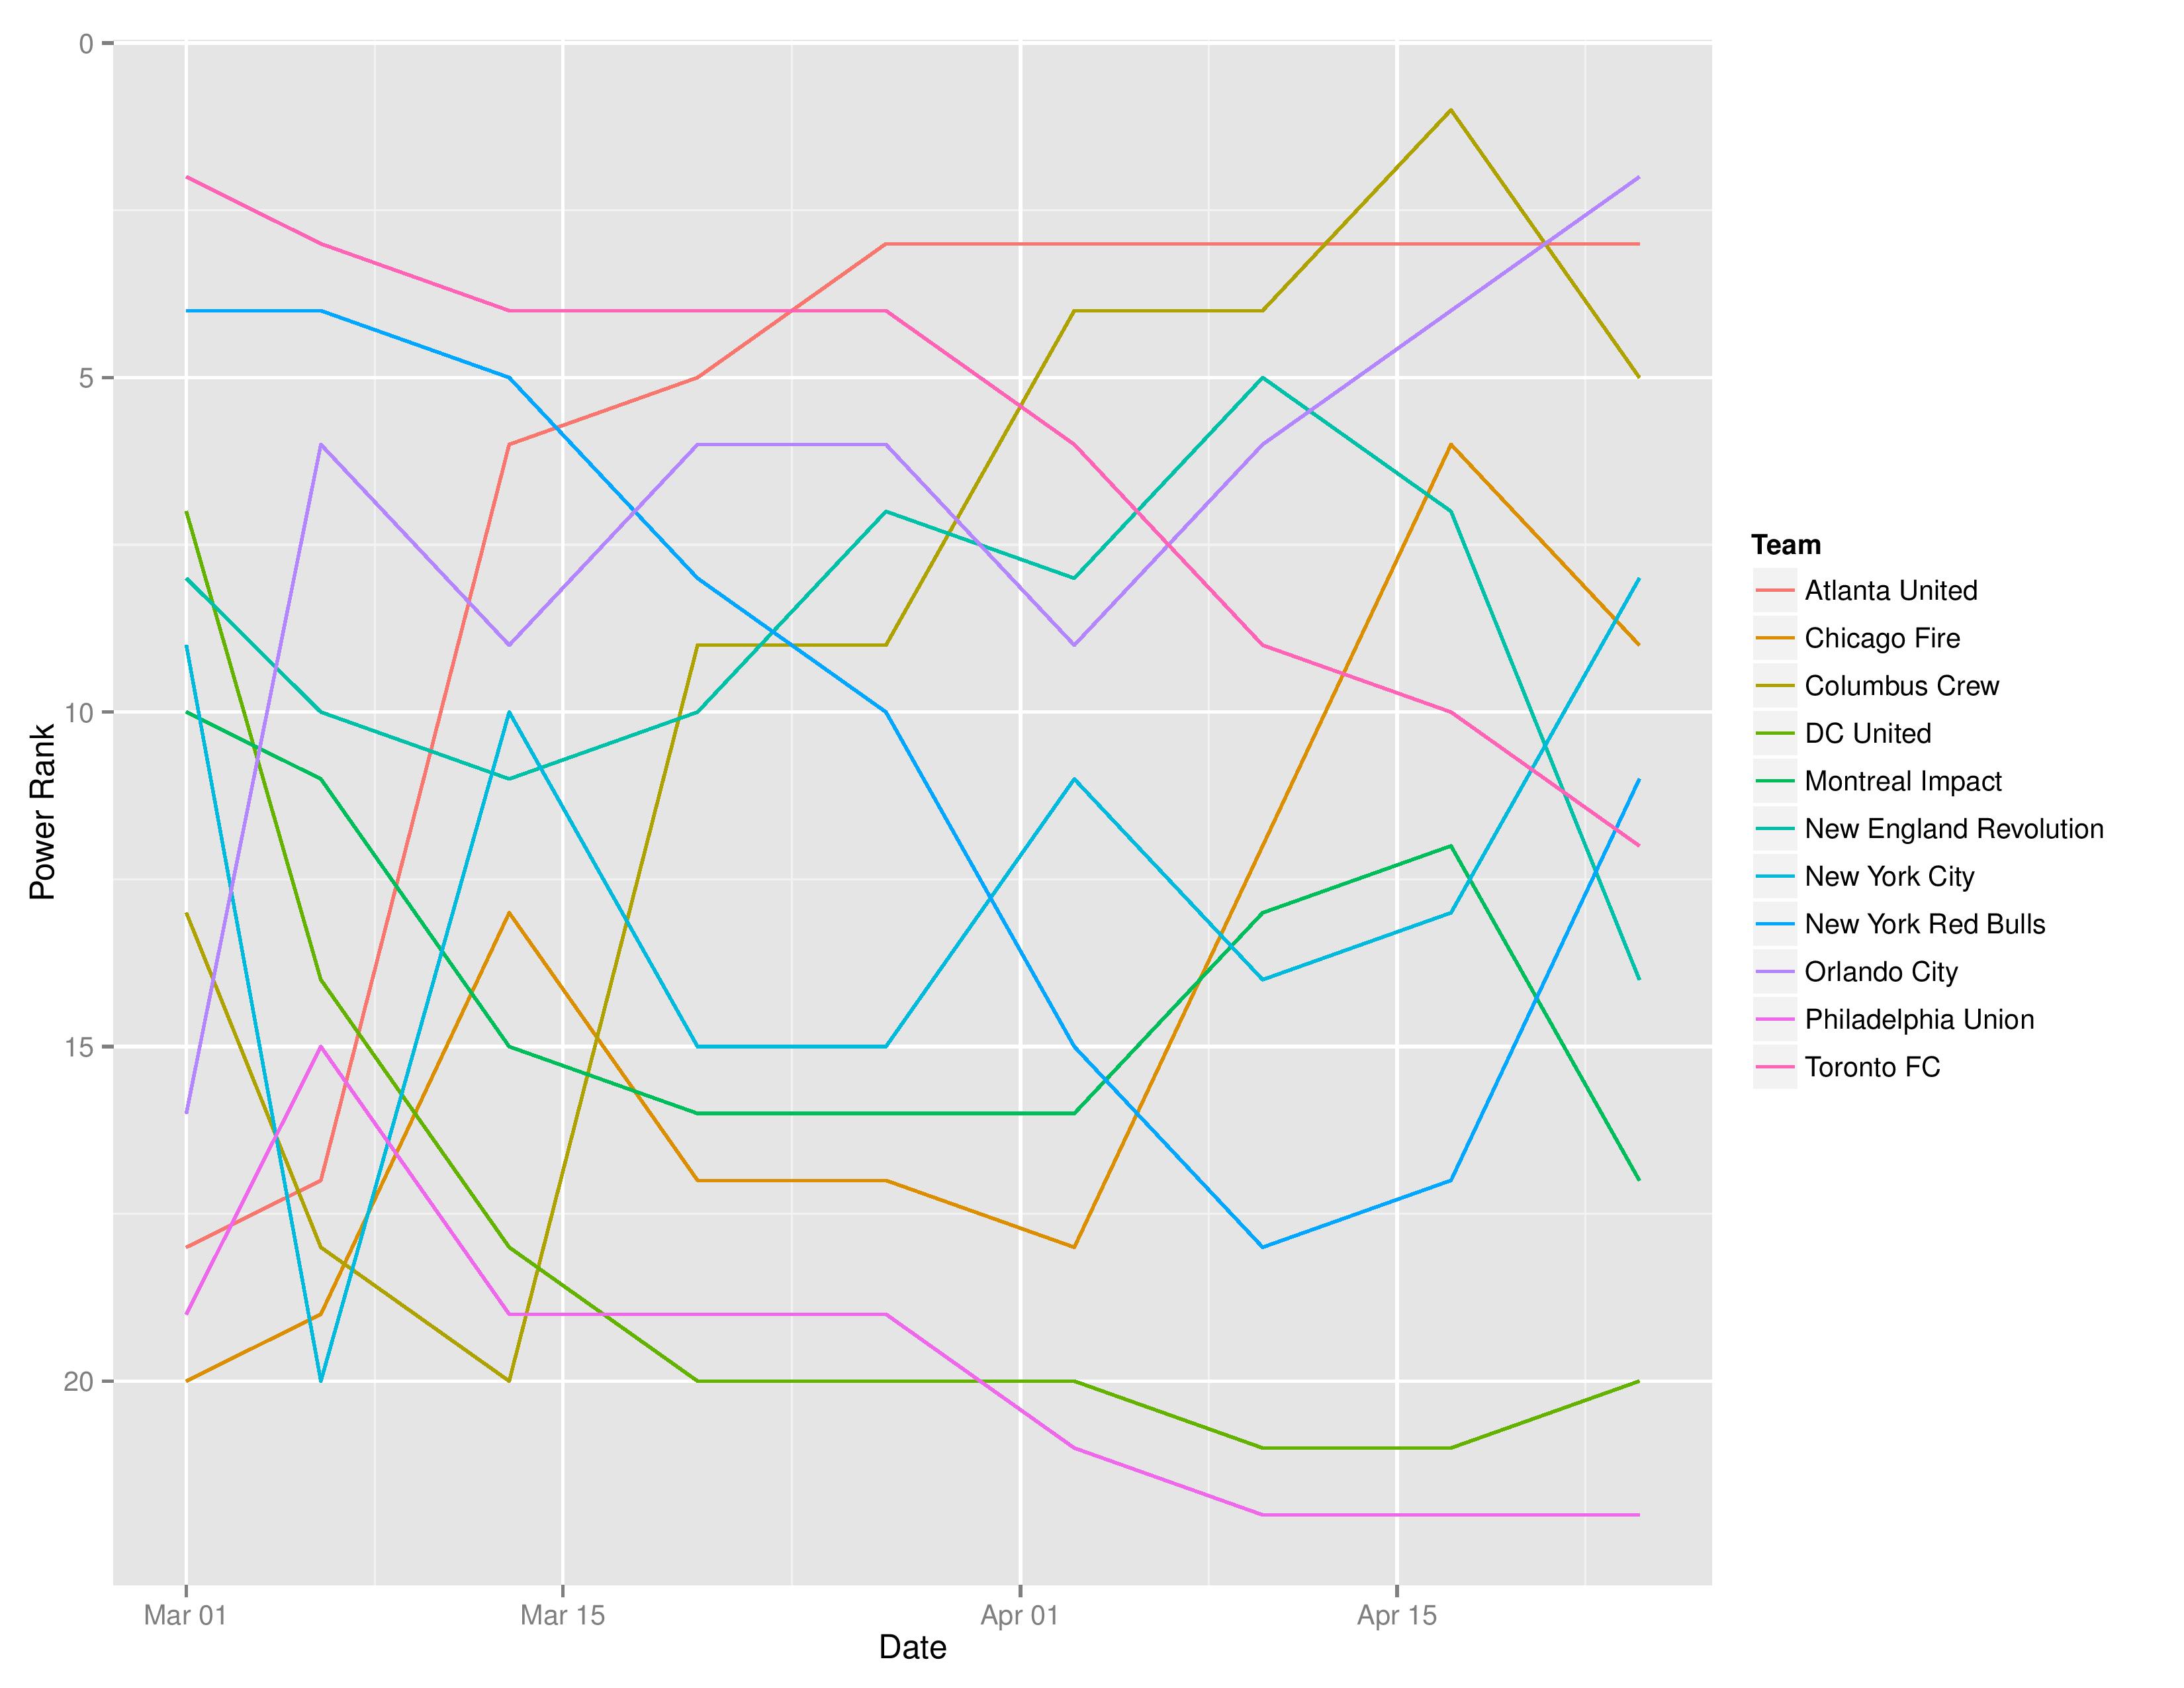
The following shows the evolution of SEBA’s power rankings for the MLS Eastern Conference over time.
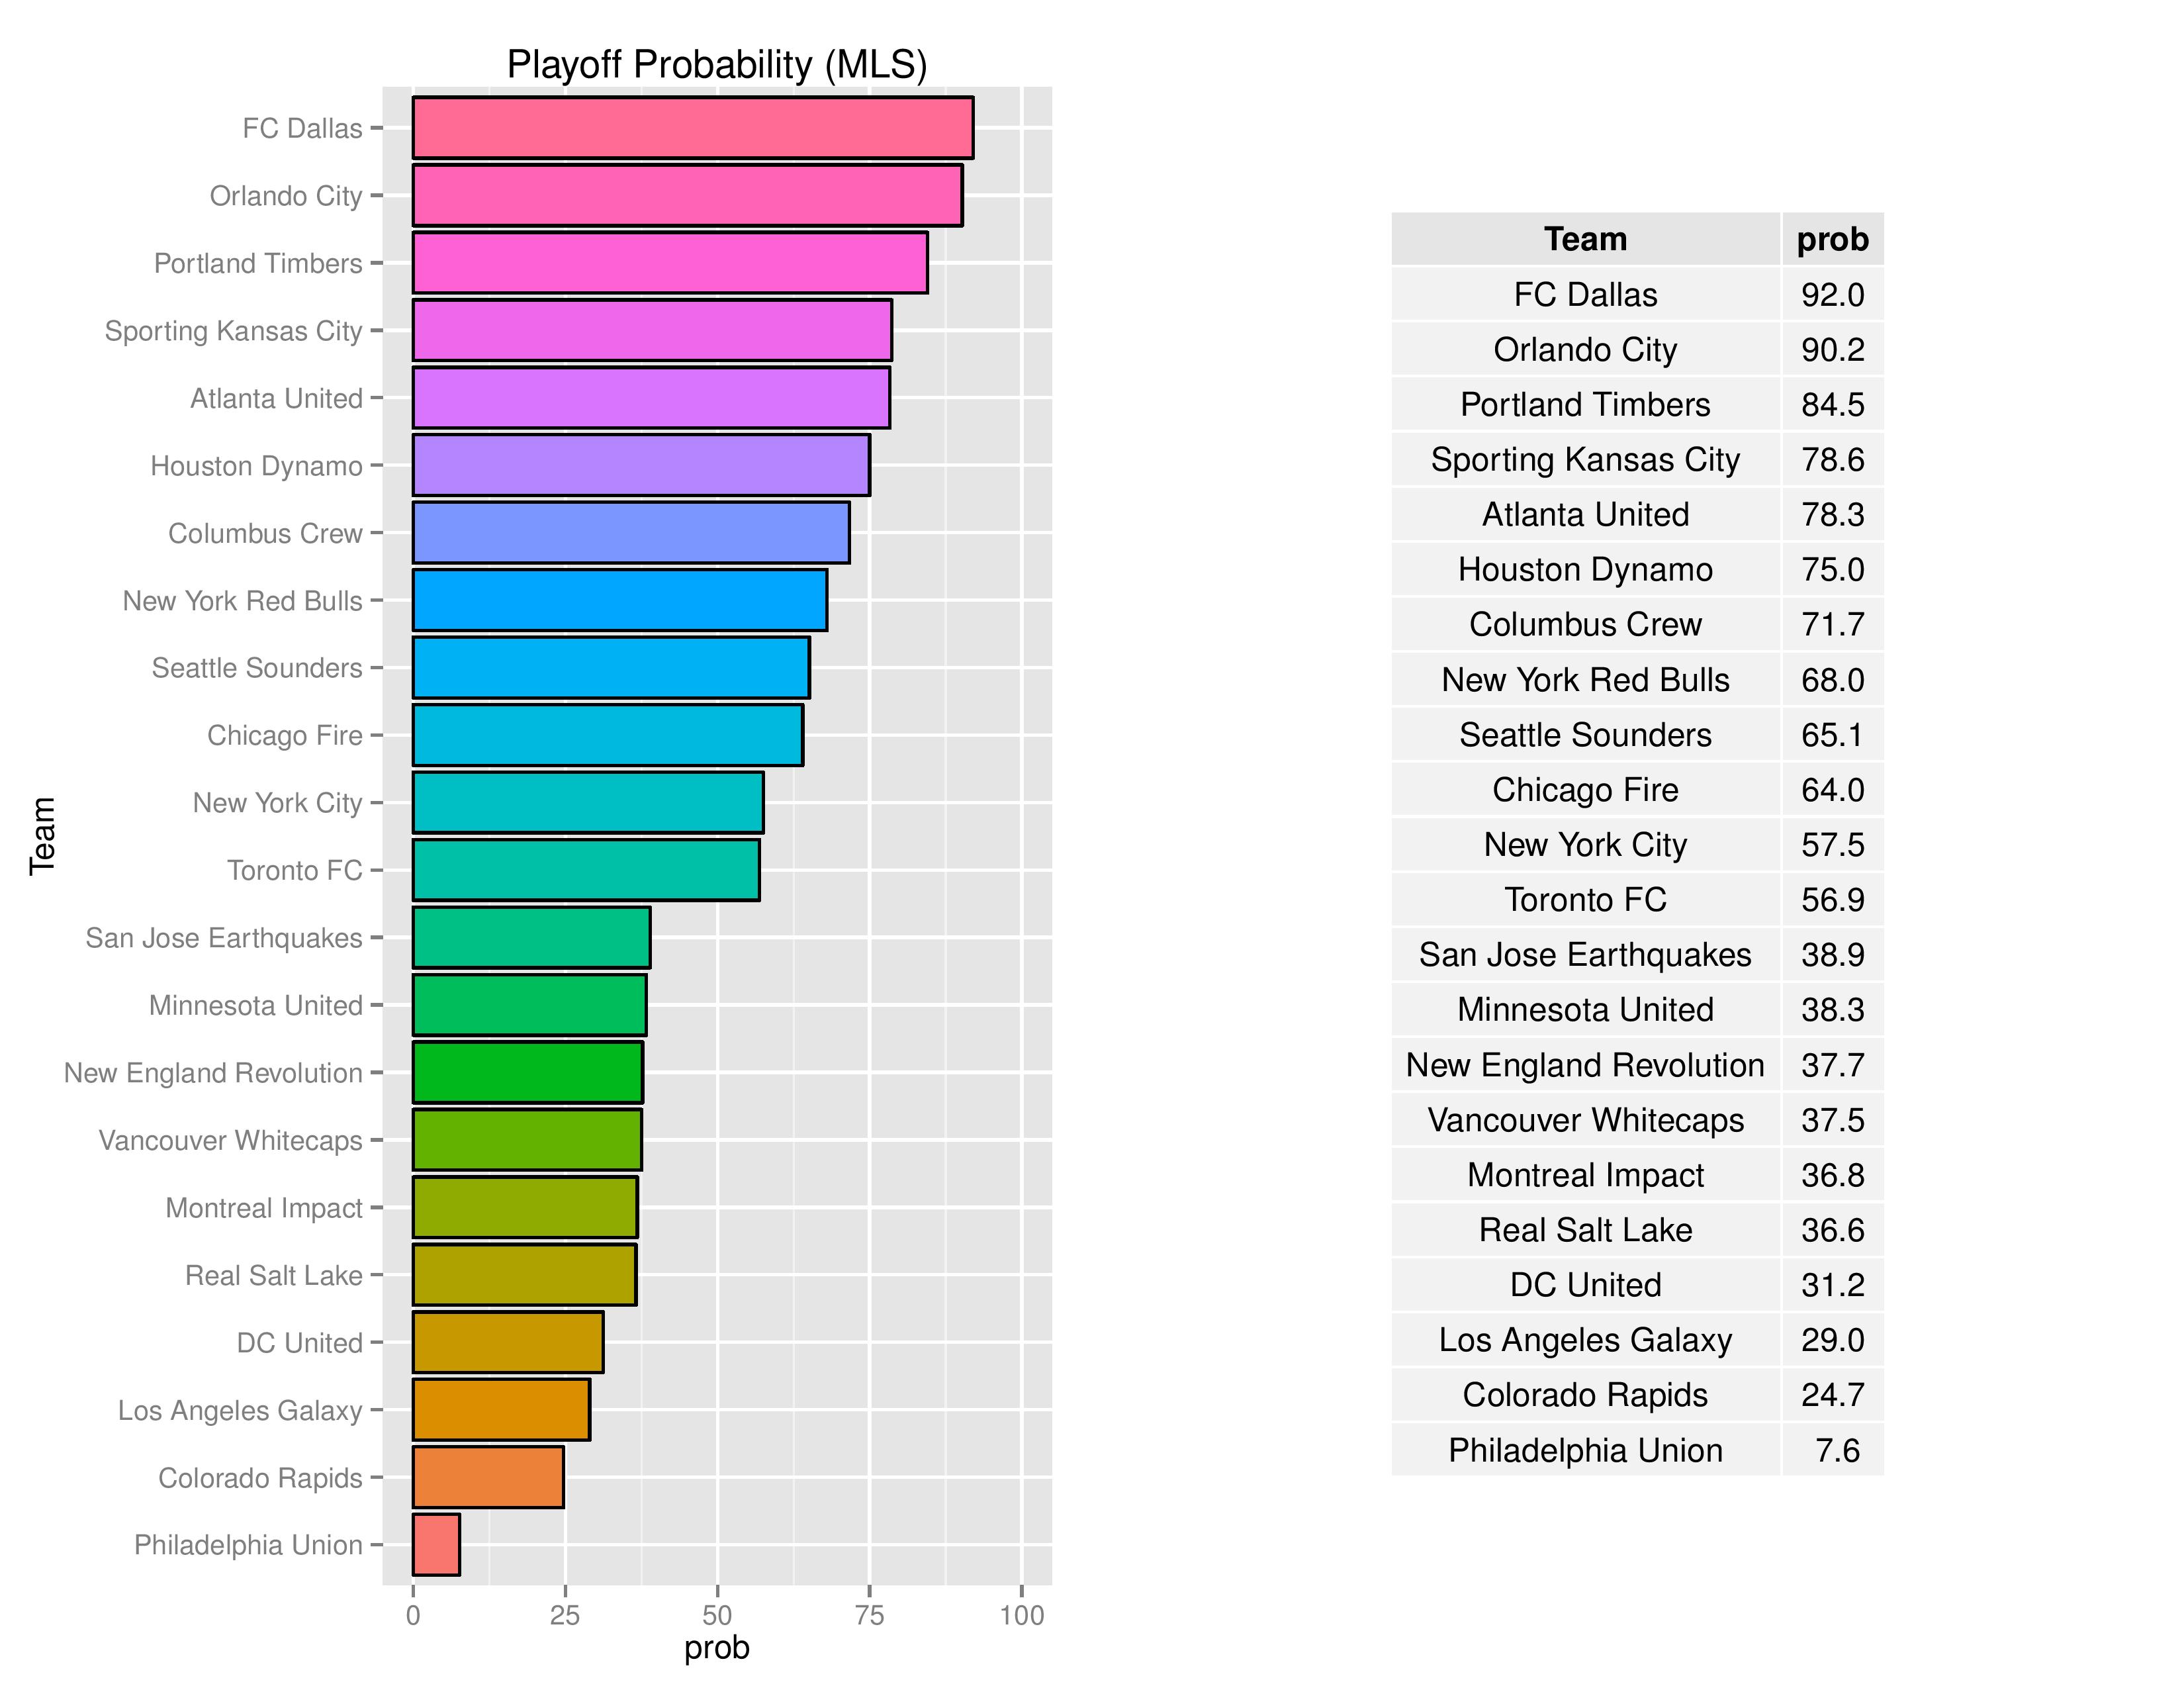
Playoffs probability and more
Philadelphia’s playoffs odds have increased from 1.4% to 7.6%.
This improvement has nothing to do with the Union’s performance than it does with recent league-wide results forcing the model to add uncertainty while tuning.
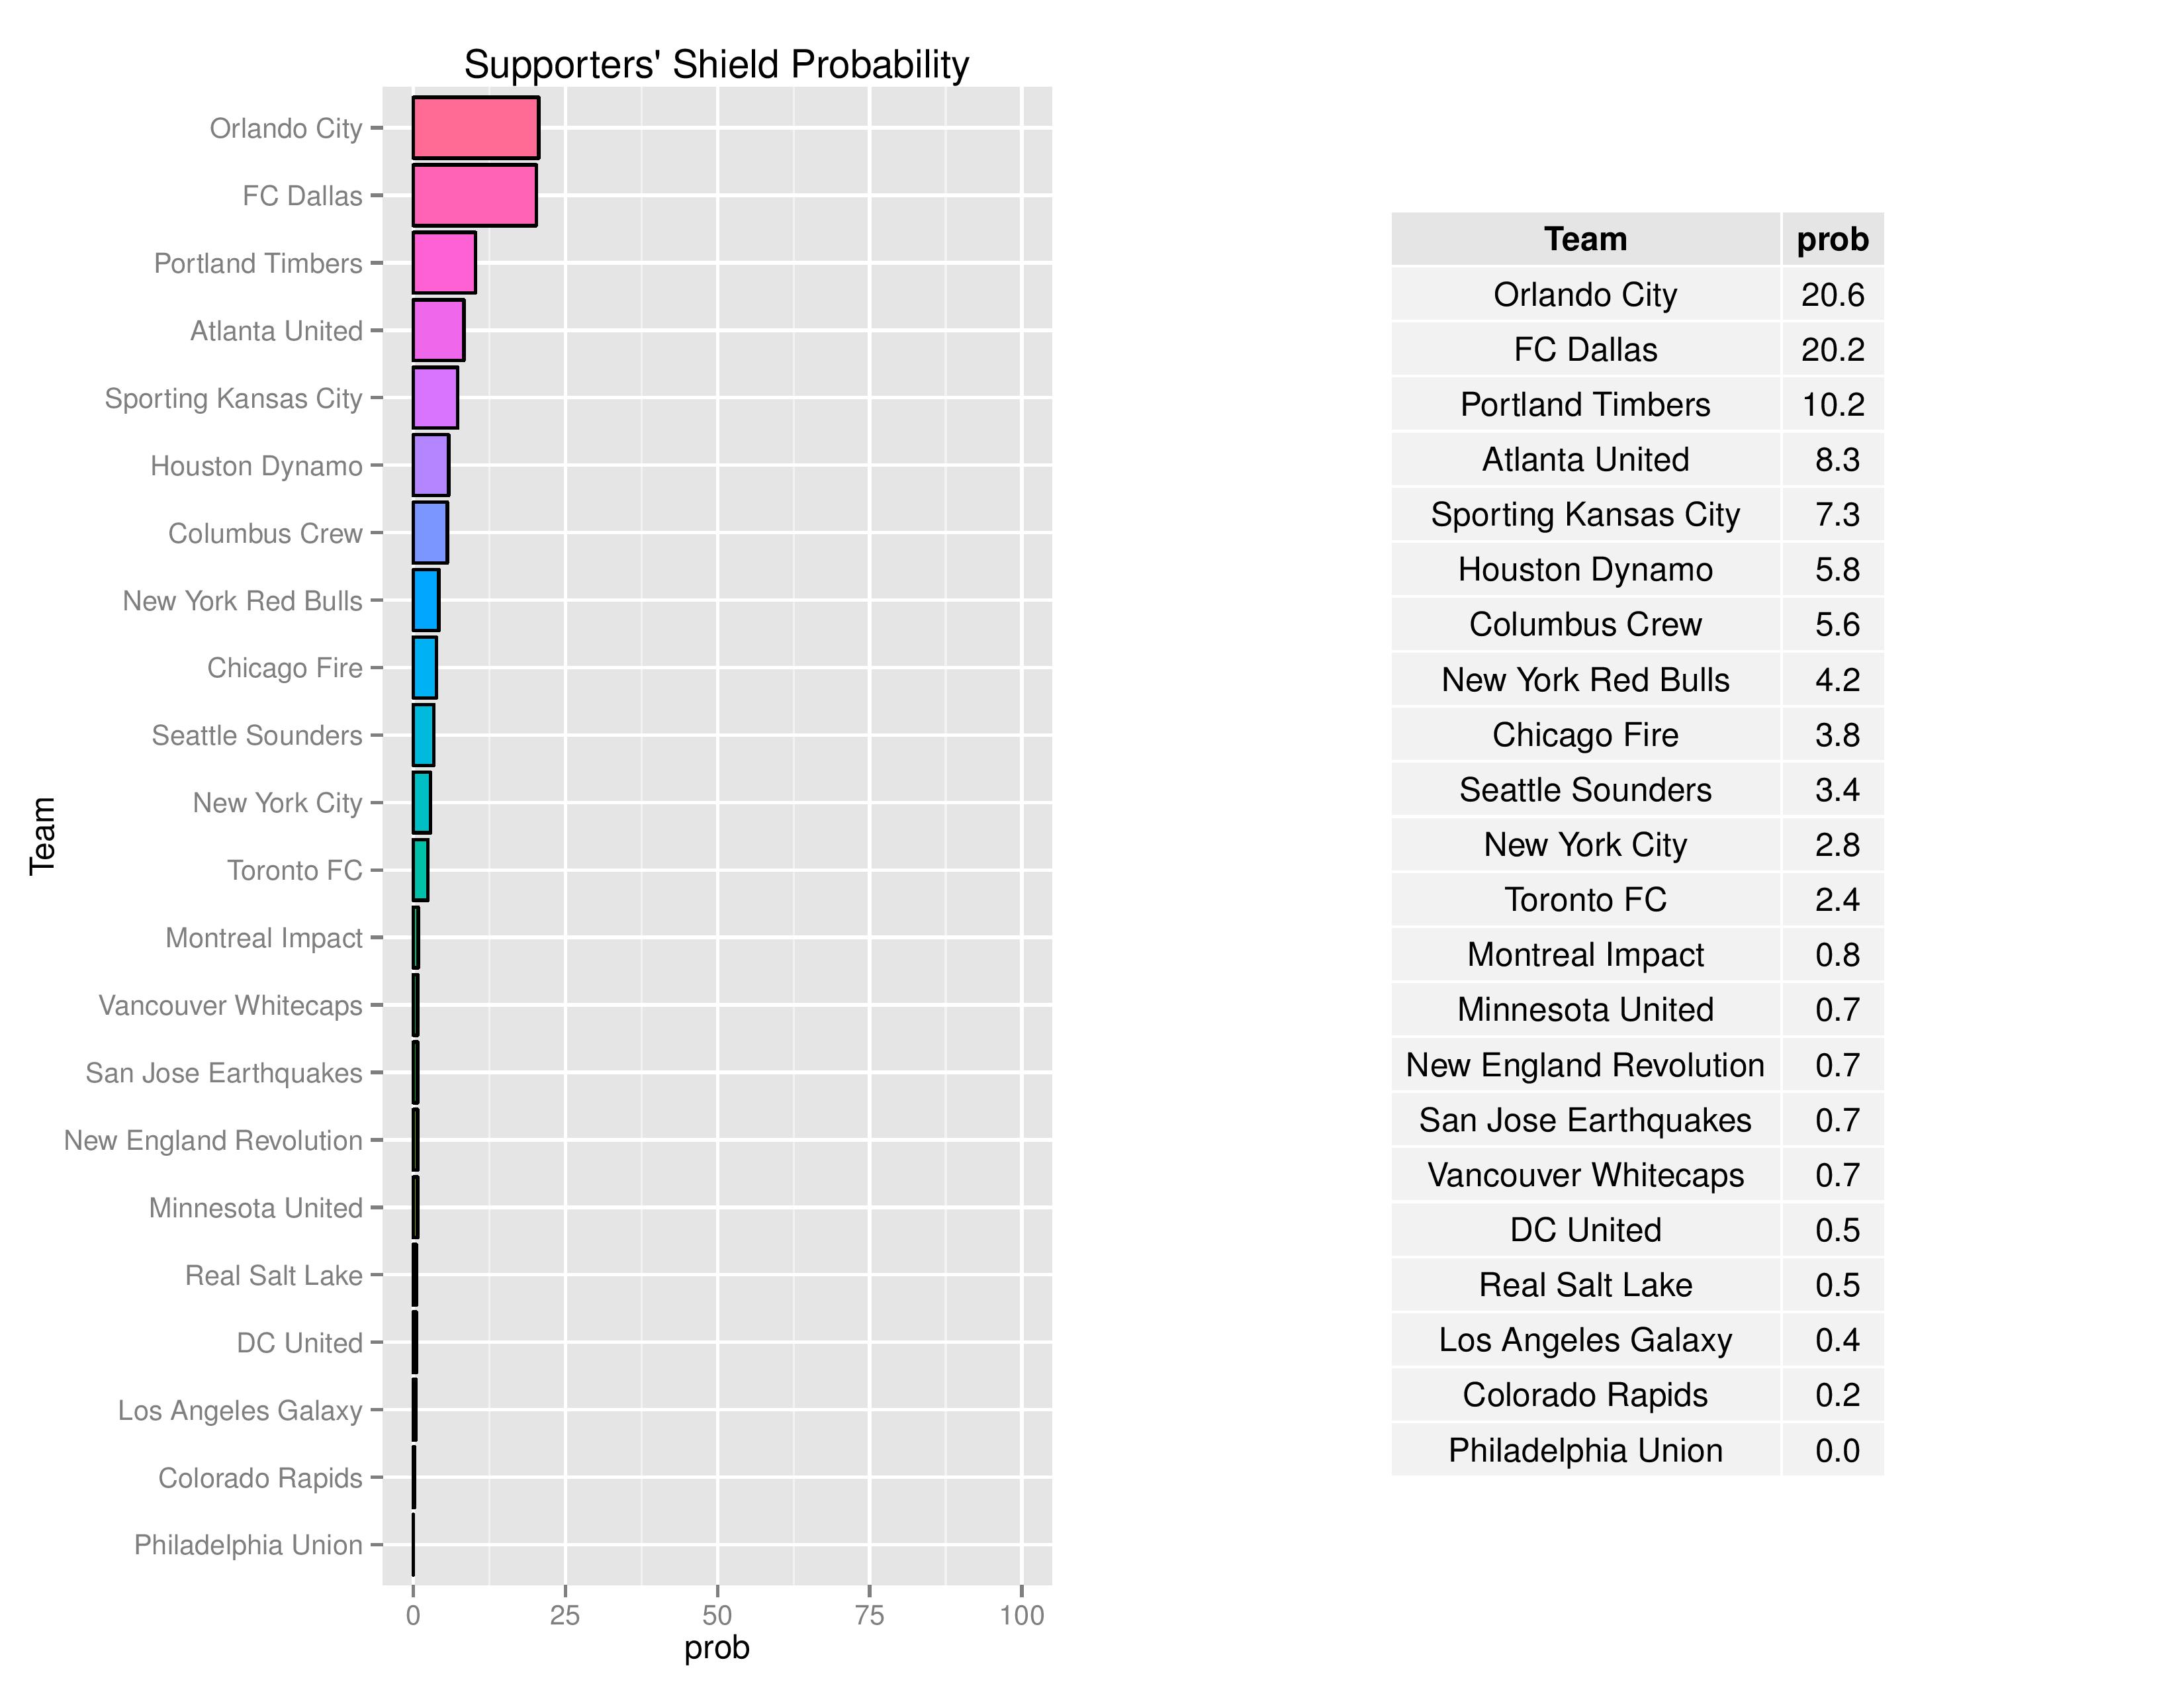
Philadelphia’s odds to win the Supporters’ Shield remain at practically 0%.
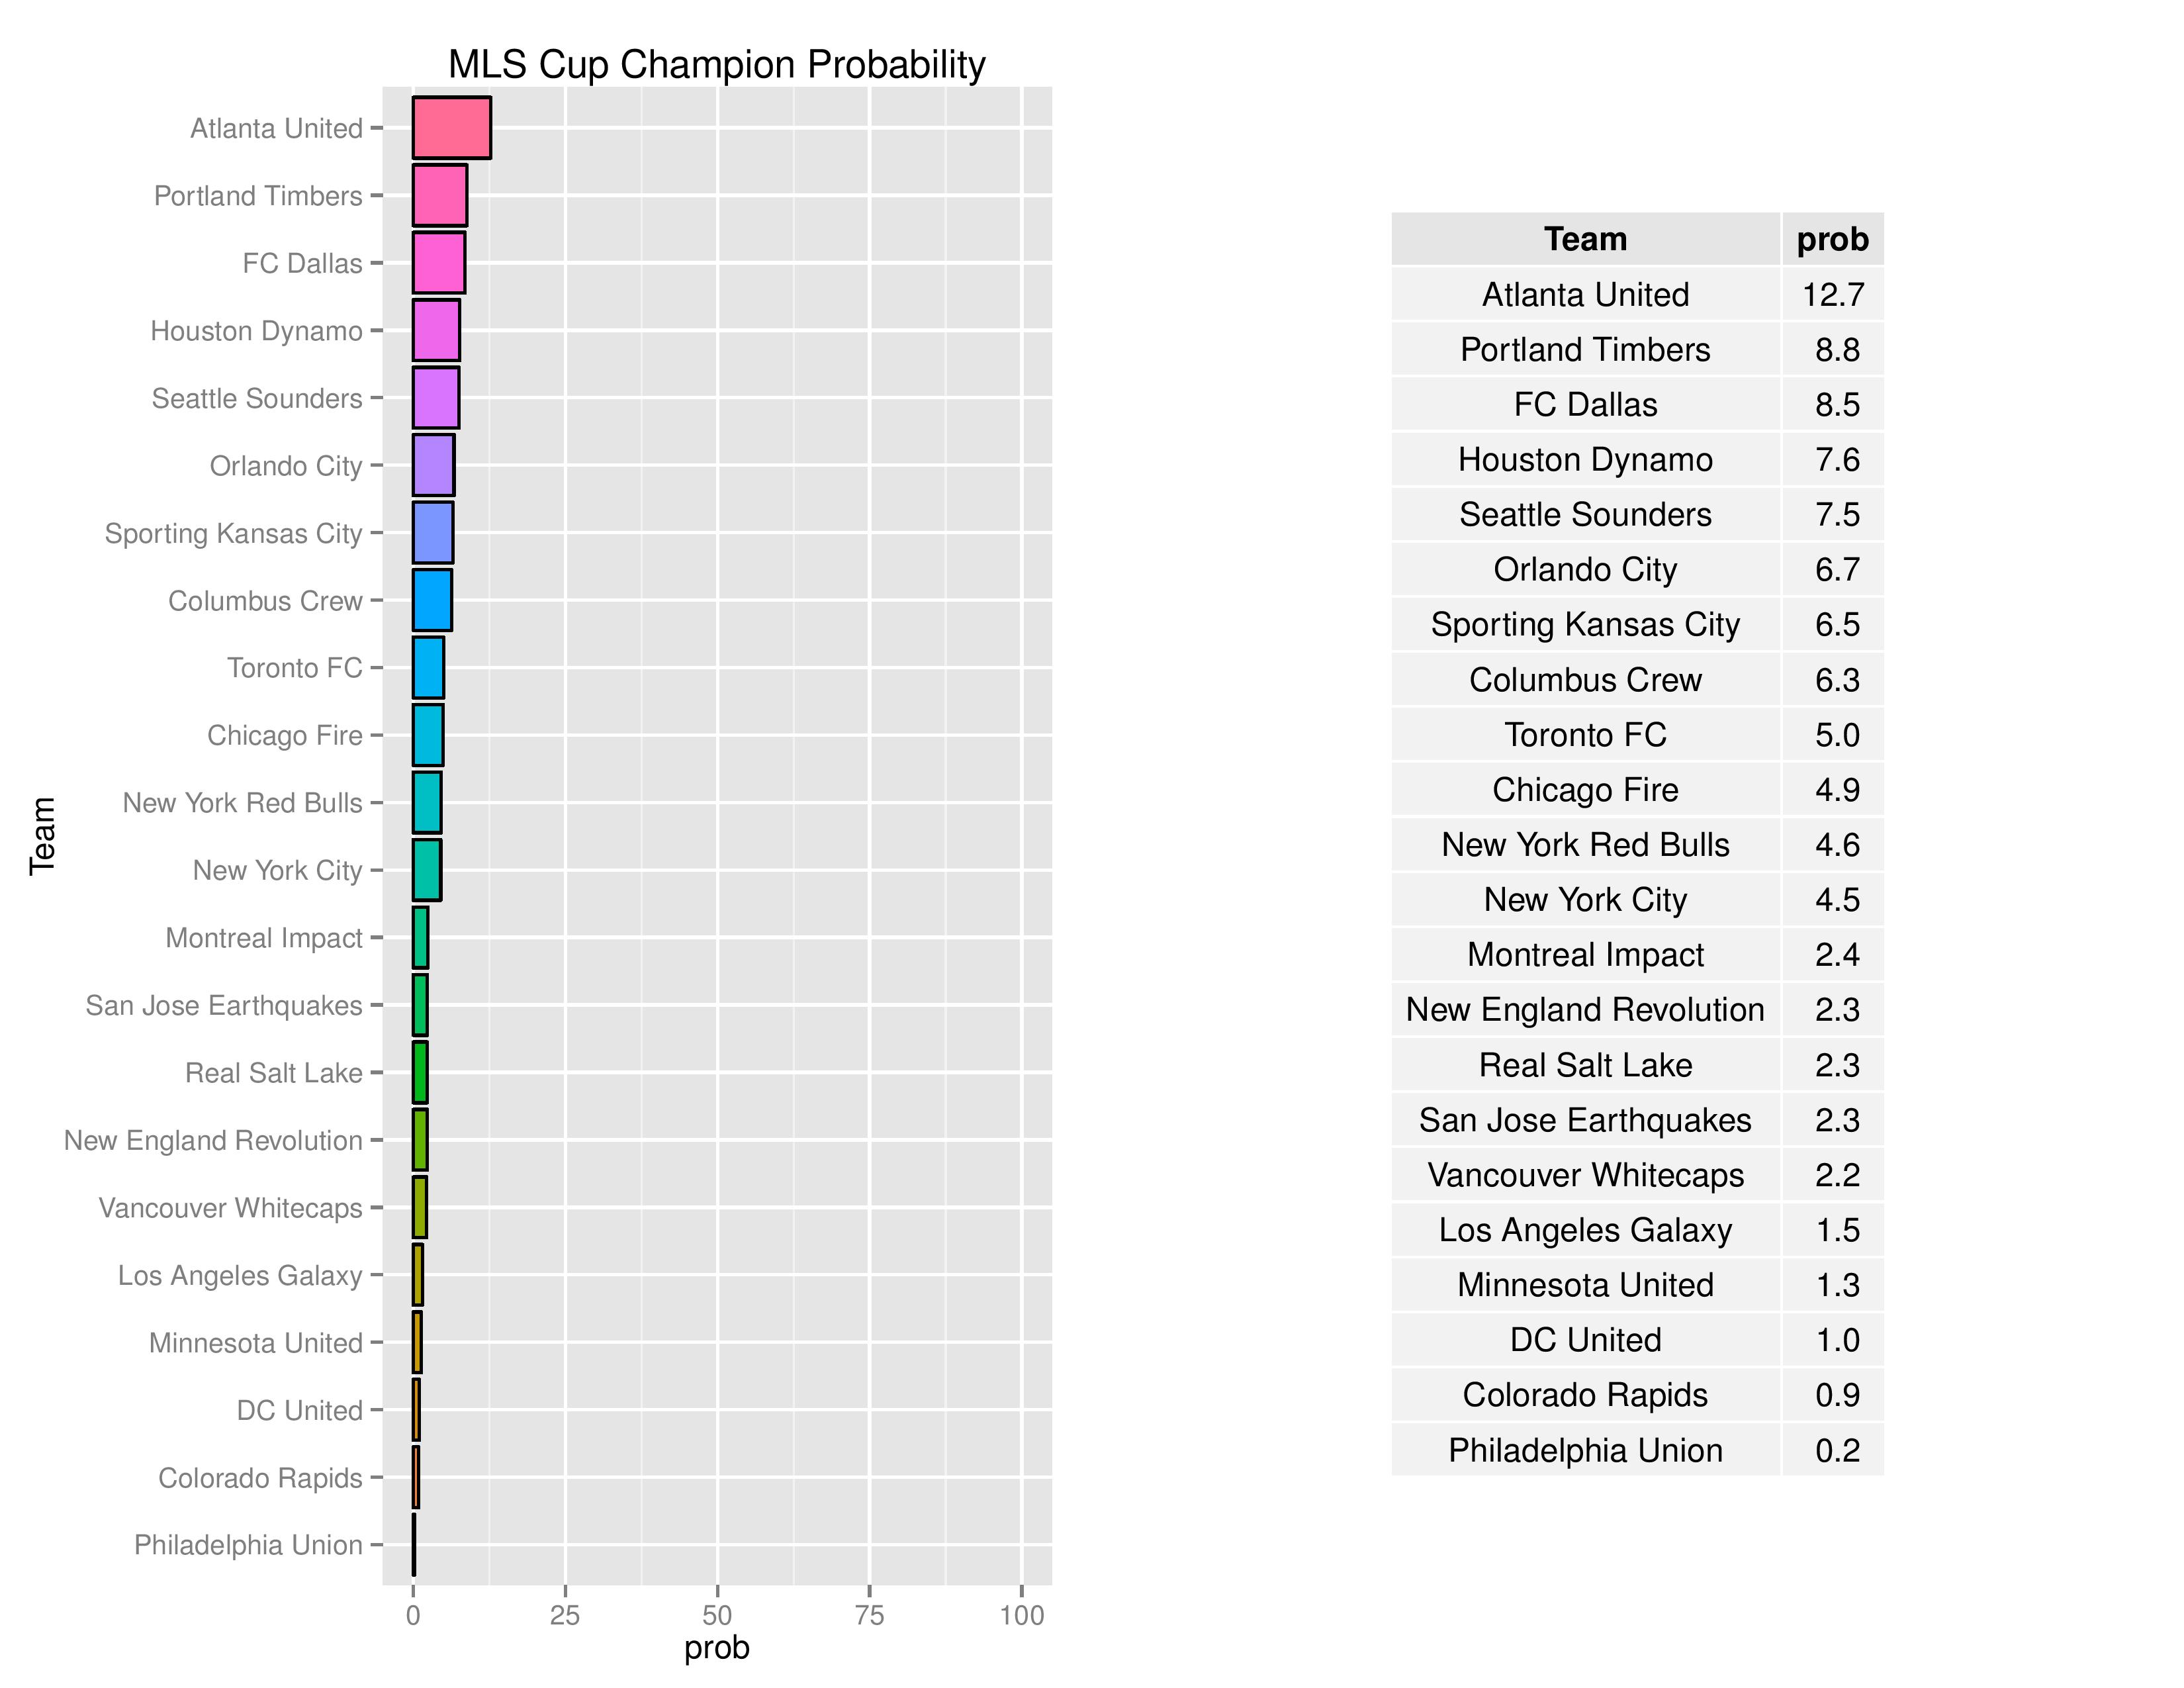
In part, clubs that score a lot of goals are given an advantage in MLS Cup due to the 2-leg aggregate goal format of the conference semi-finals and conference finals. This gives those clubs a better chance at banking large victories which carry over.
The Union’s chances of winning the MLS Cup have increased from practically 0% to 0.2%.
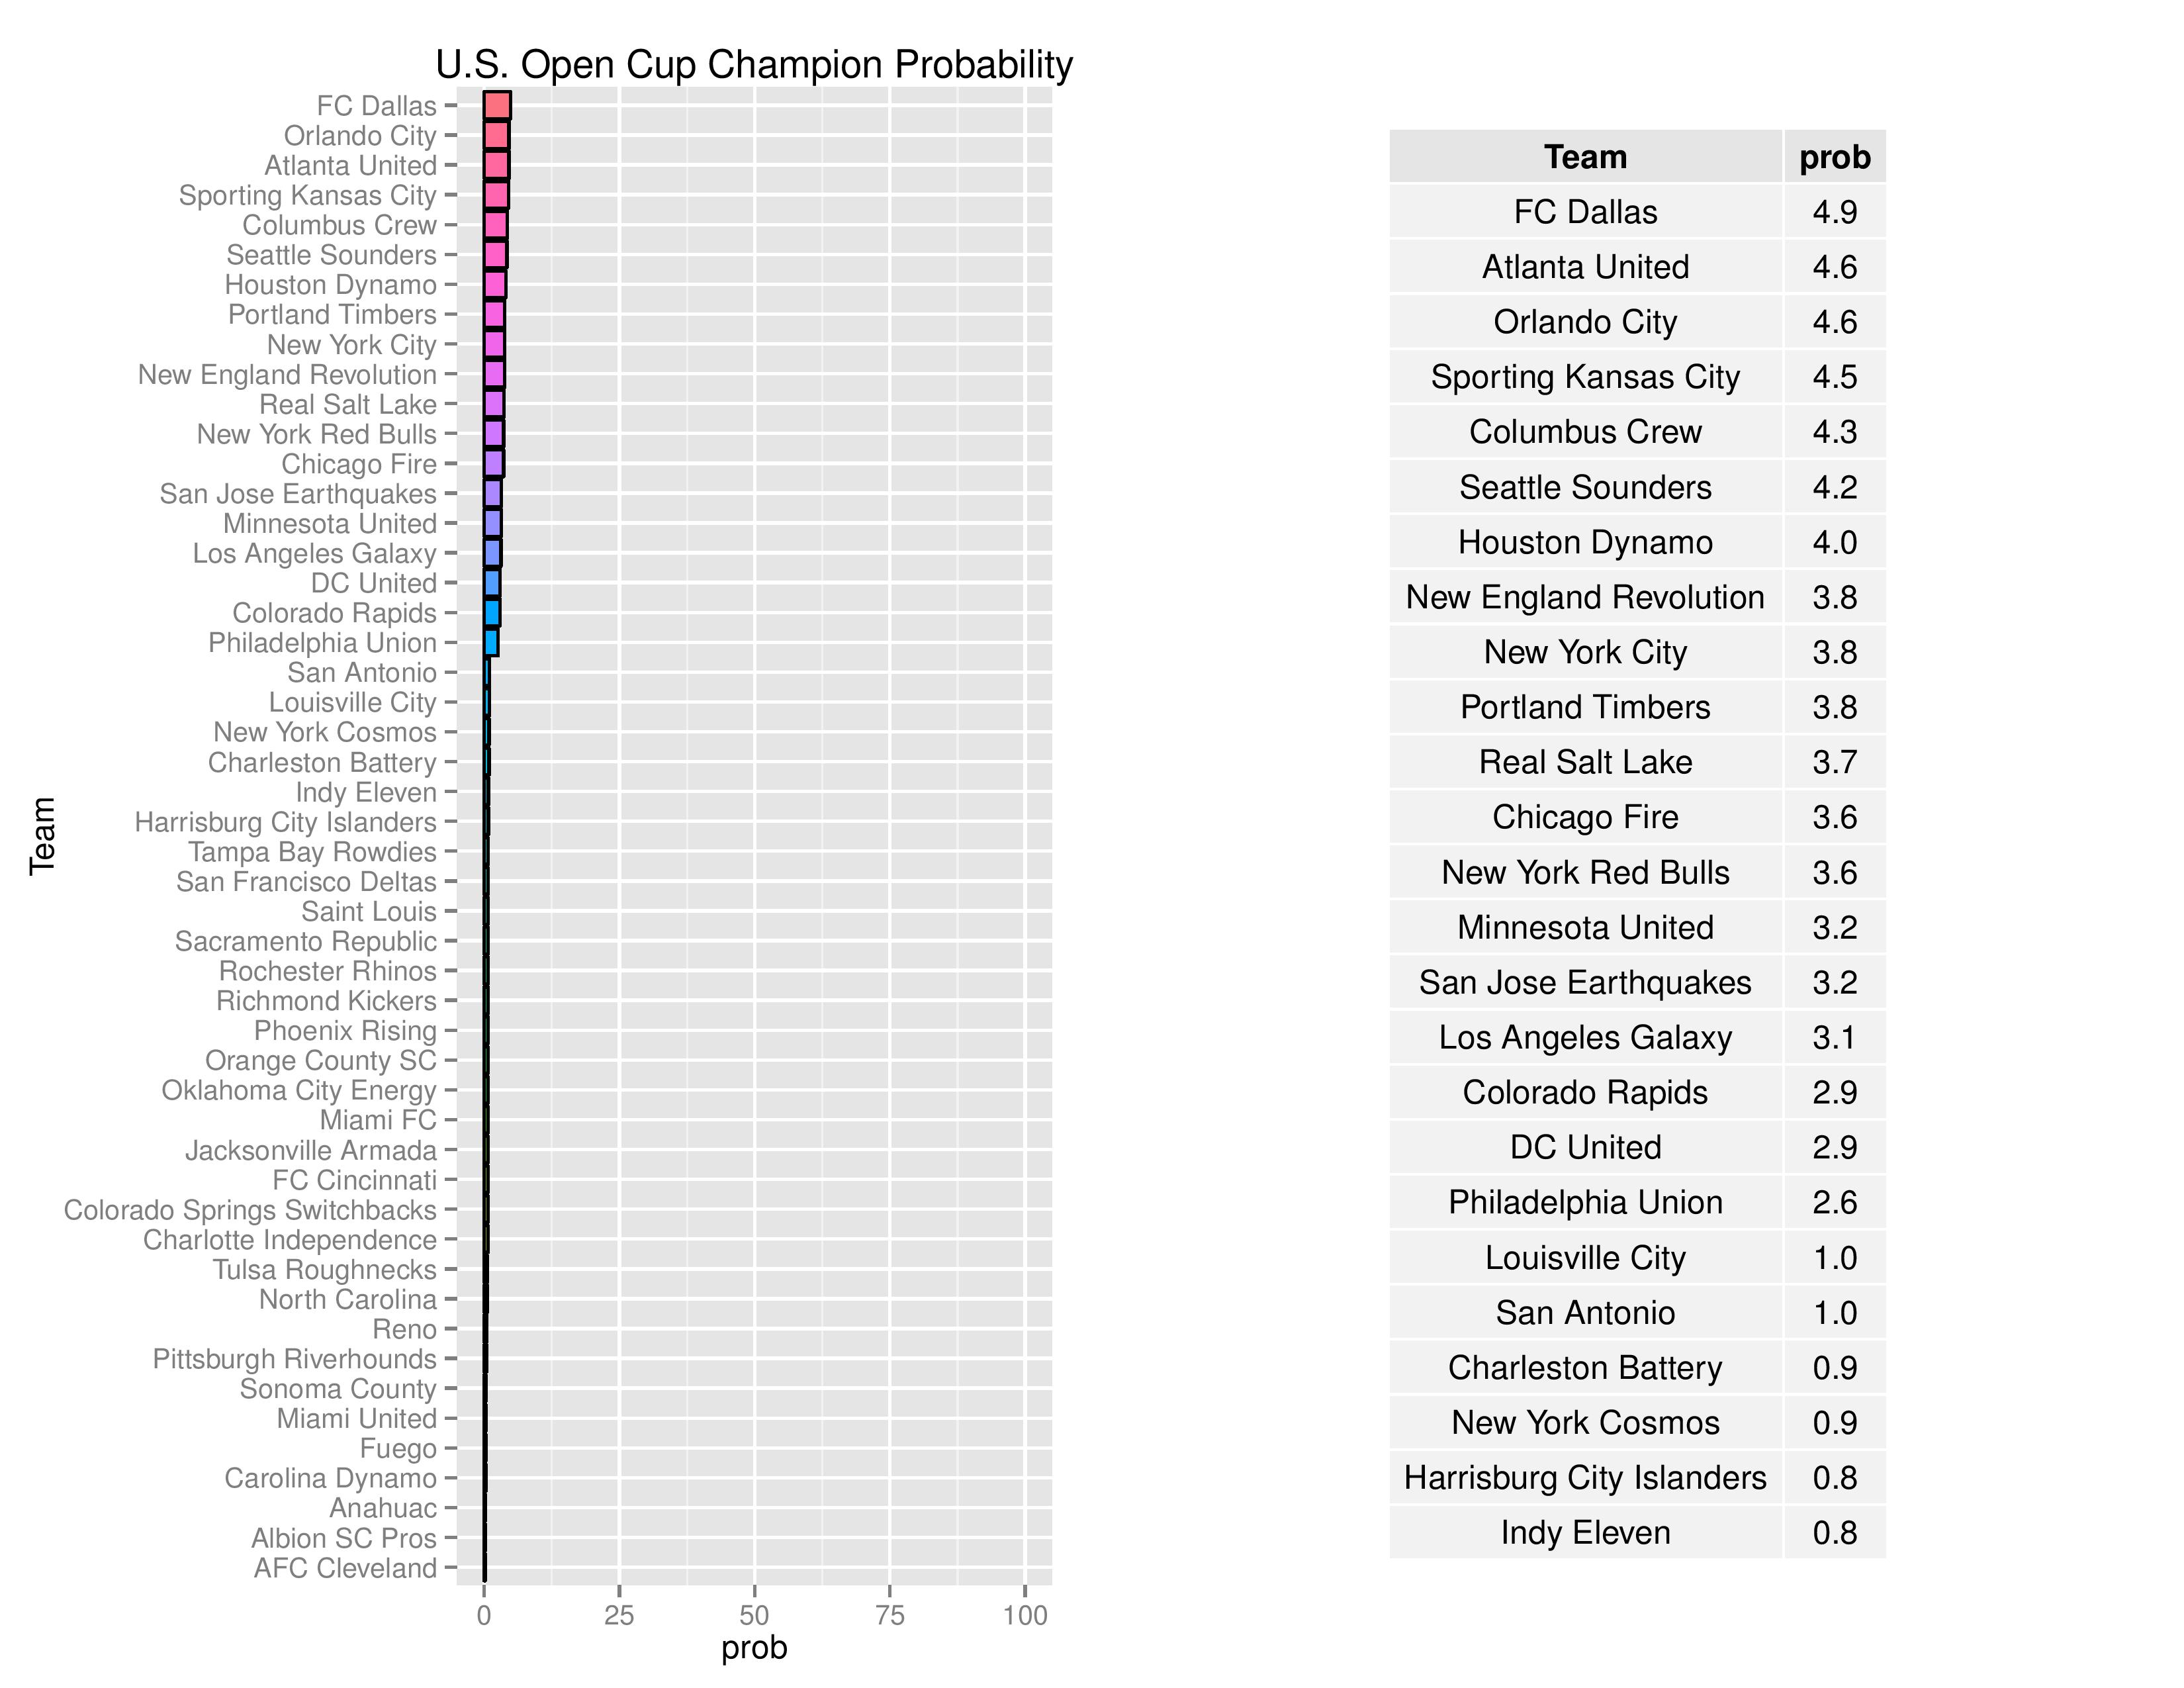
Philadelphia’s odds of winning the U.S. Open Cup have increased from 1.8% to 2.6%.
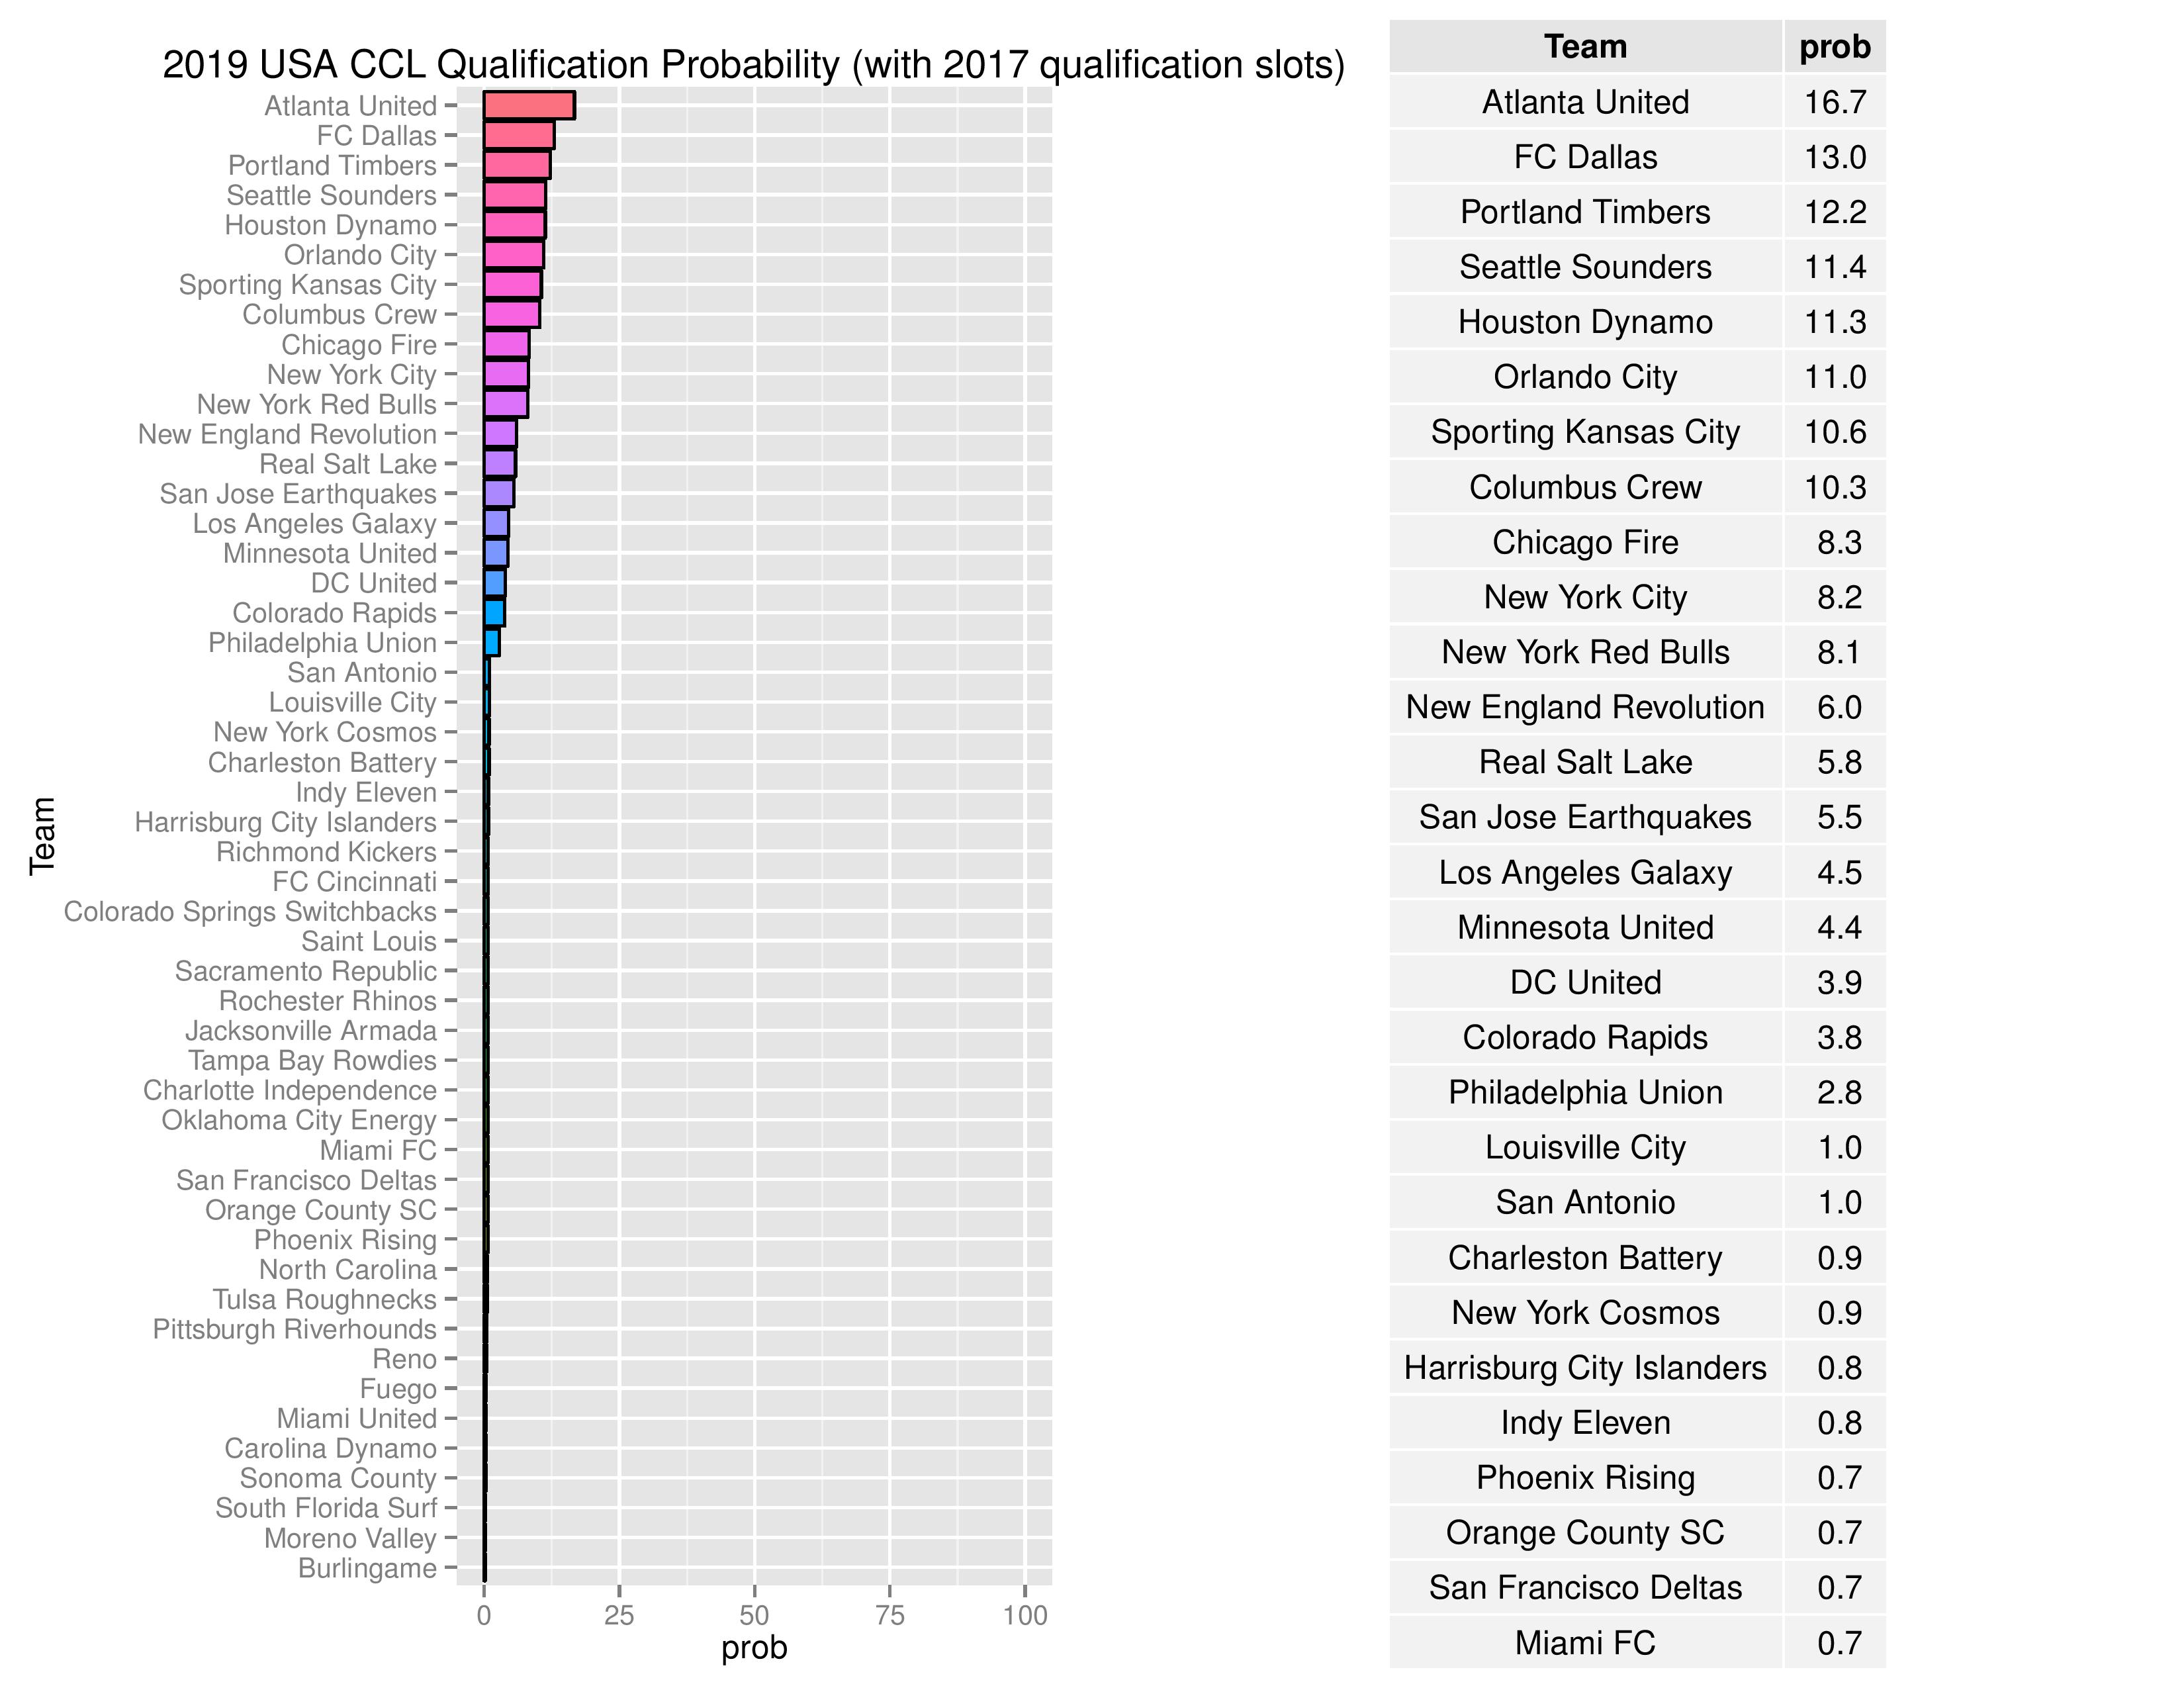
I have painstakingly added in all of the known logic regarding the 1st and 2nd round draws.
The table shows only the top 25 teams and the graph shows the top 50 teams (with respect to probability of winning).
**A recap on the changing CCL’s structure and thus the USA’s and Canada’s changing qualification for the CCL tournament:
The new USA qualification slots will now be: 2017 MLS Cup Winner, 2018 MLS Cup Winner, 2017 USOC Winner, and 2018 USOC Winner. If a Canadian team wins either MLS Cup or a single USA team wins multiple slots, then presumably the remaining slots will go to the top, not-yet-qualified 2018 MLS regular season finishers.
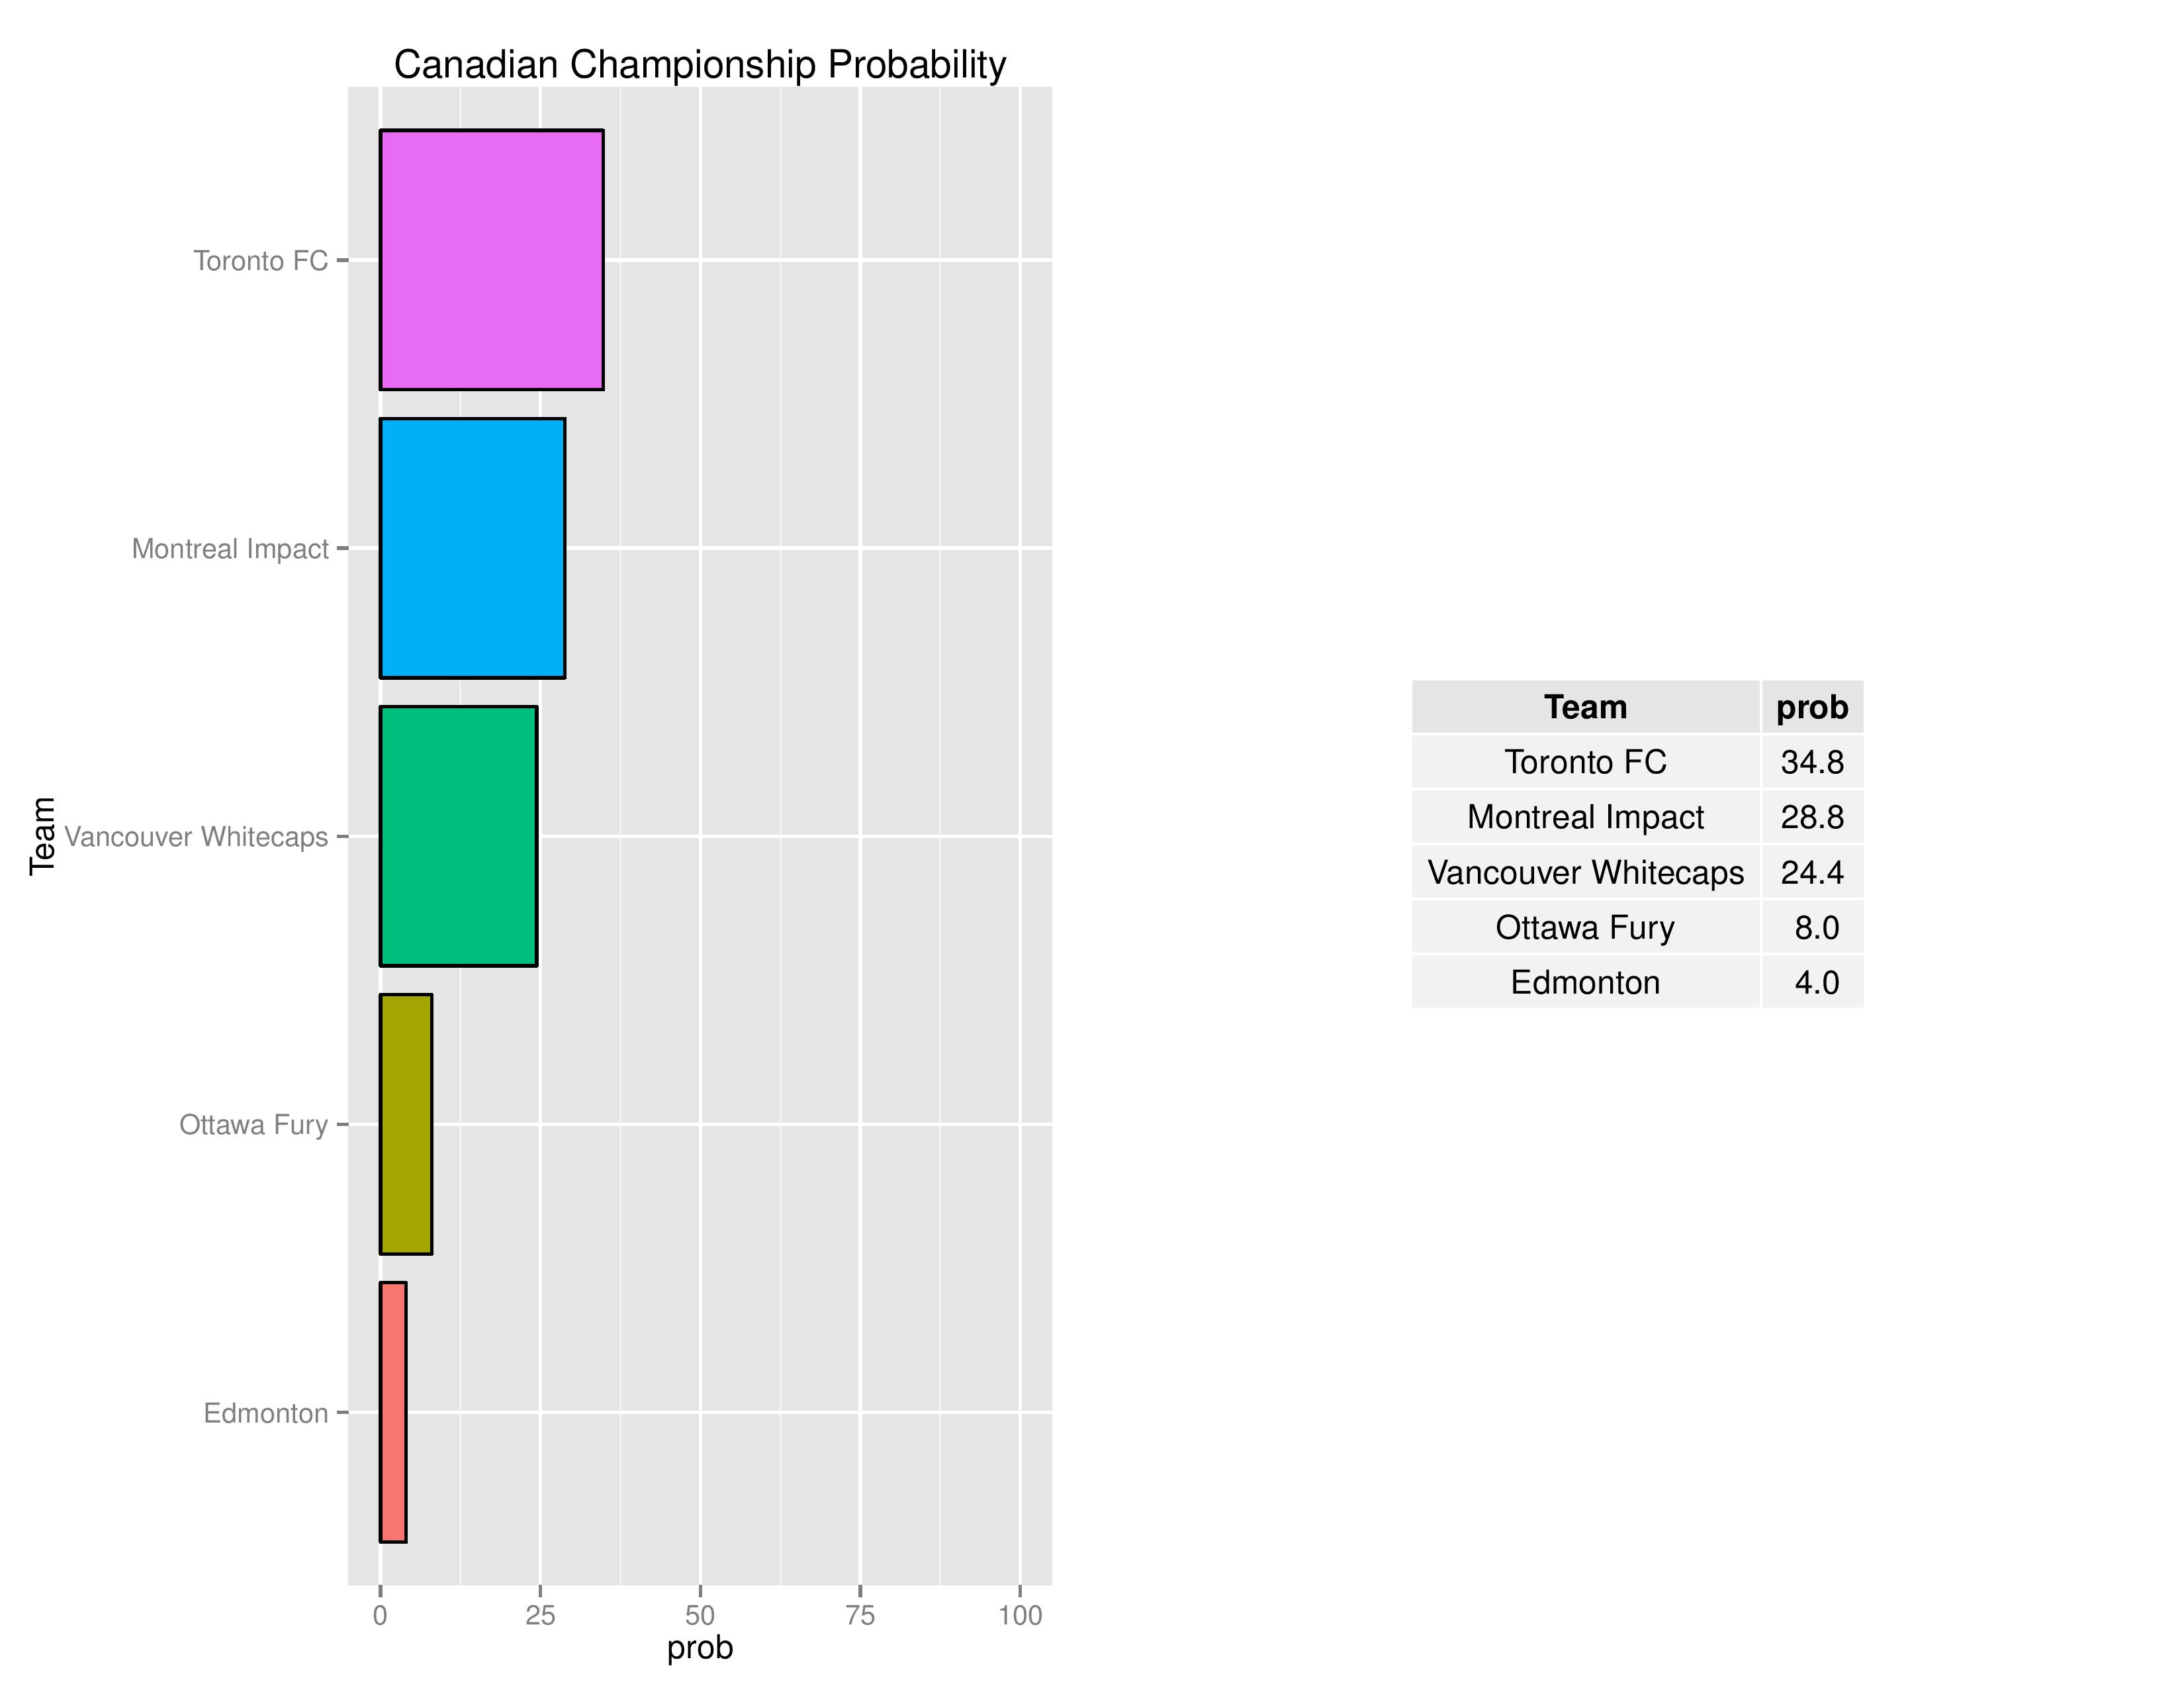
The new Canadian qualification slot will go to the winner of Toronto (at home, as the 2016 Canadian Championship Winner) vs. 2017 Canadian Championship Winner (assuming it isn’t Toronto).
The slots which no longer automatically qualify (until the 2020 CCL tournament for USA, 2019 for Canada) are the regular season conference winners (for USA teams) for 2017/2018 and the 2016/2017 Canadian Championship Winners.
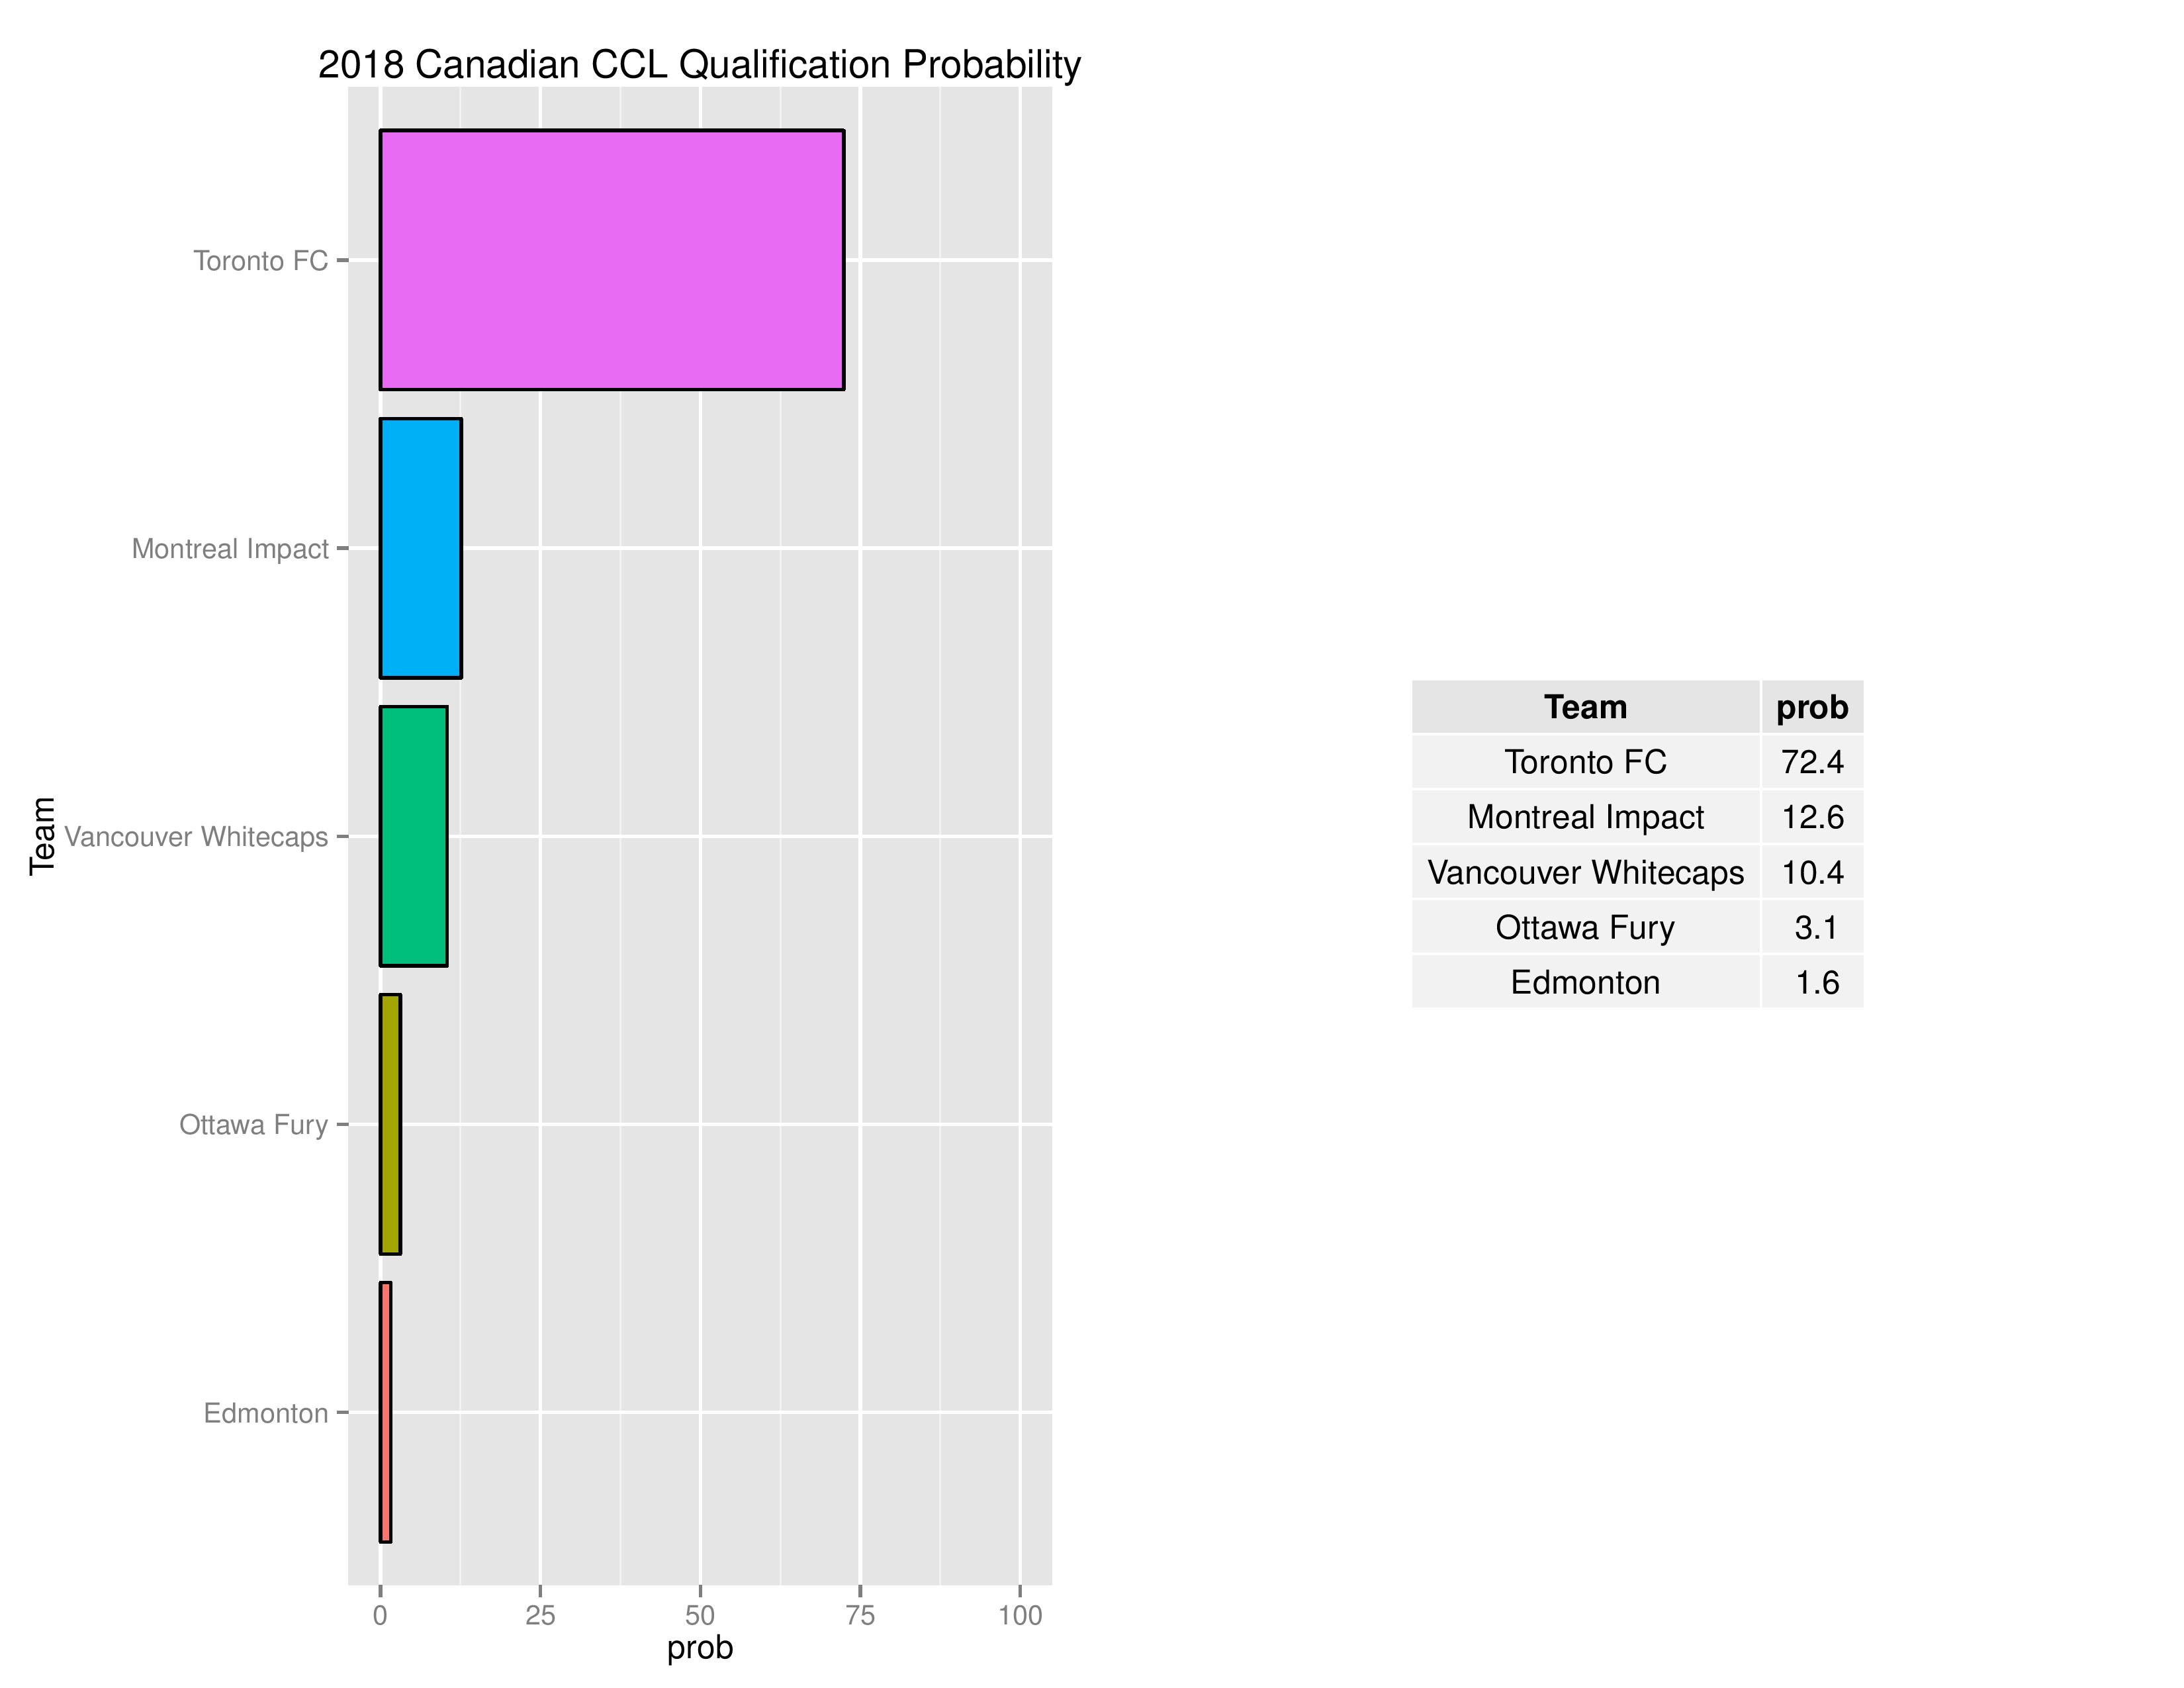
The chances of Canadian teams qualifying for the 2018 CCL are as follows (USA teams remained set as qualified last year).
Philadelphia’s chances for qualifying in 2017 for the 2019 edition of the CONCACAF Champions League have increased from 1.8% to 2.8%.
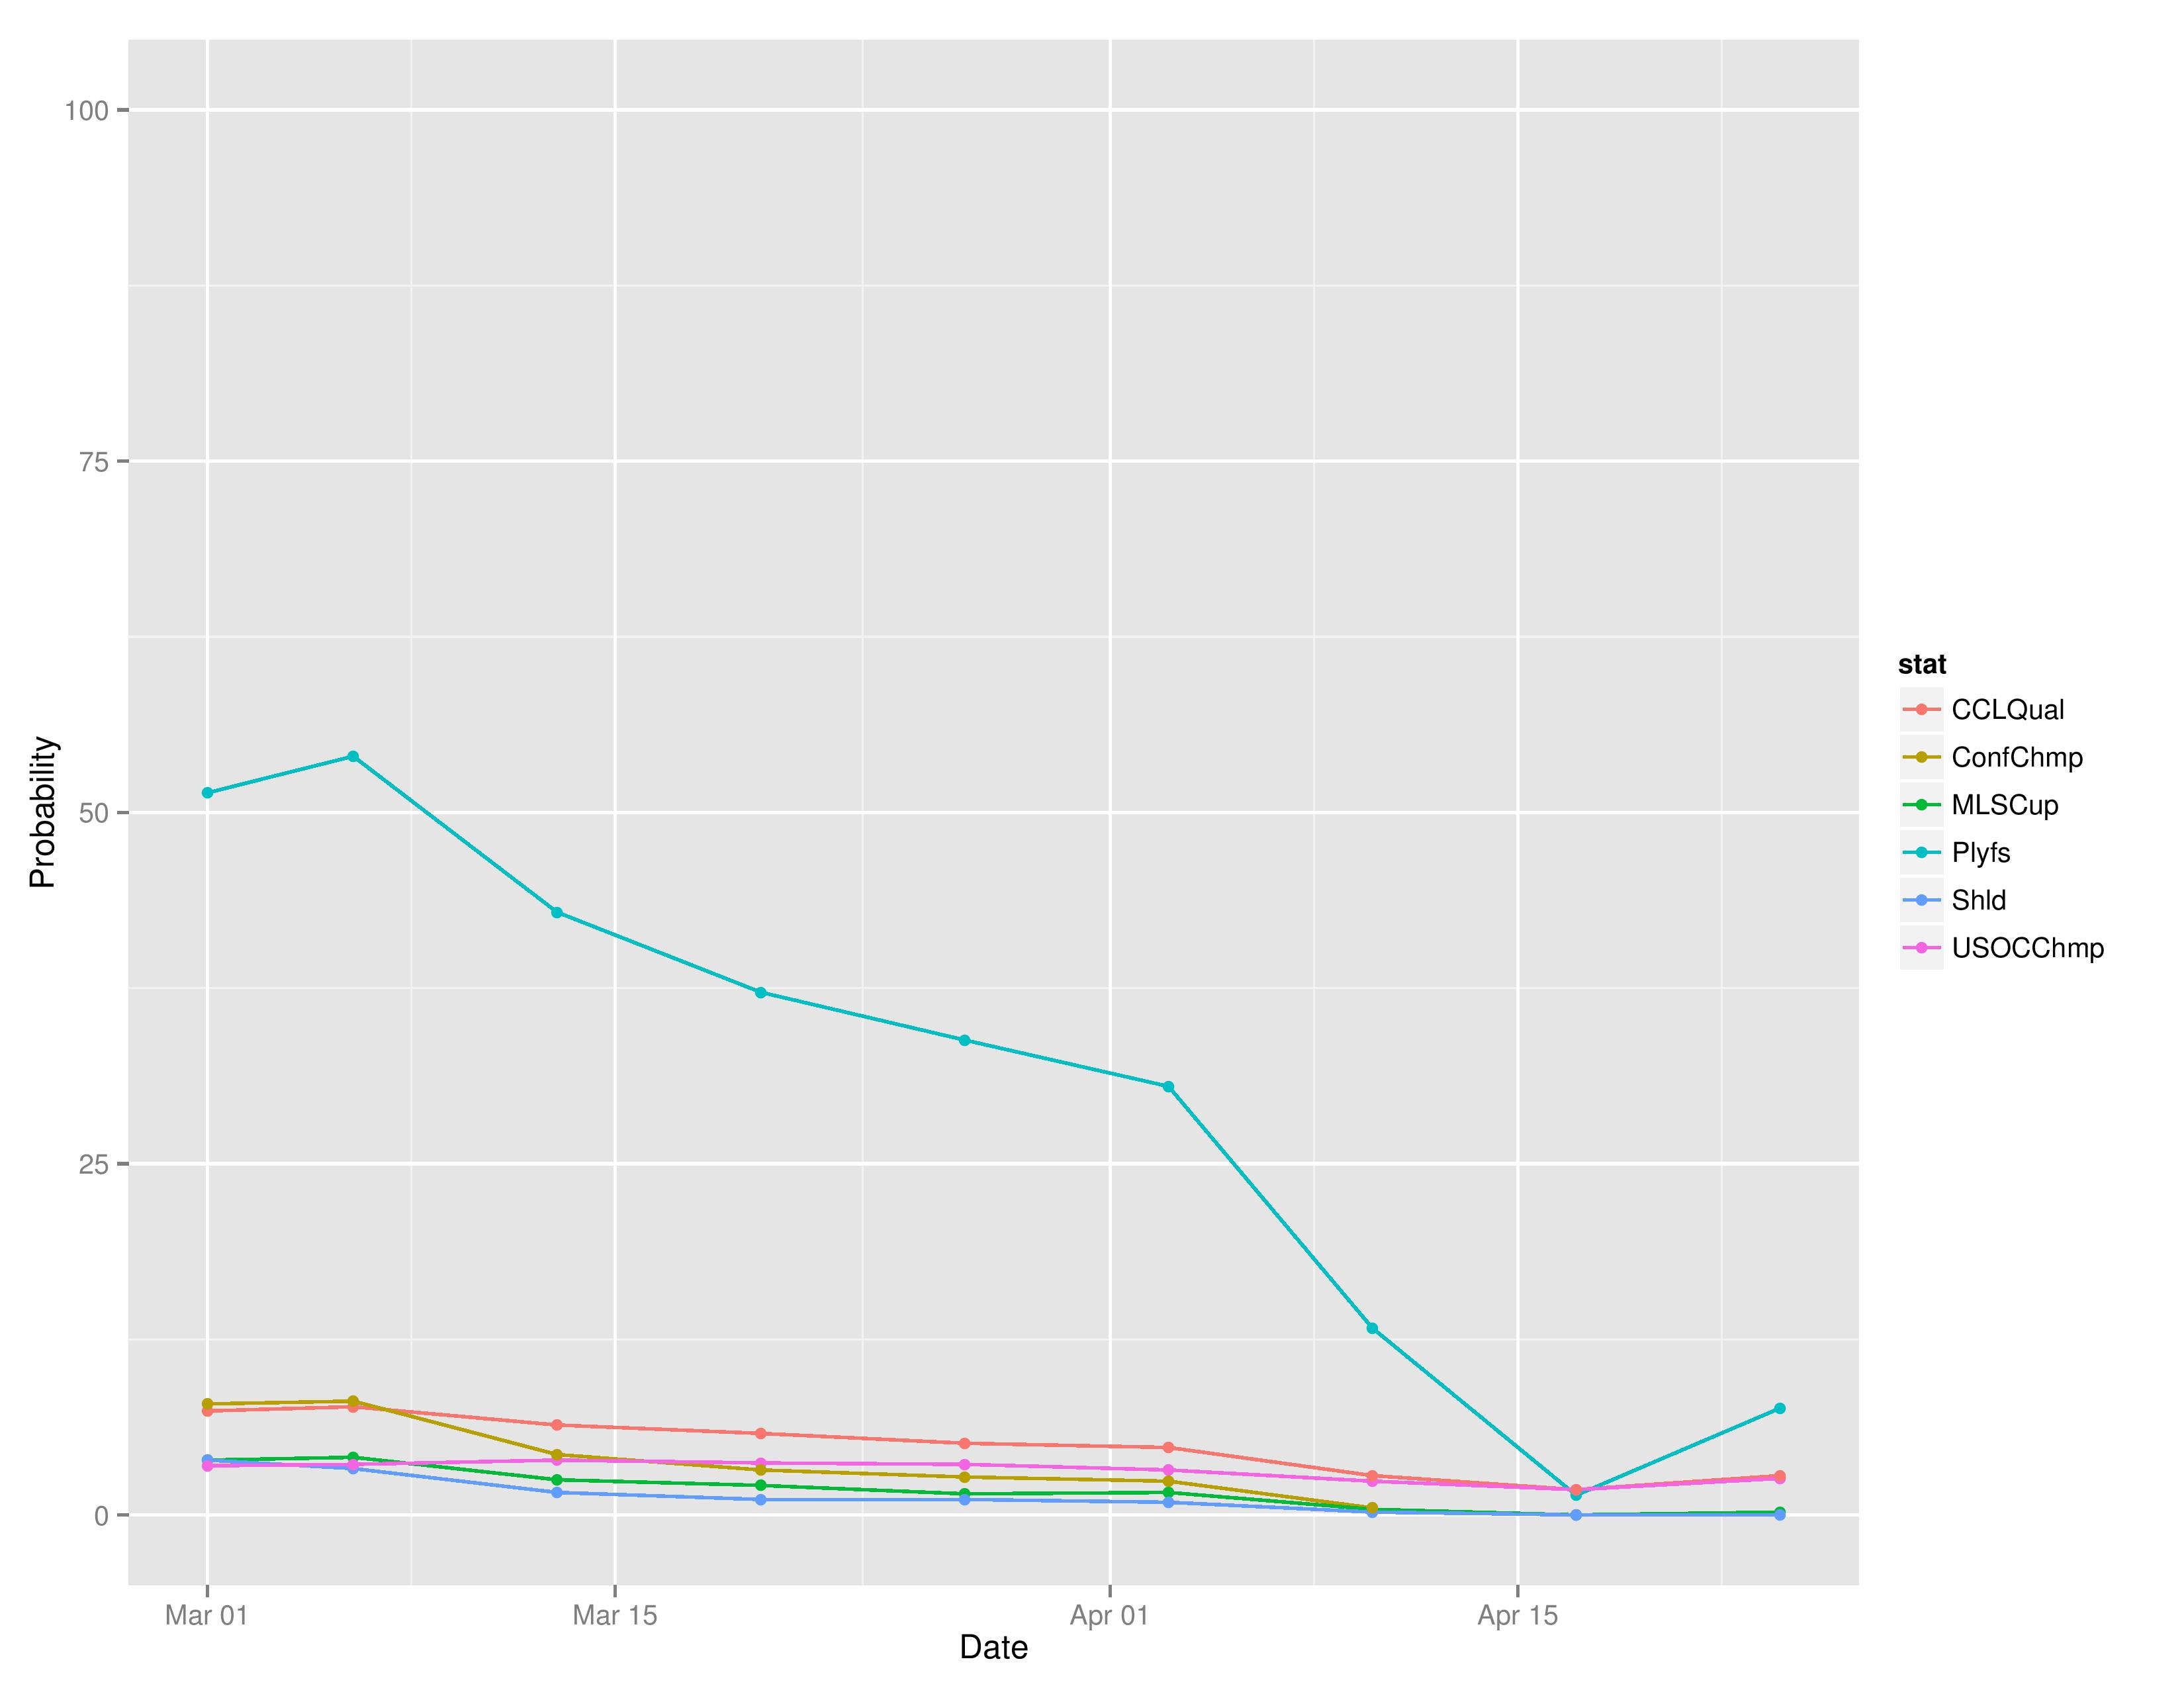
Over time, we can see how Philadelphia’s odds for different prizes have changed.
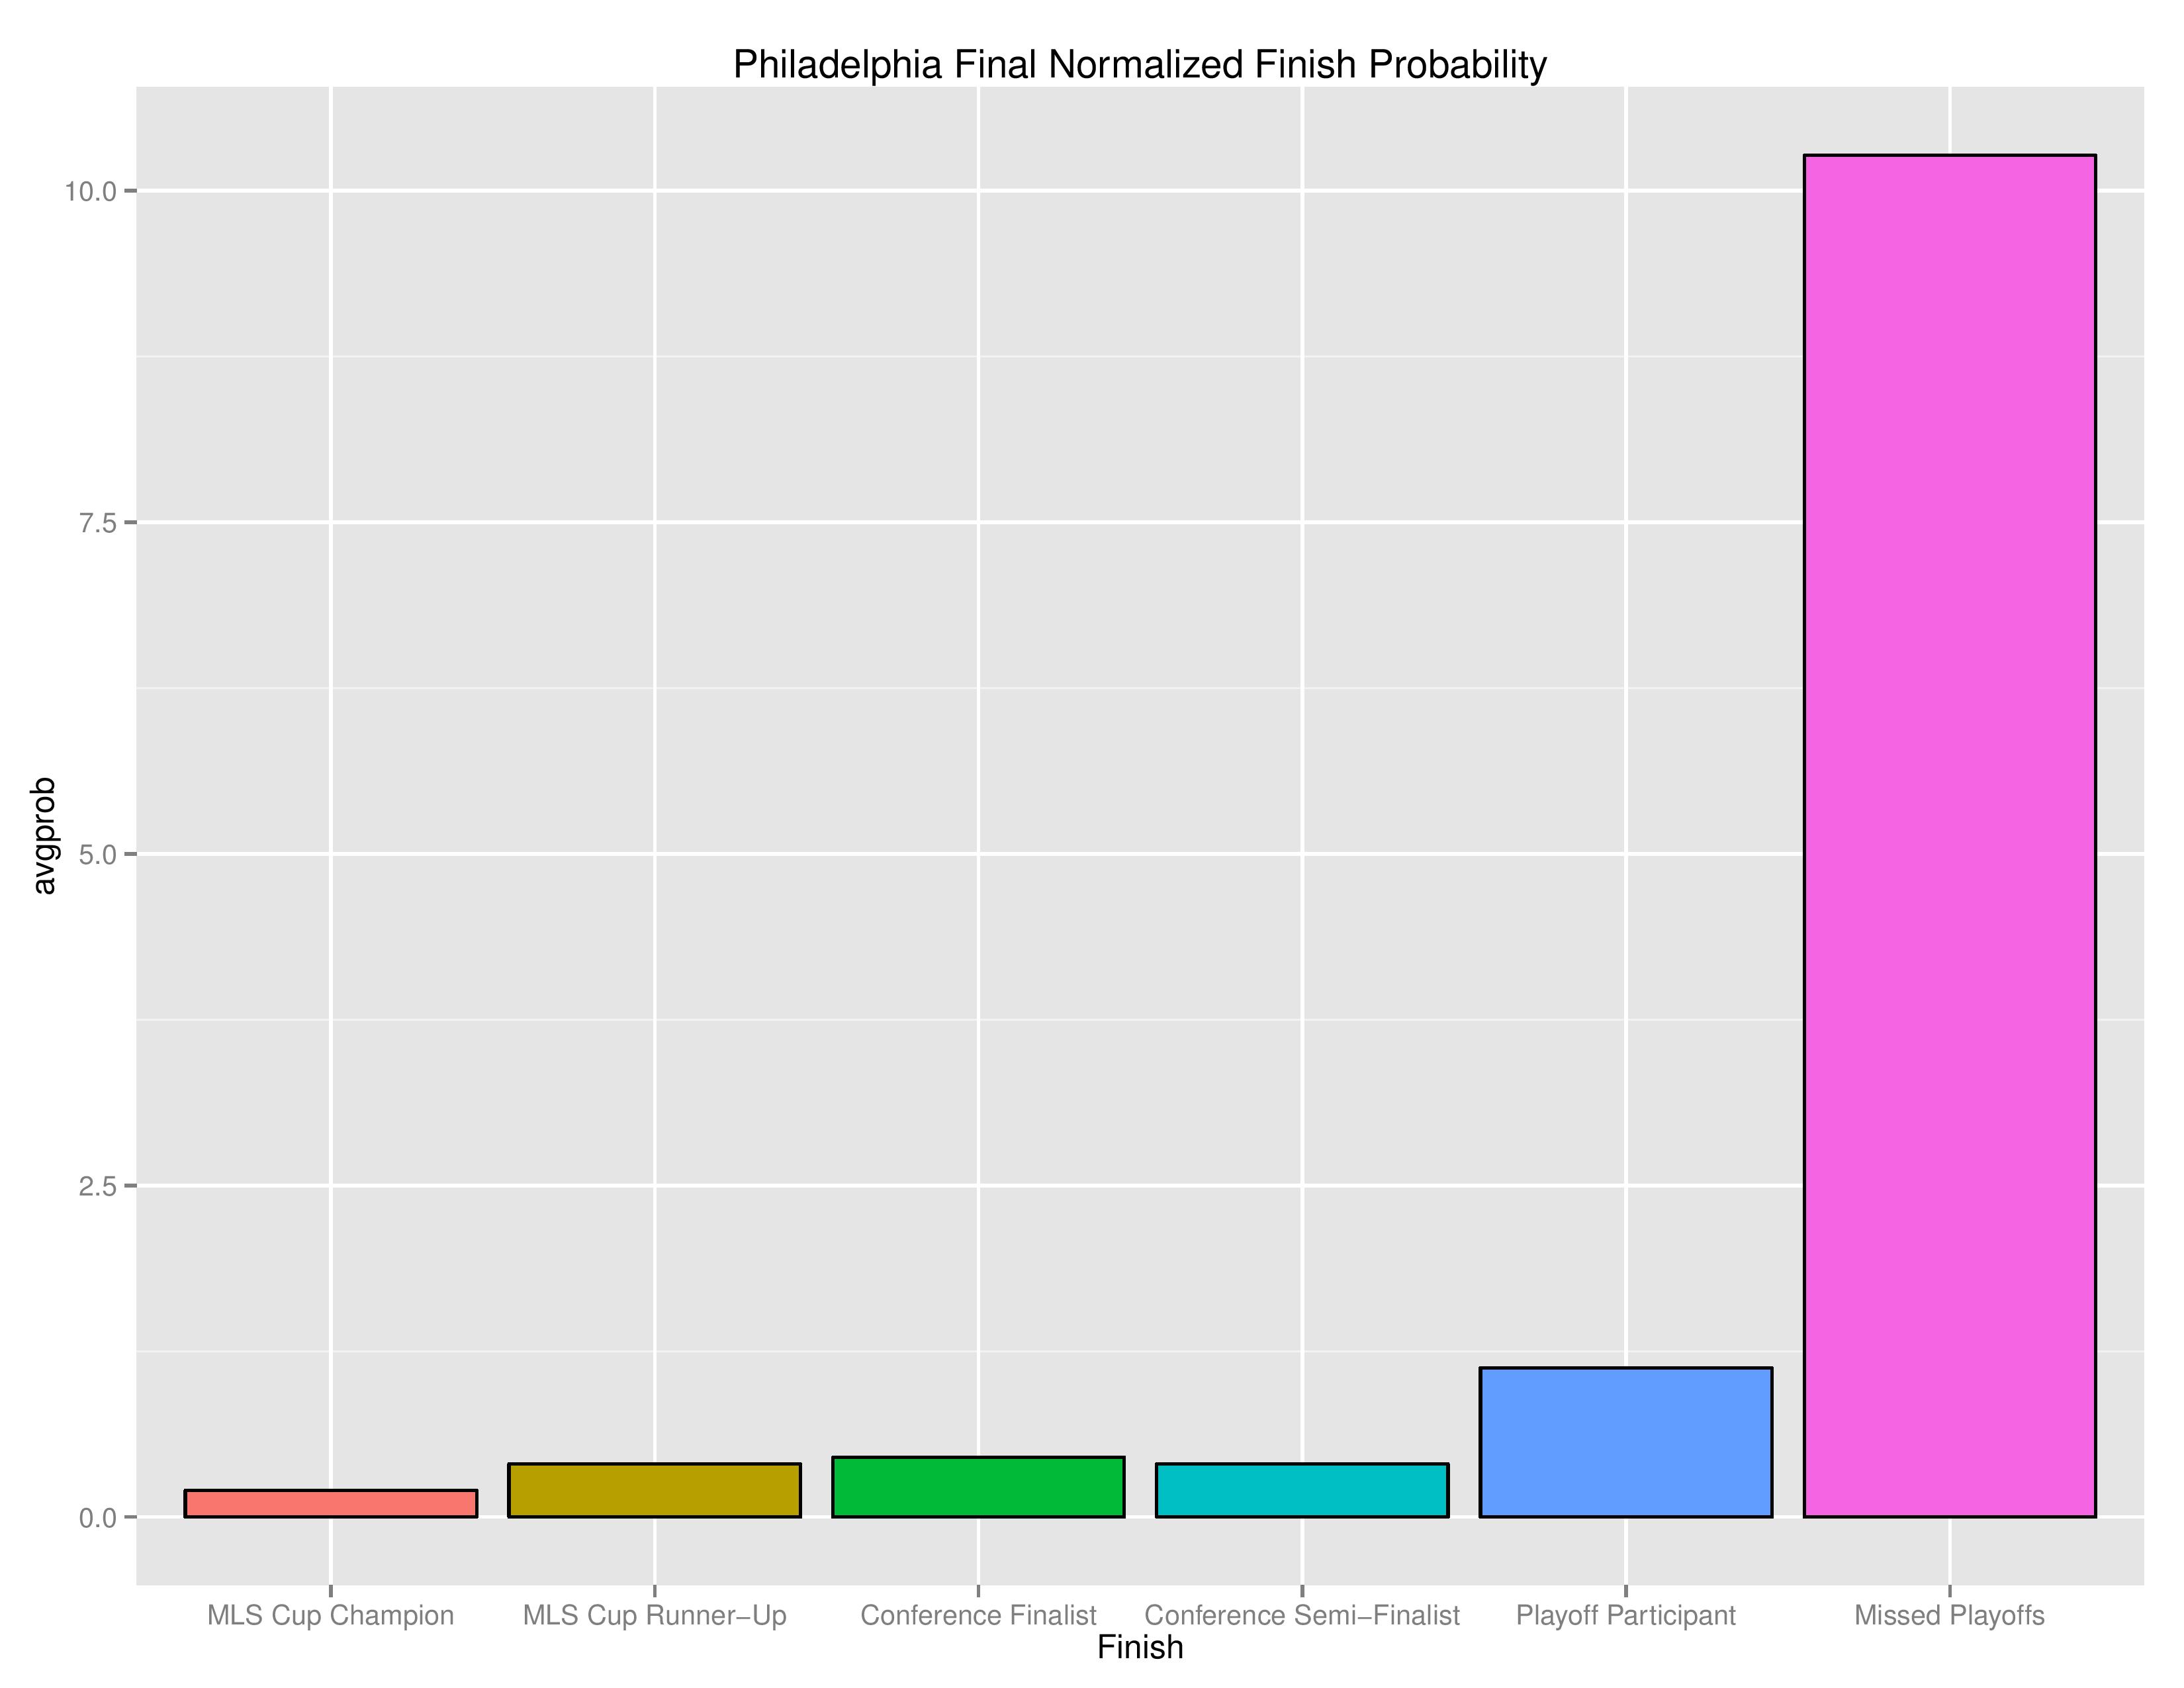
The following are probabilities for each category of outcomes for Philadelphia:
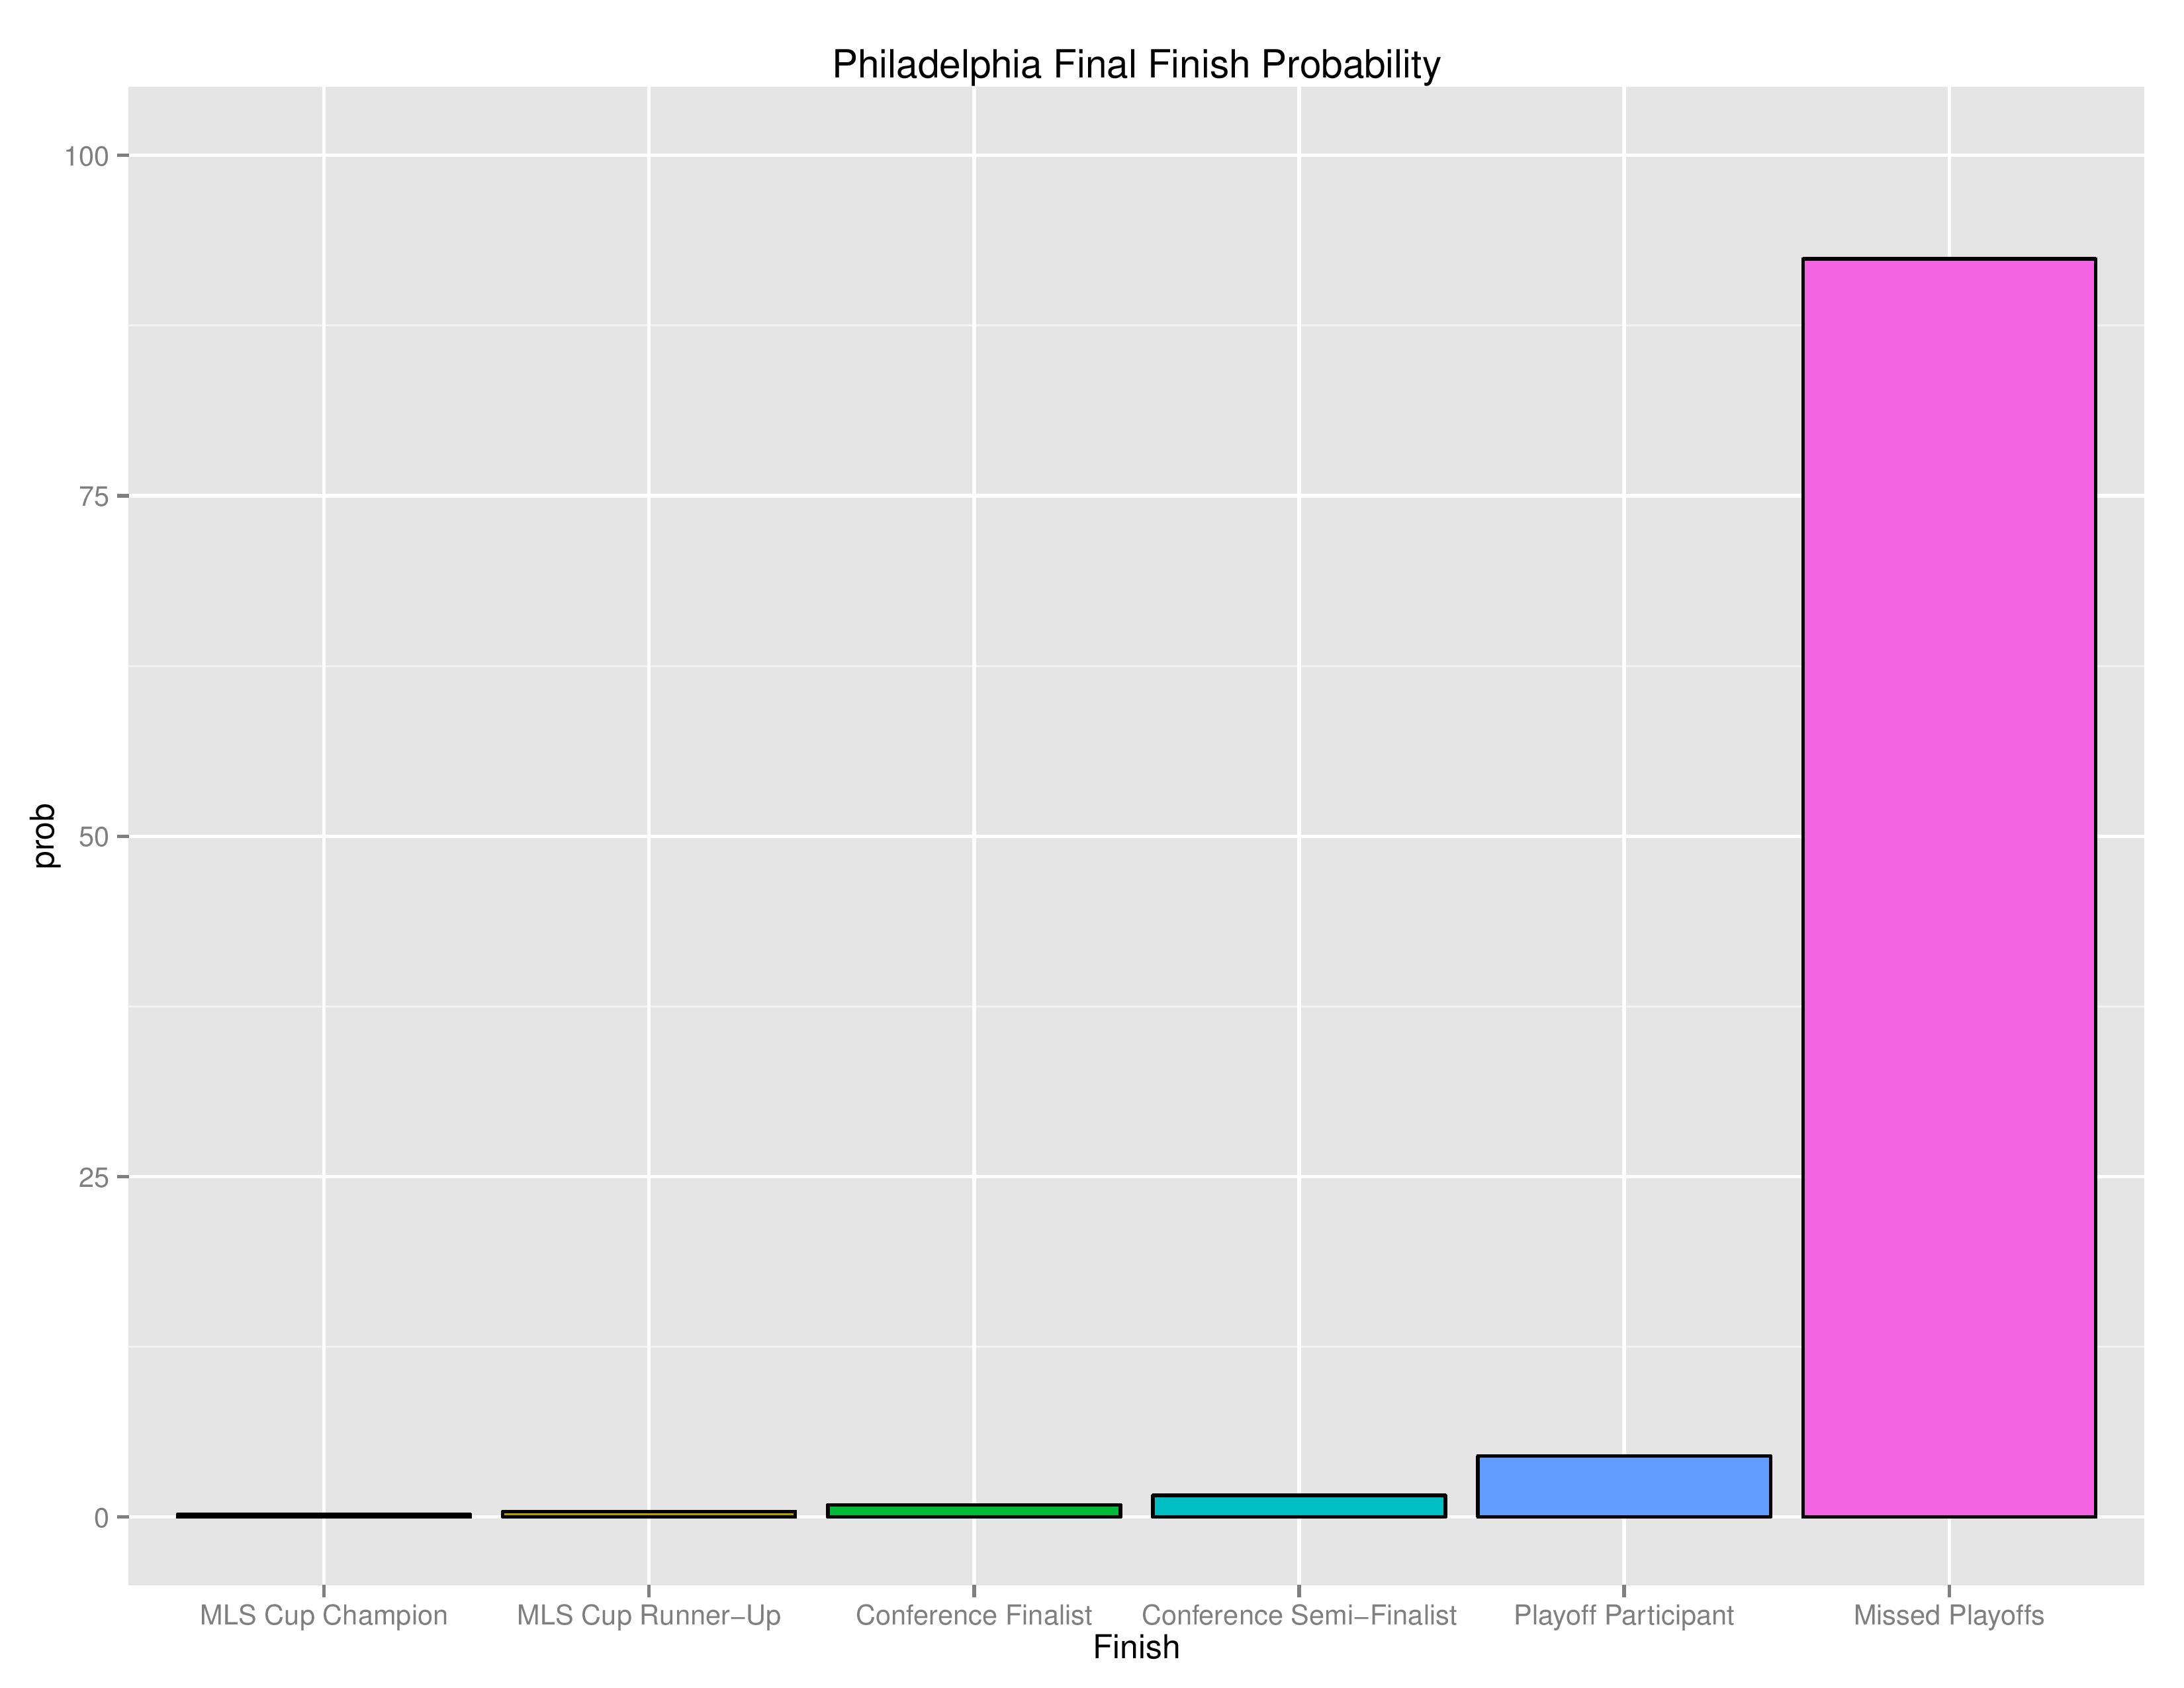
The following shows the relative probability of the prior categories. If the projection system were entirely random, these bars would be even, despite that “Missed Playoffs” is inherently 10 times more likely than “MLS Cup Champion.” The chart outlines where the club is headed:
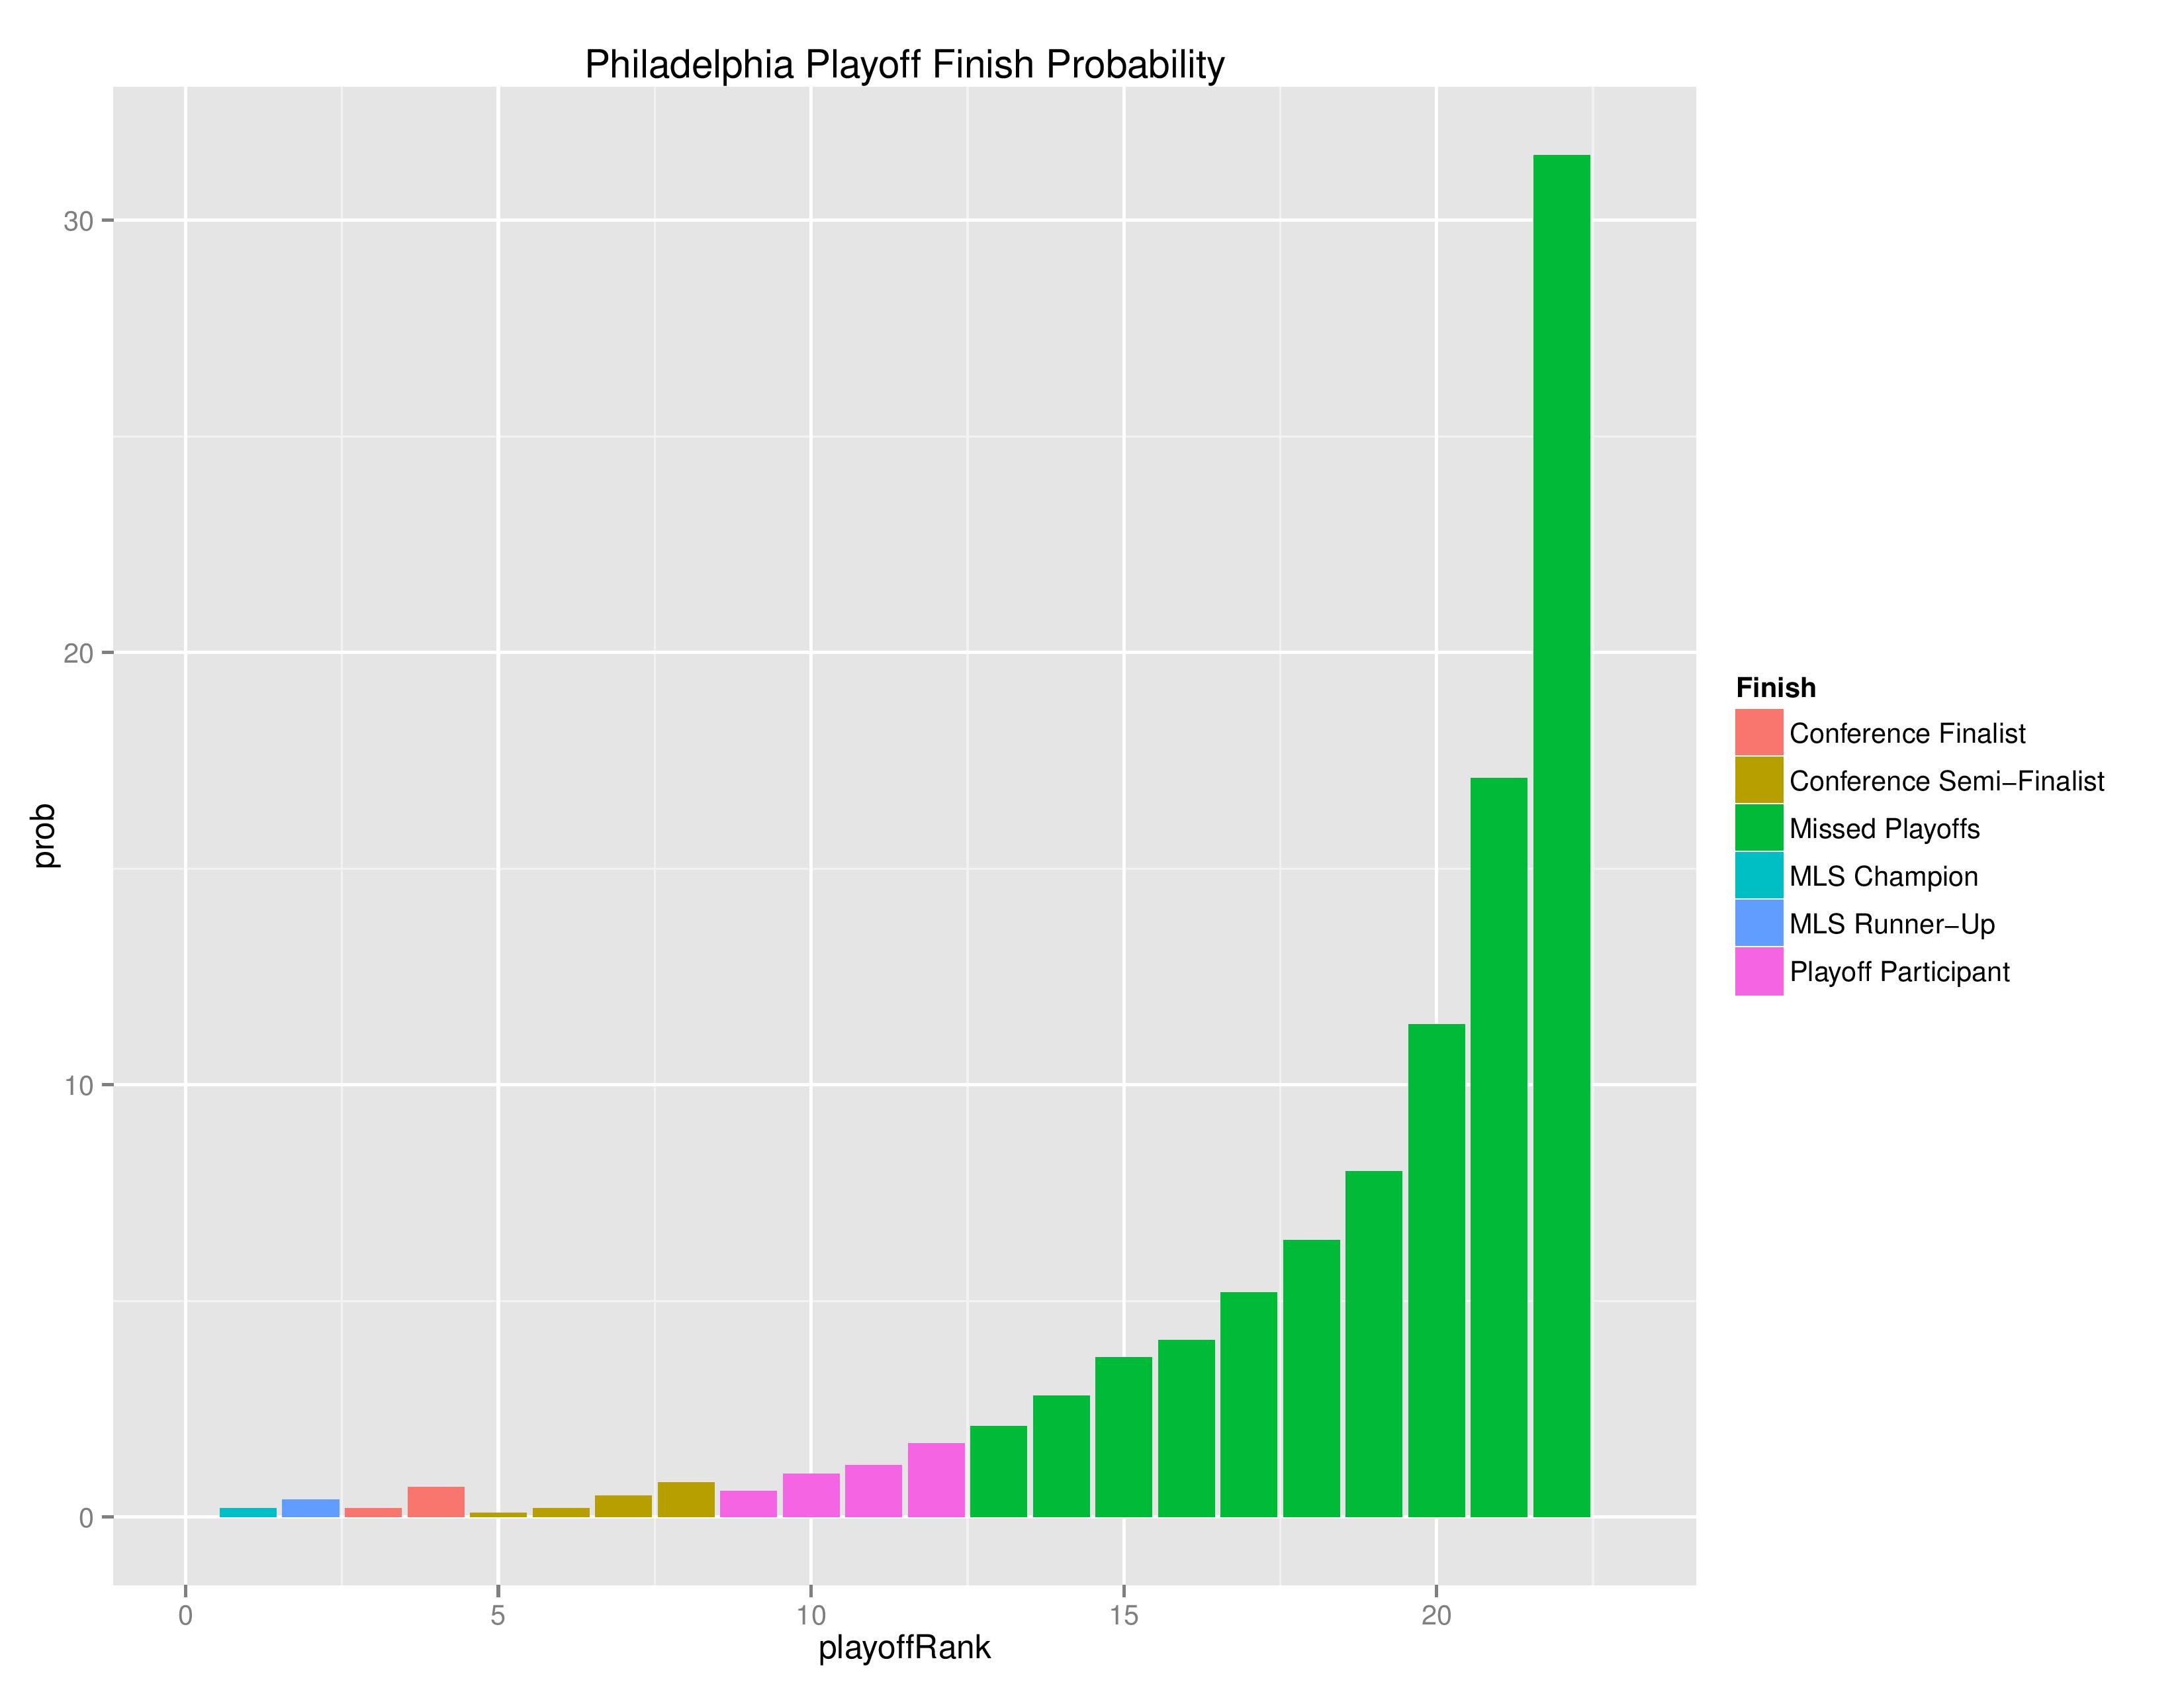
The following shows the probability of each post-playoff ranking finish:
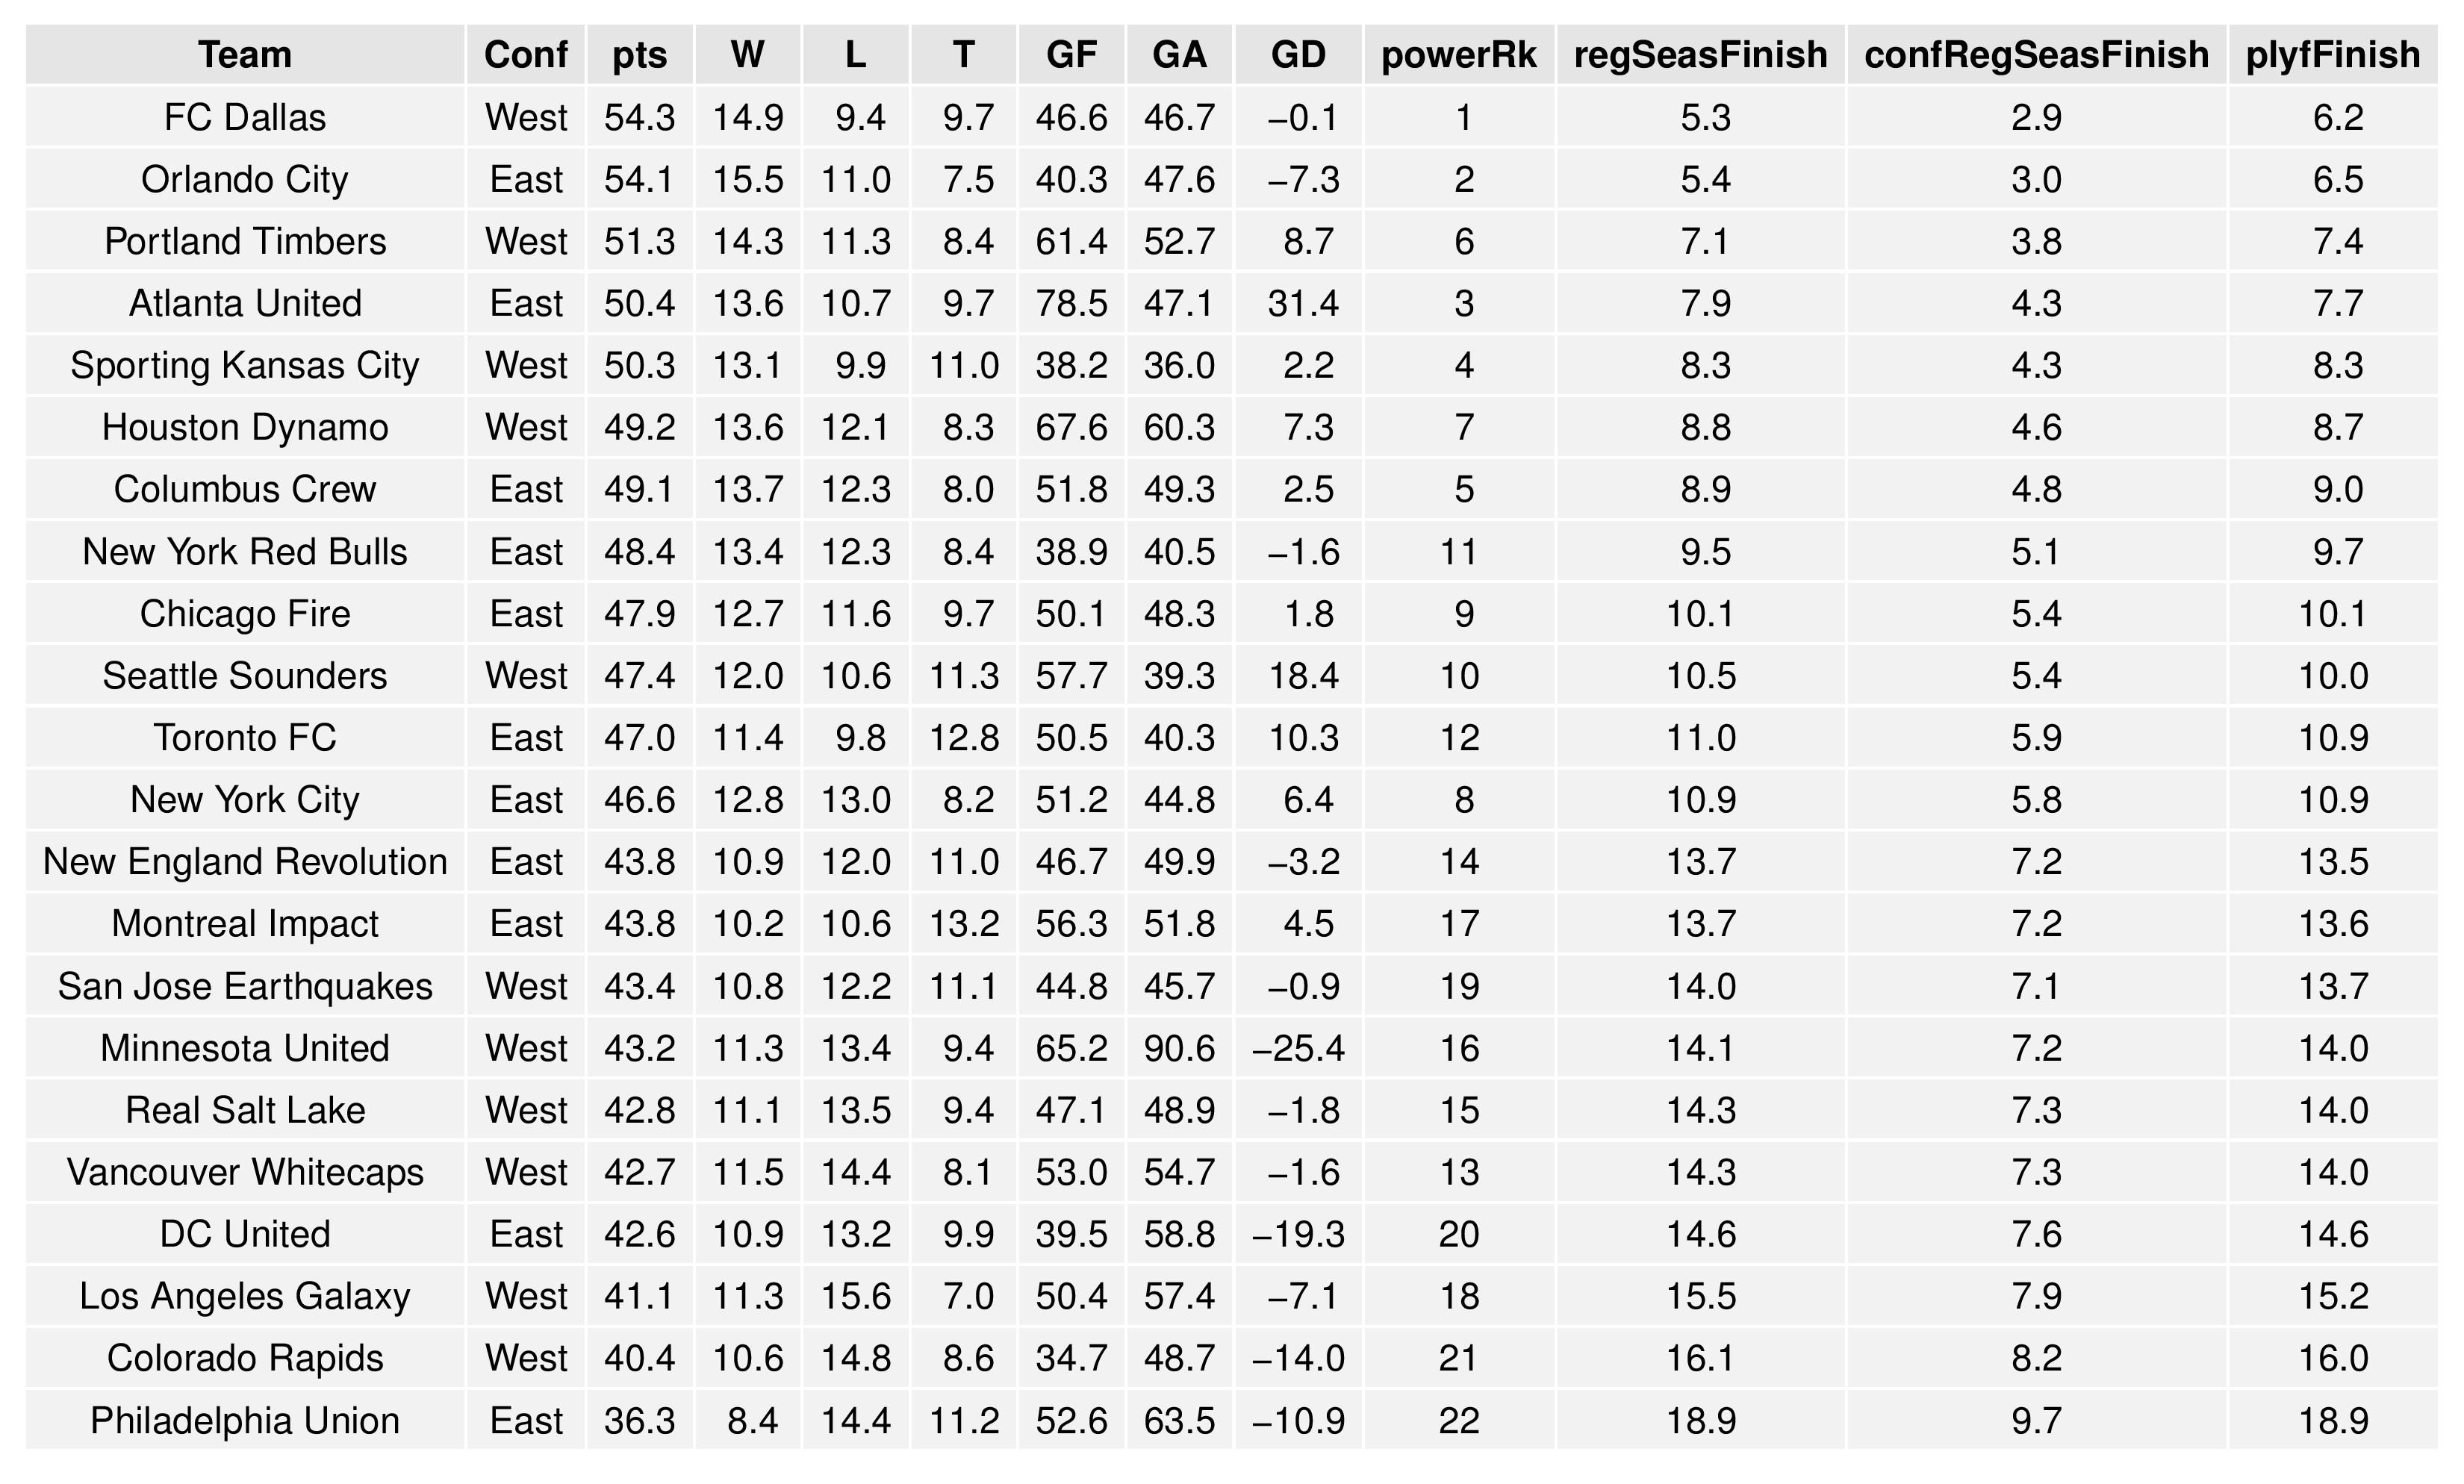
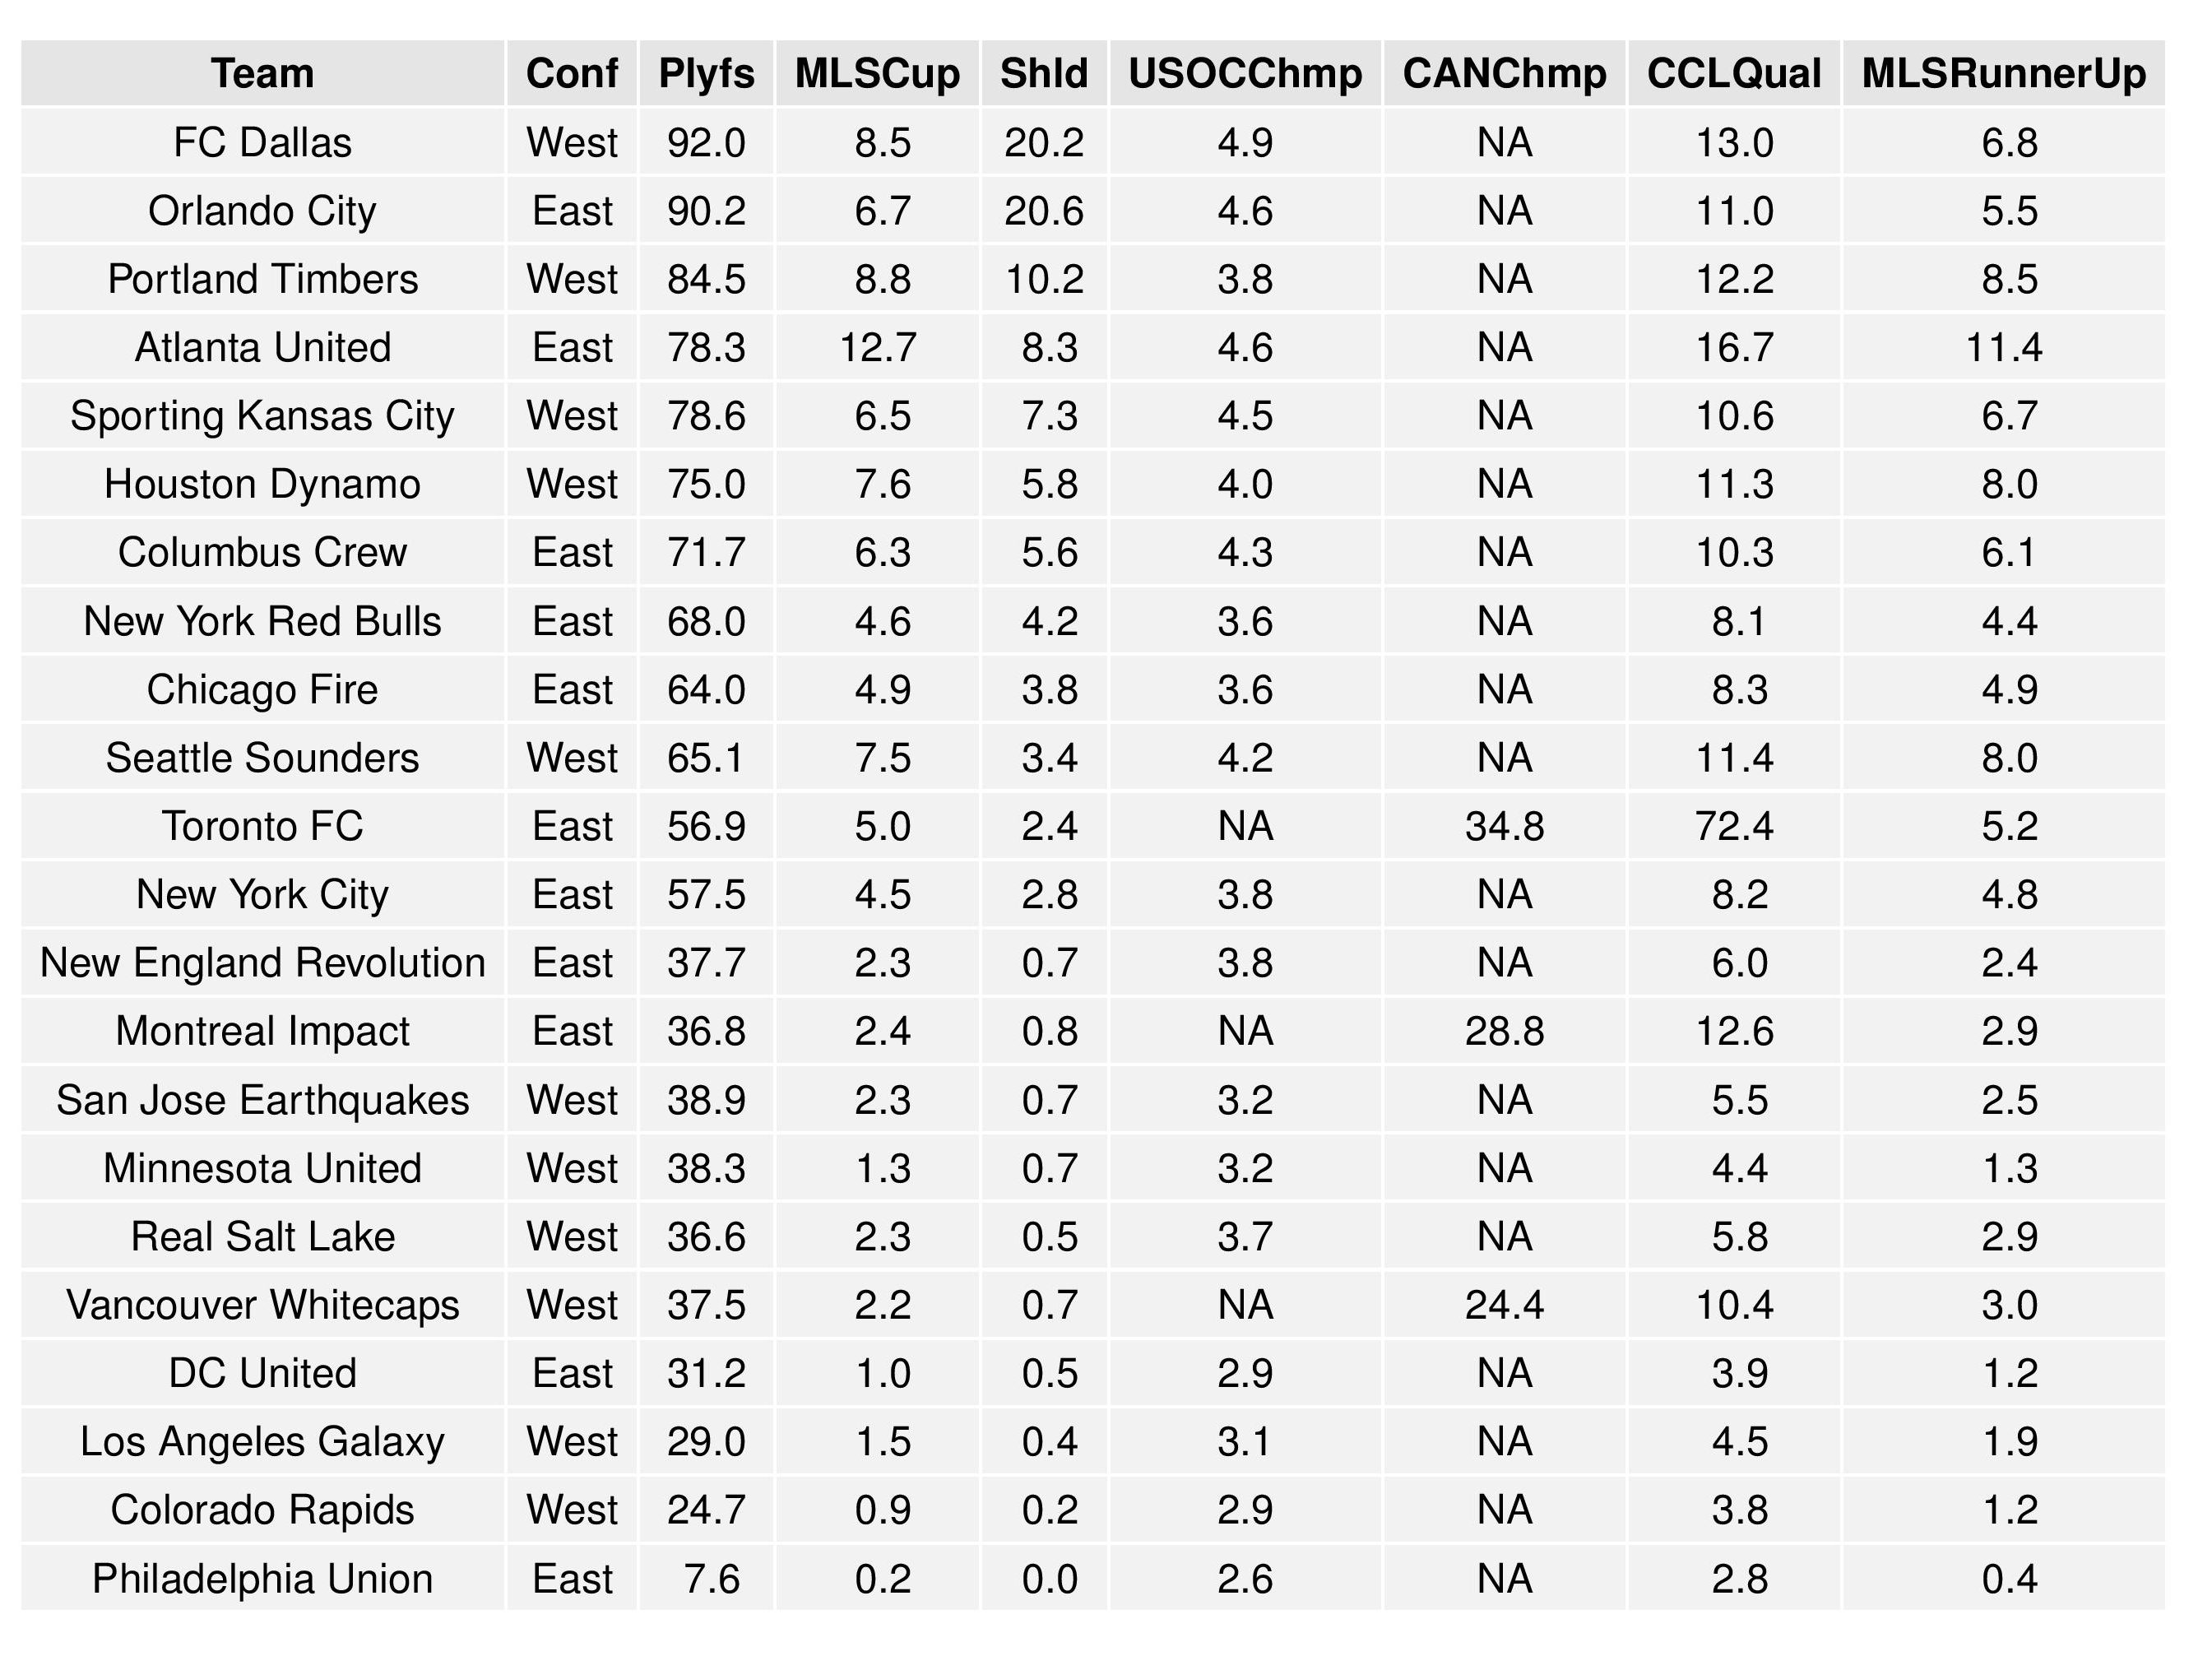
The following shows the summary of the simulations in an easy table format.
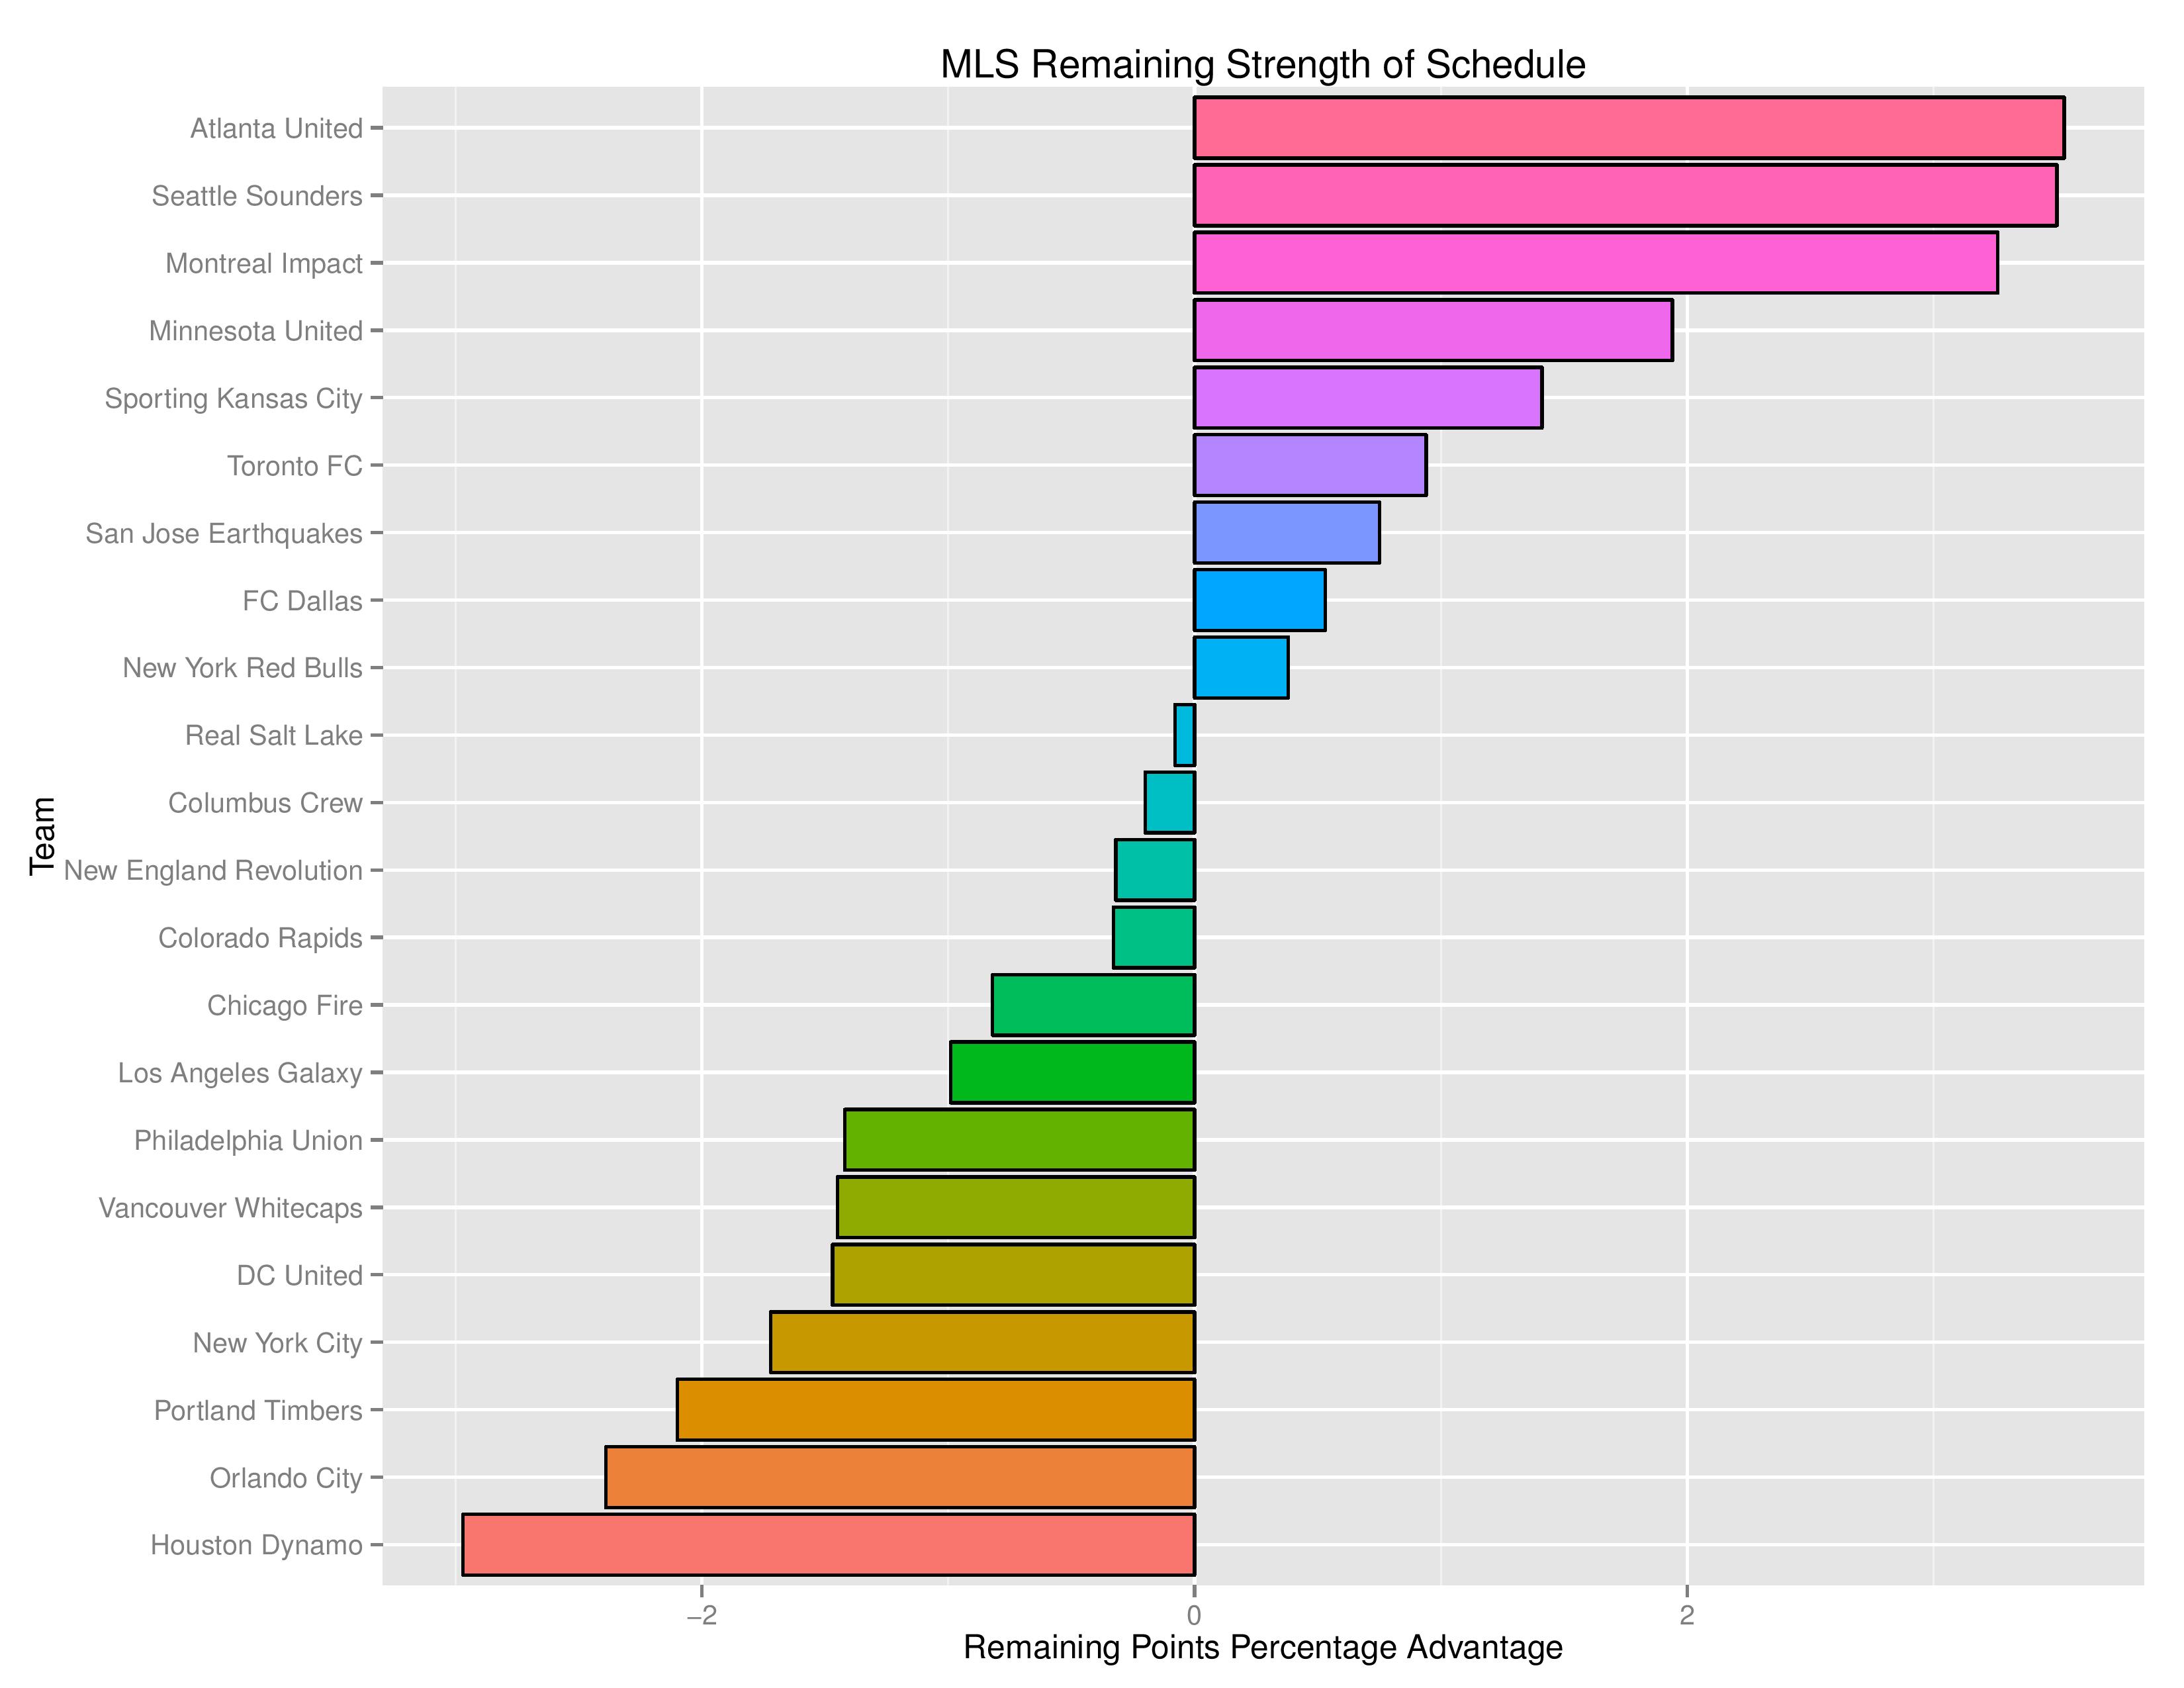
Next we show how the Remaining Strength of Schedule affects each team.
The “Points Percentage Advantage” shown on the X-axis represents the percentage of points expected over the league average schedule. This “points expected” value is generated by simulating how all teams would perform with all remaining schedules (and therefore judges a schedule based upon how all teams would perform in that scenario).
In short, the higher the value, the easier the remaining schedule.
Remaining home field advantage will be important here. It might also be true that a better team has an ‘easier’ schedule simply because they do not have to play themselves. Likewise, a bad team may have a ‘harder’ schedule because they also do not play themselves.
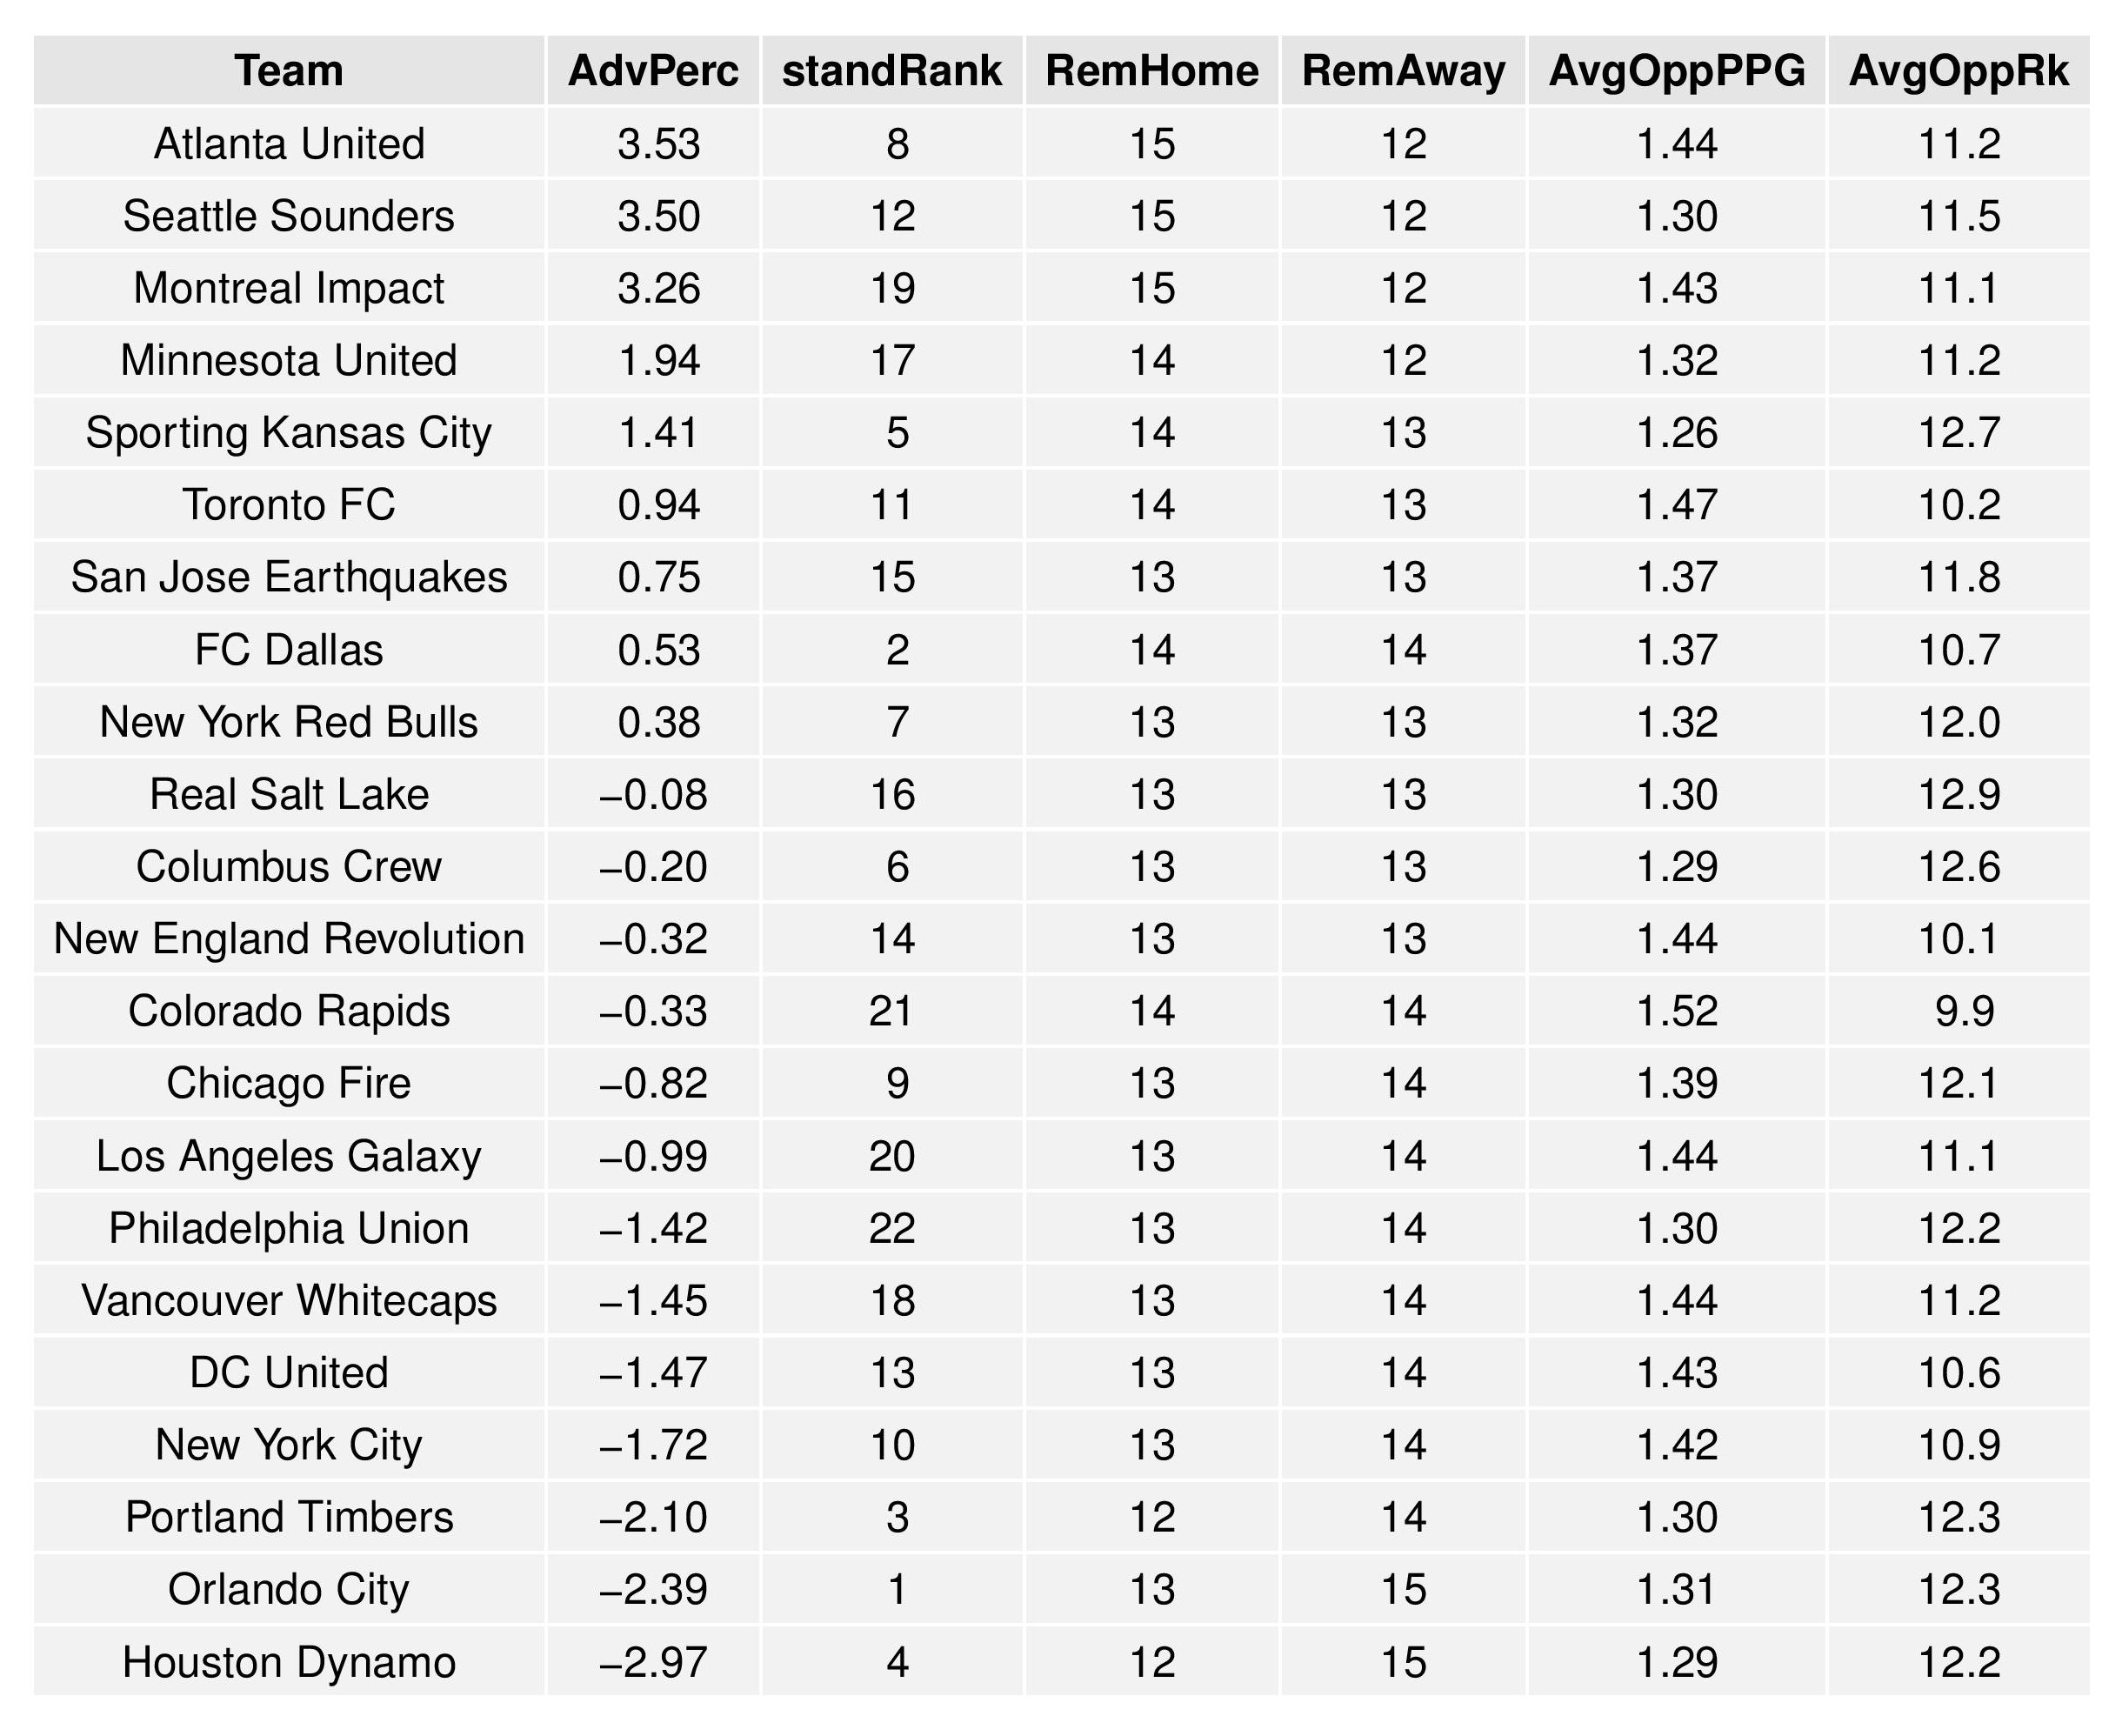
The table following the chart also shares helpful context with these percentages.
Accompanying the advantage percentage in the following table is their current standings rank (right now ties are not properly calculated beyond pts/gd/gf; I may fix that, but maybe not for a while), the remaining home matches, the remaining away matches, the current average points-per-game of future opponents (results-based, not model-based), and the average power ranking of future opponents according to SEBA.
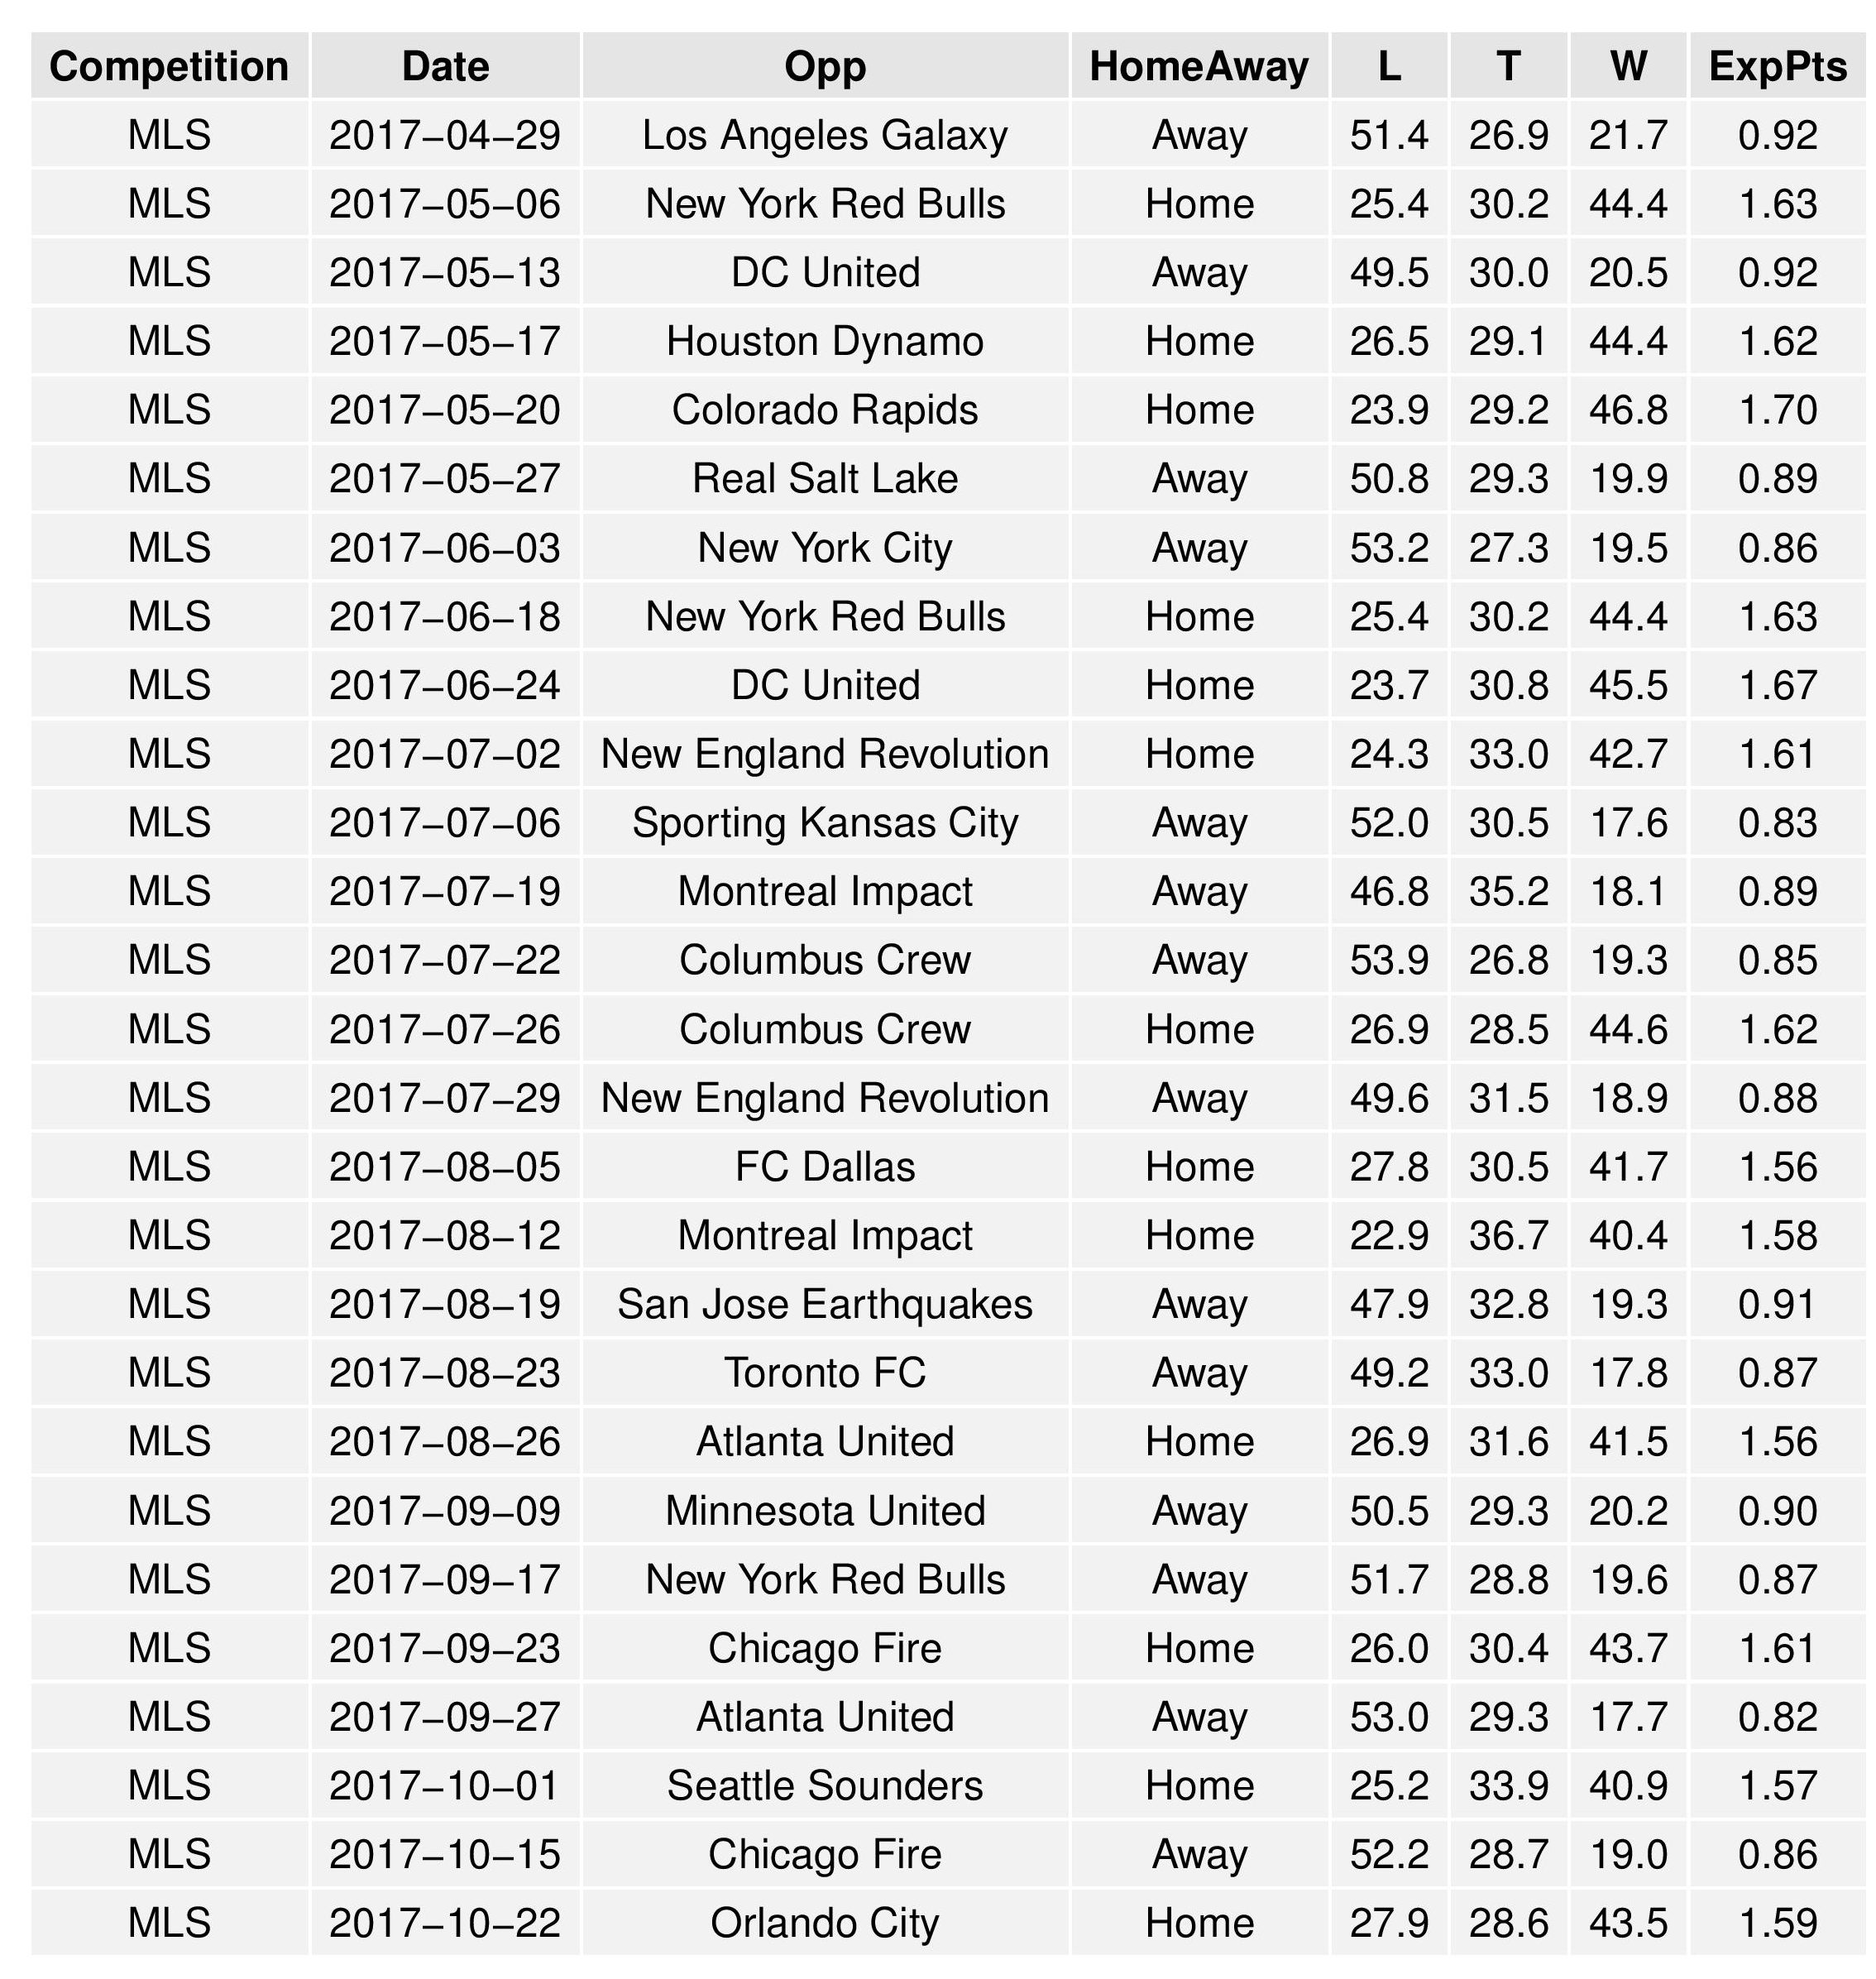
The following shows the expectations for upcoming Philadelphia matches:
Model Validation
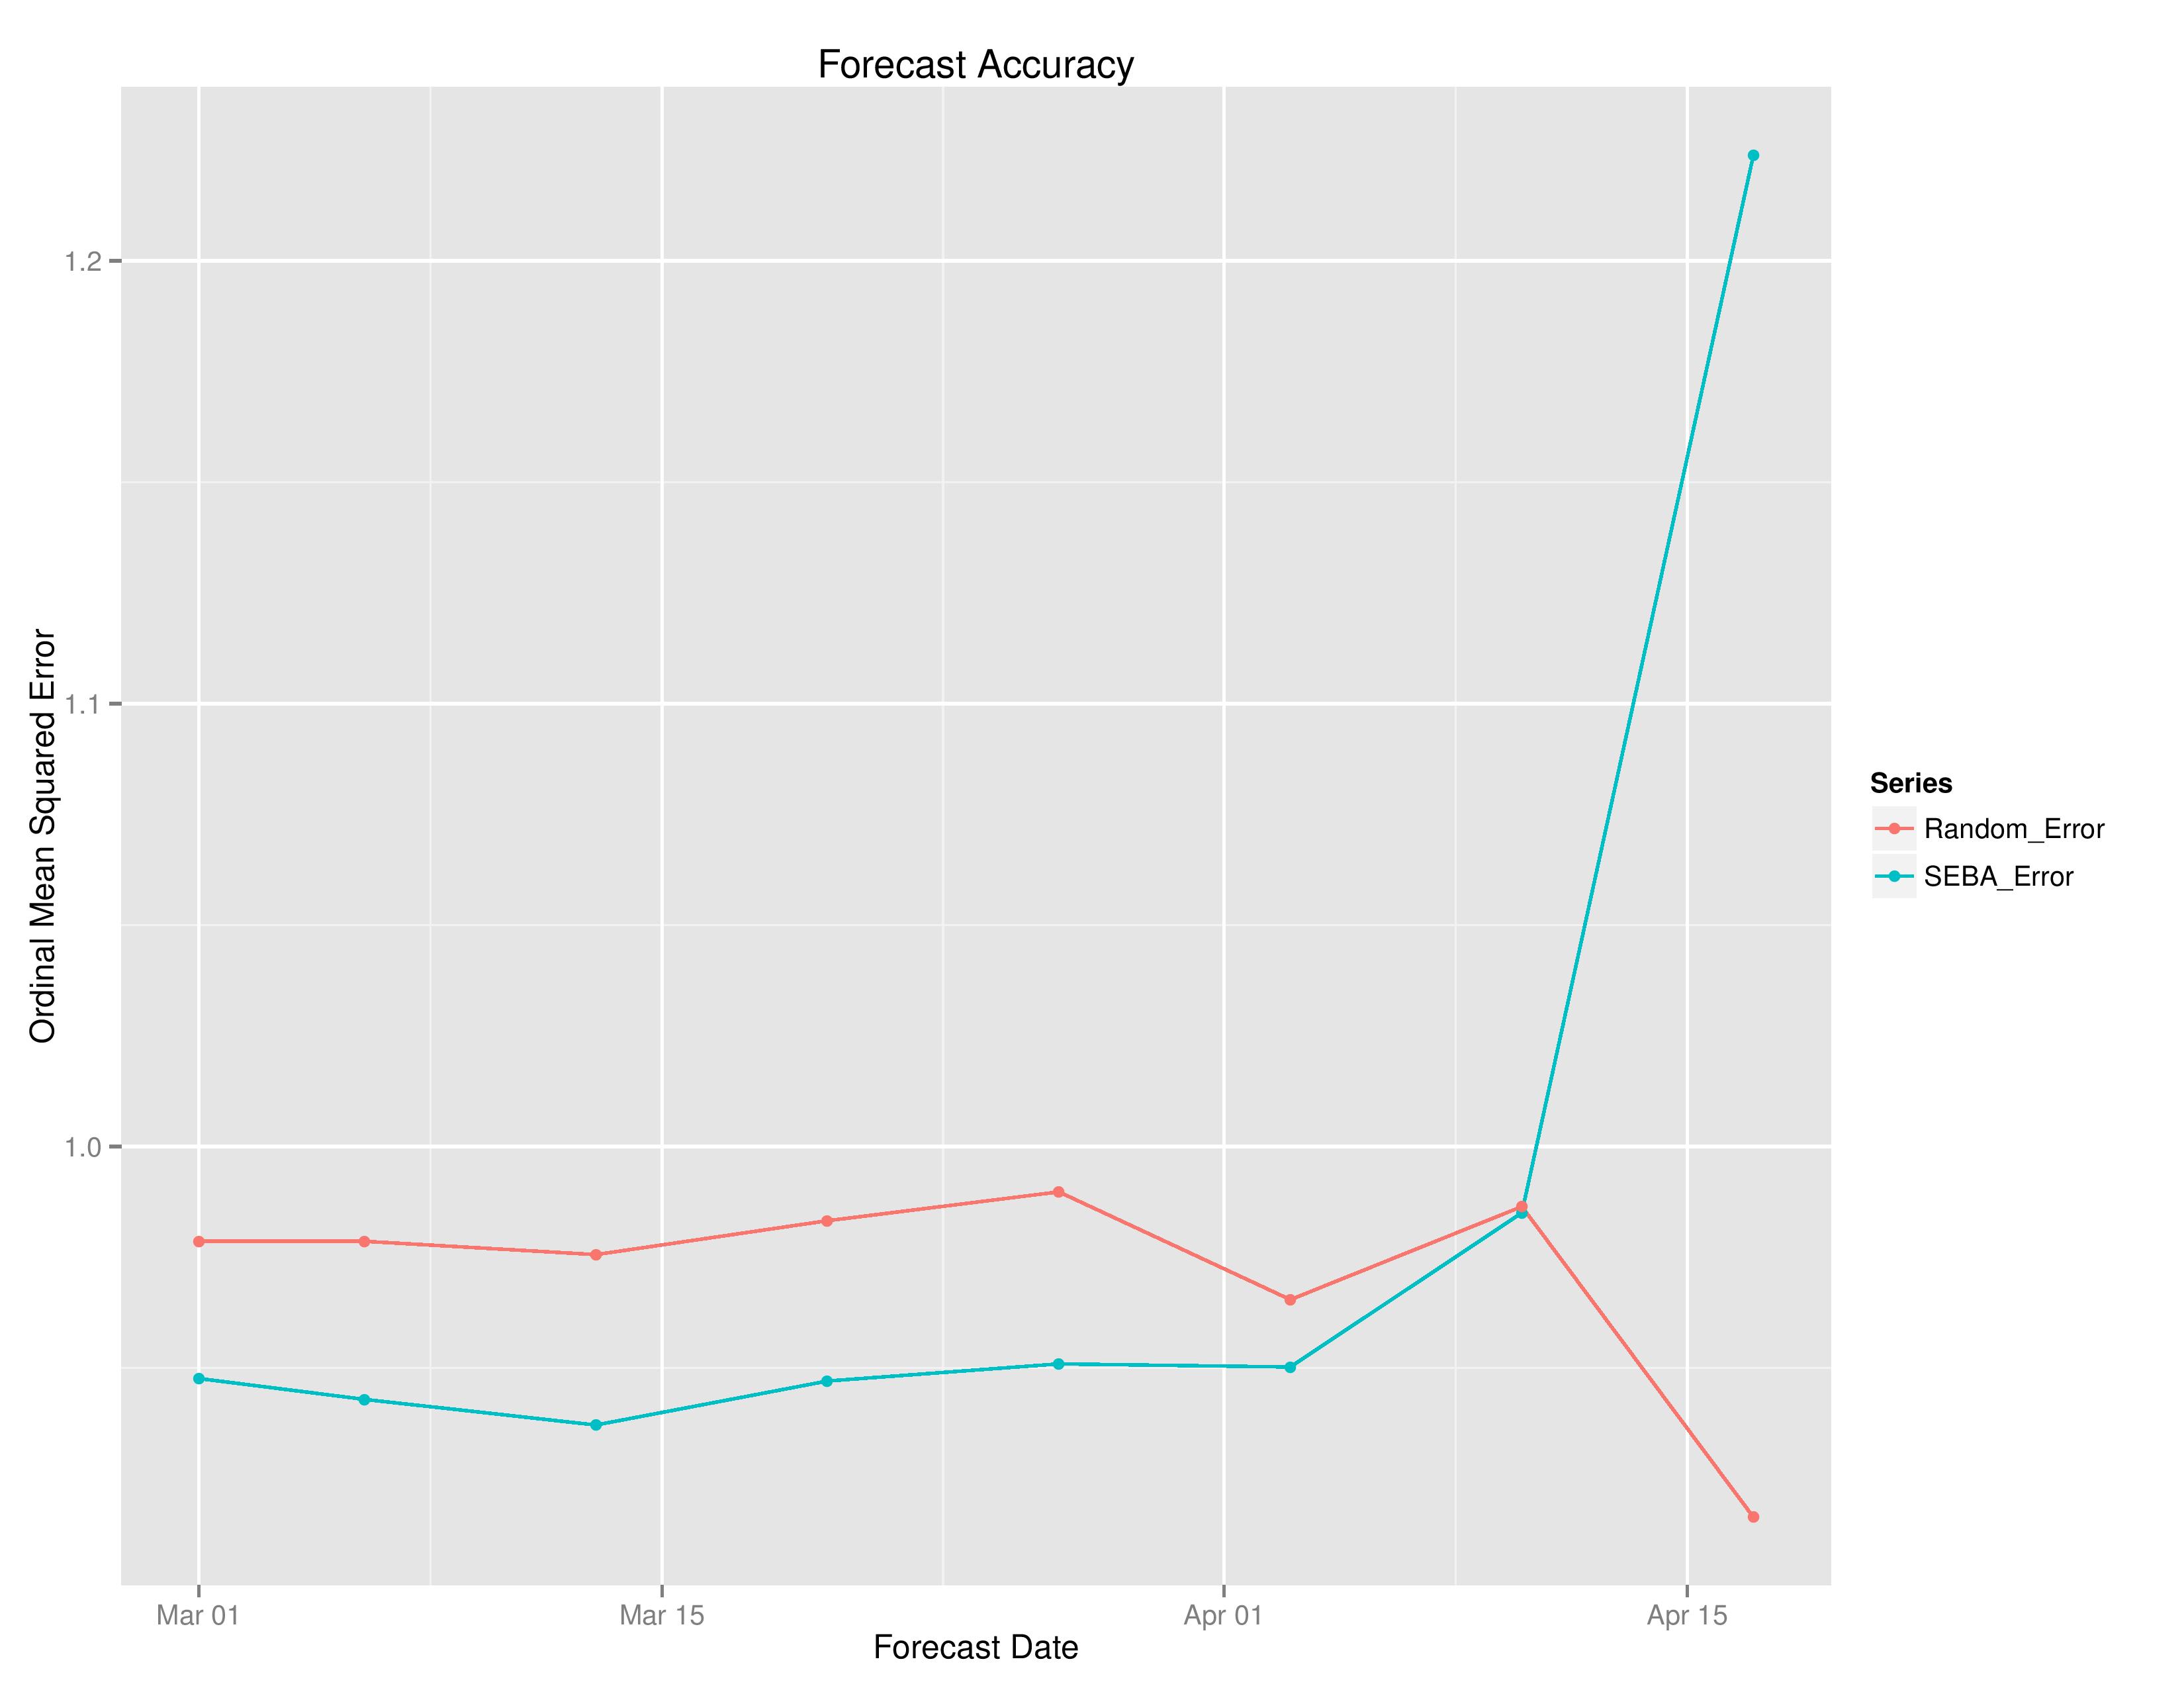
The following shows the degree of error by the model vs the error if the model was purely random without intelligence. The x-axis is based on the date from which the forecast was made (this will update throughout the season as more results are finalized and compared with predictions). The ordinal squared error metric (not a traditional metric) is calculated as:
(ProbW – ActW)^2 + (ProbT – ActT)^2 + (ProbL – ActL)^2 +
((ProbW + ProbT) – (ActW + ActT))^2 +
((ProbL + ProbT) – (ActL + ActT))^2
where Prob[W/T/L] is the model’s probability of resulting outcomes and Act[W/T/L] is a 1 or 0 representation of whether it actually happened.
These data points are not fixed until the end of the season due to additional matches adding to them.

USL
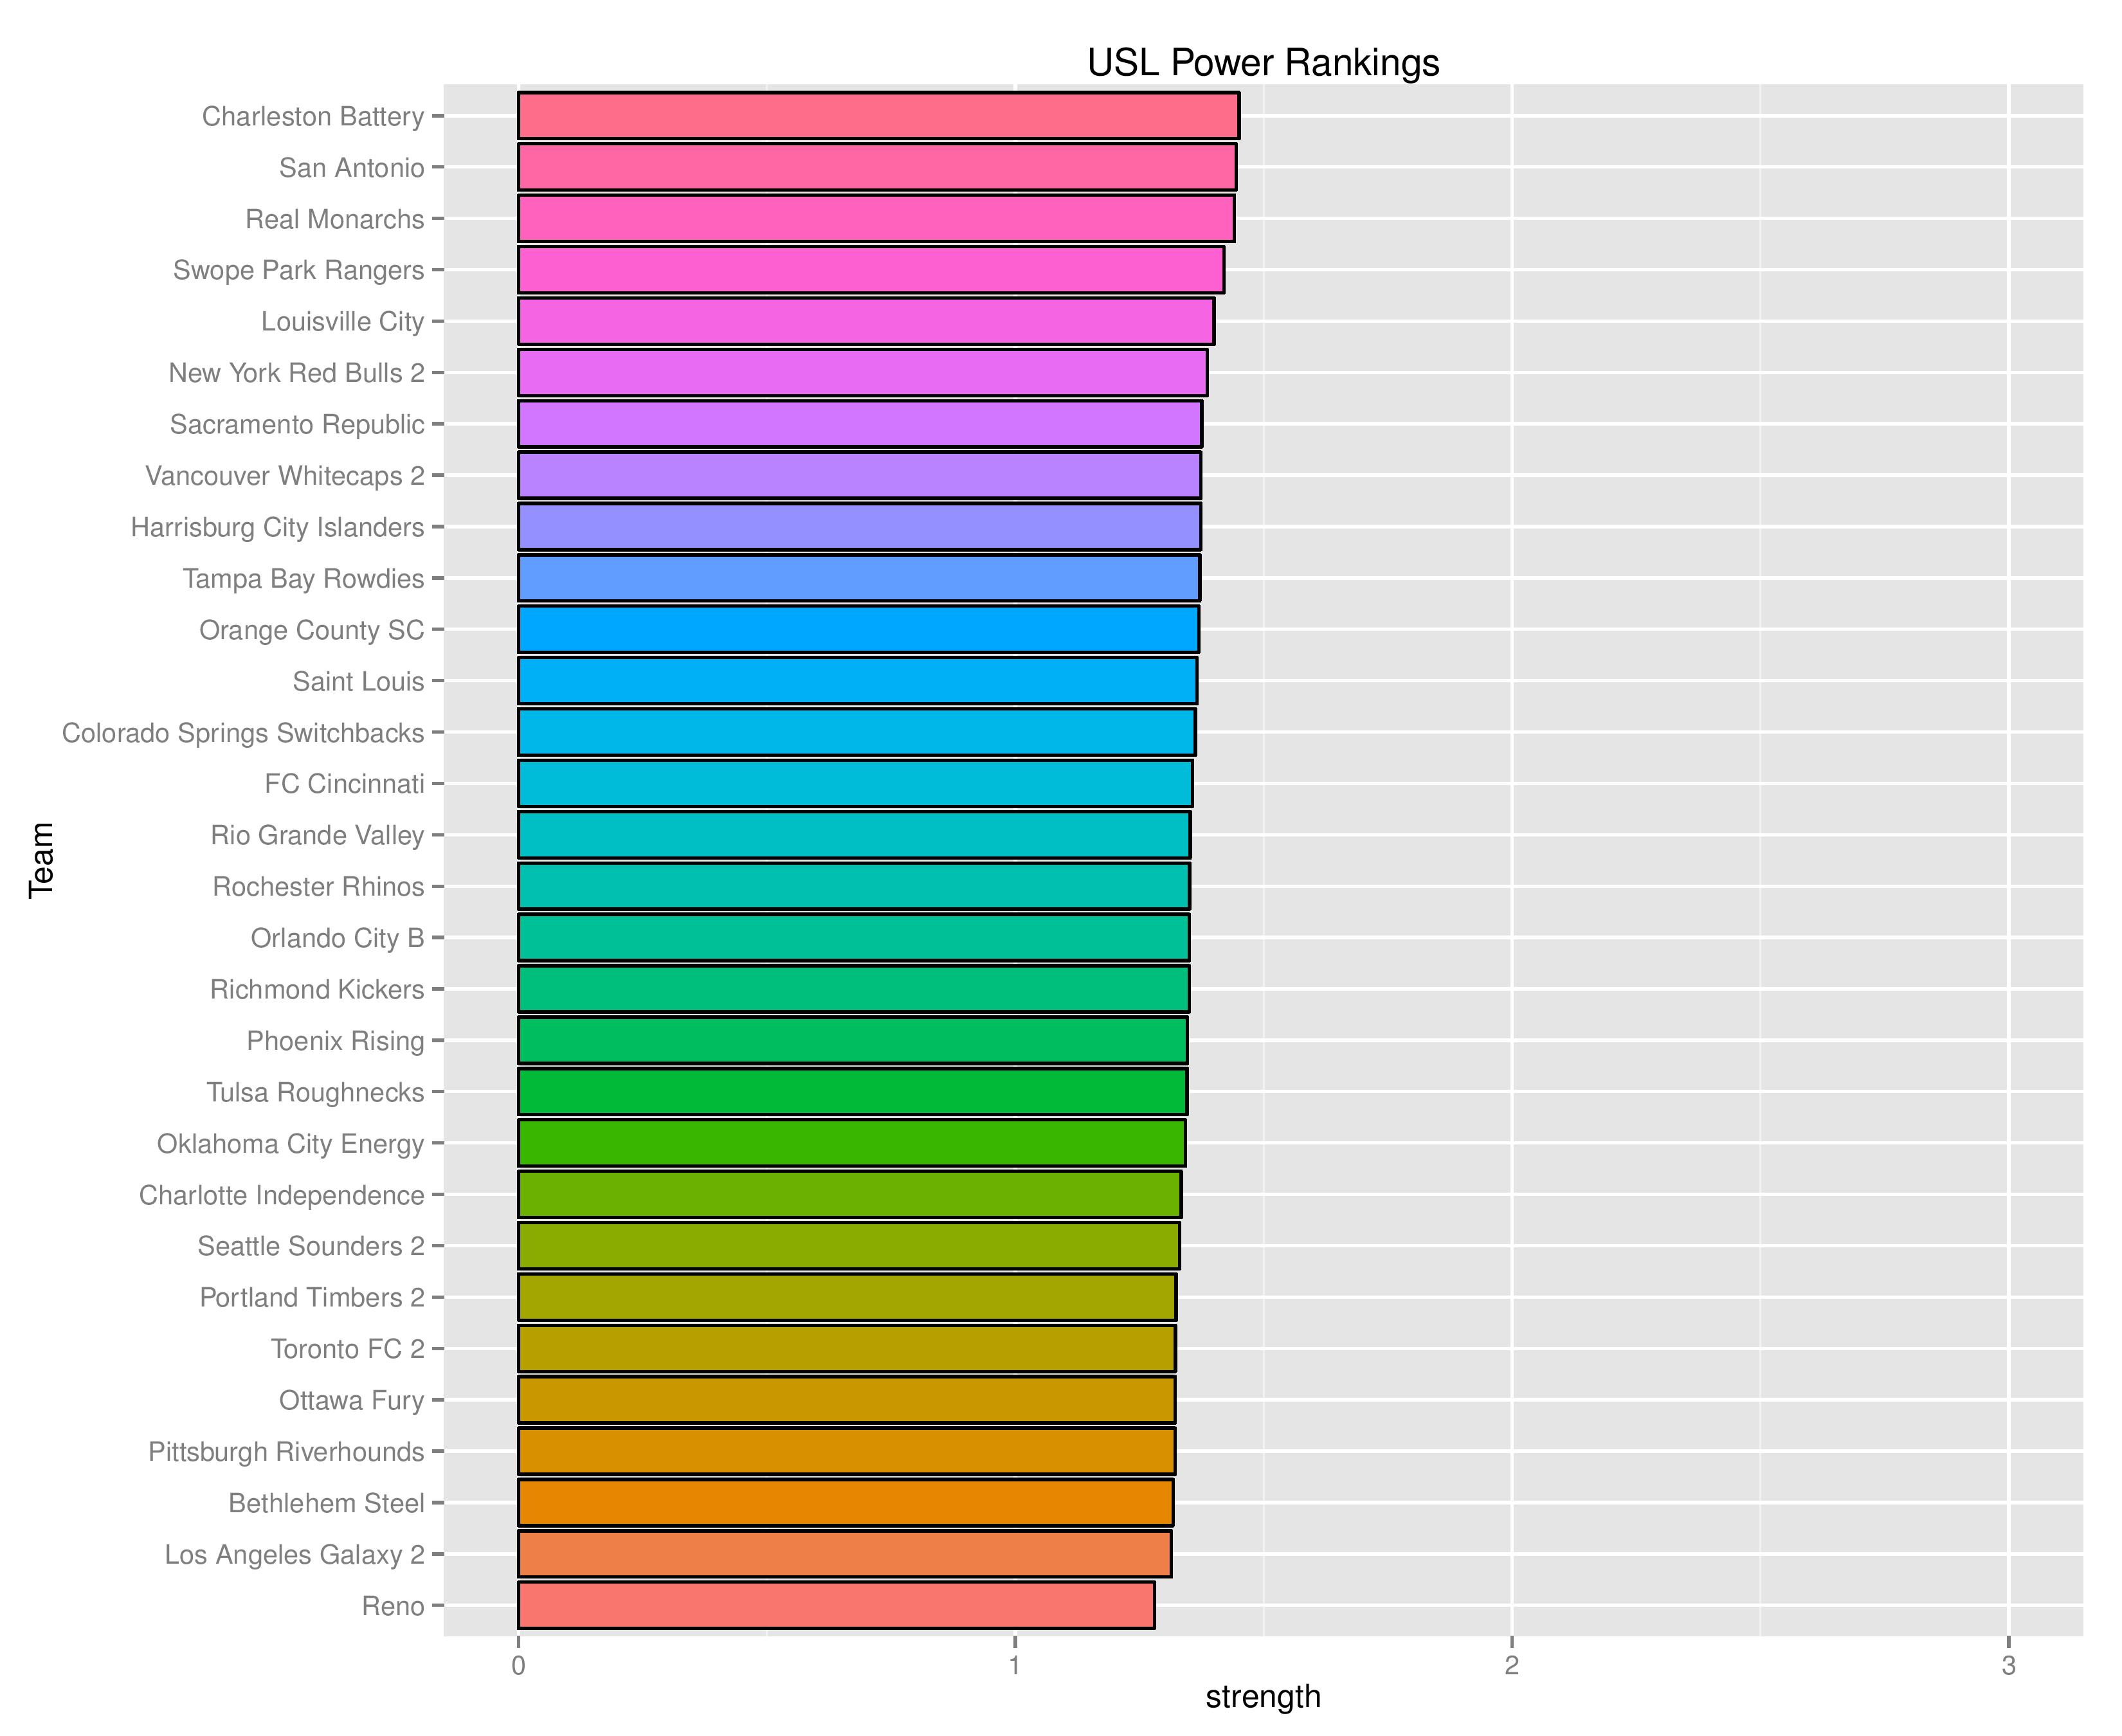
Power Rankings
SEBA has the Bethlehem Steel decreased to 28th from 22nd. It has Harrisburg City moving down to 9th from 8th.
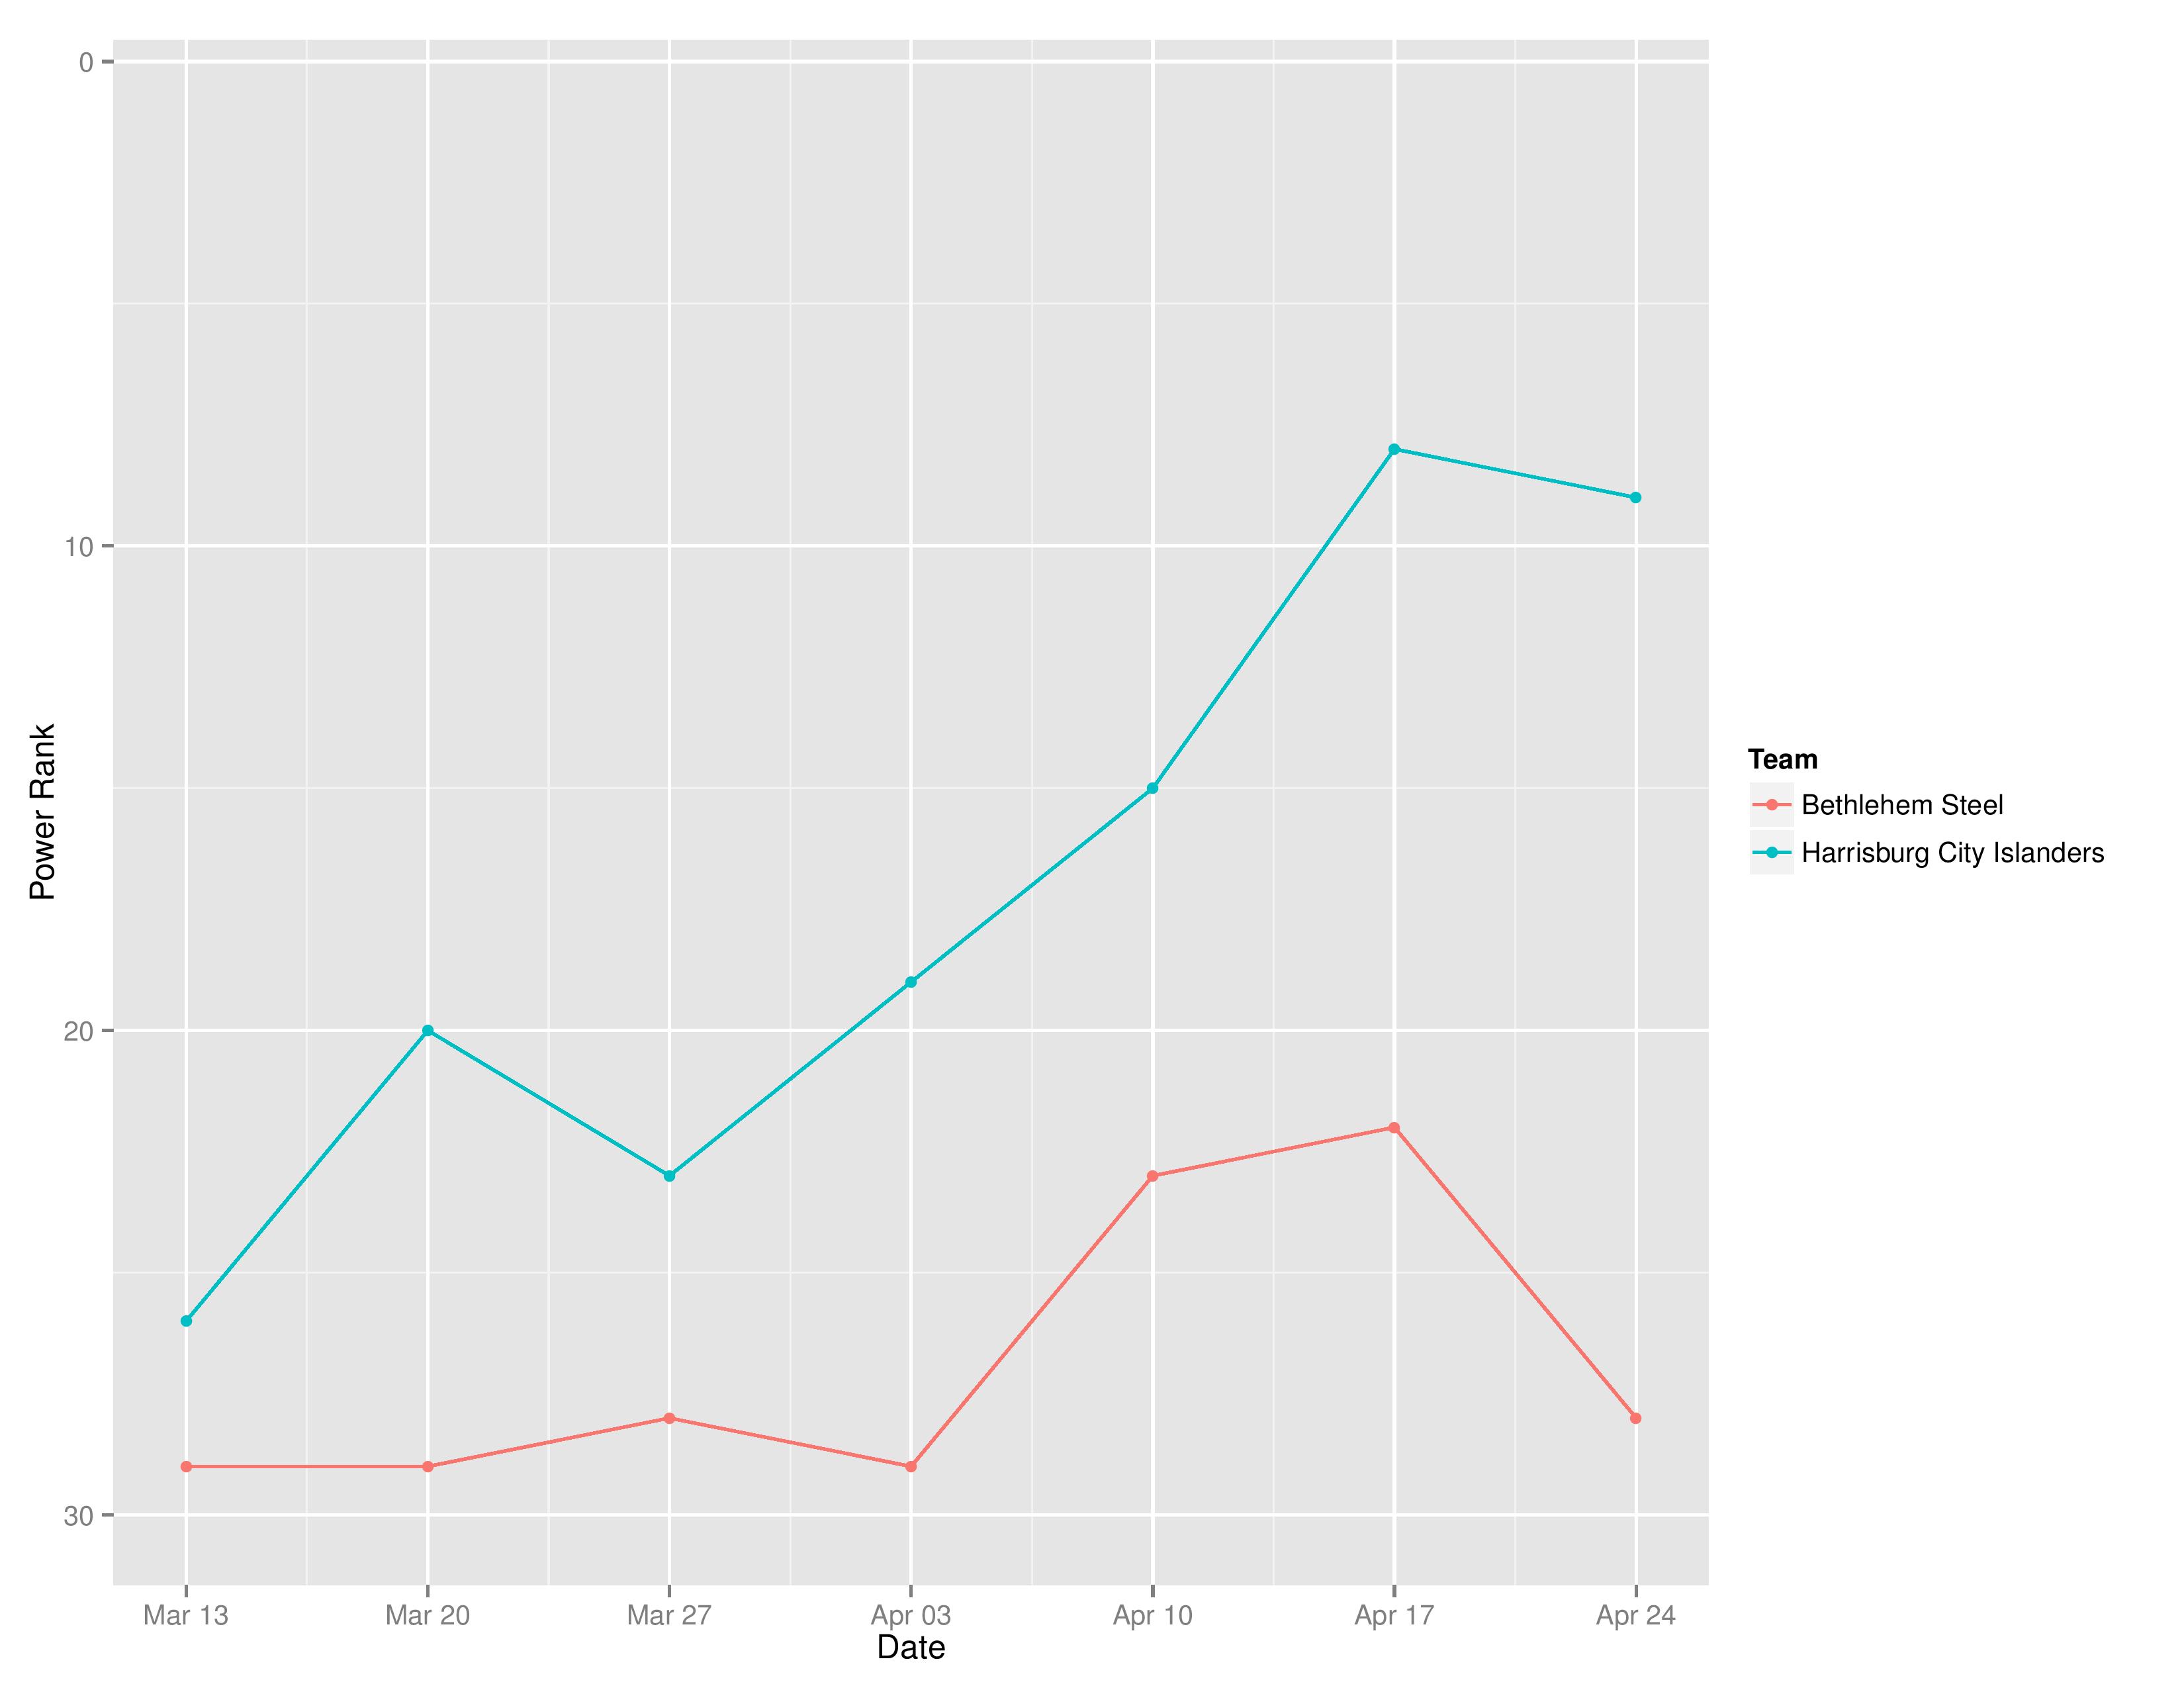
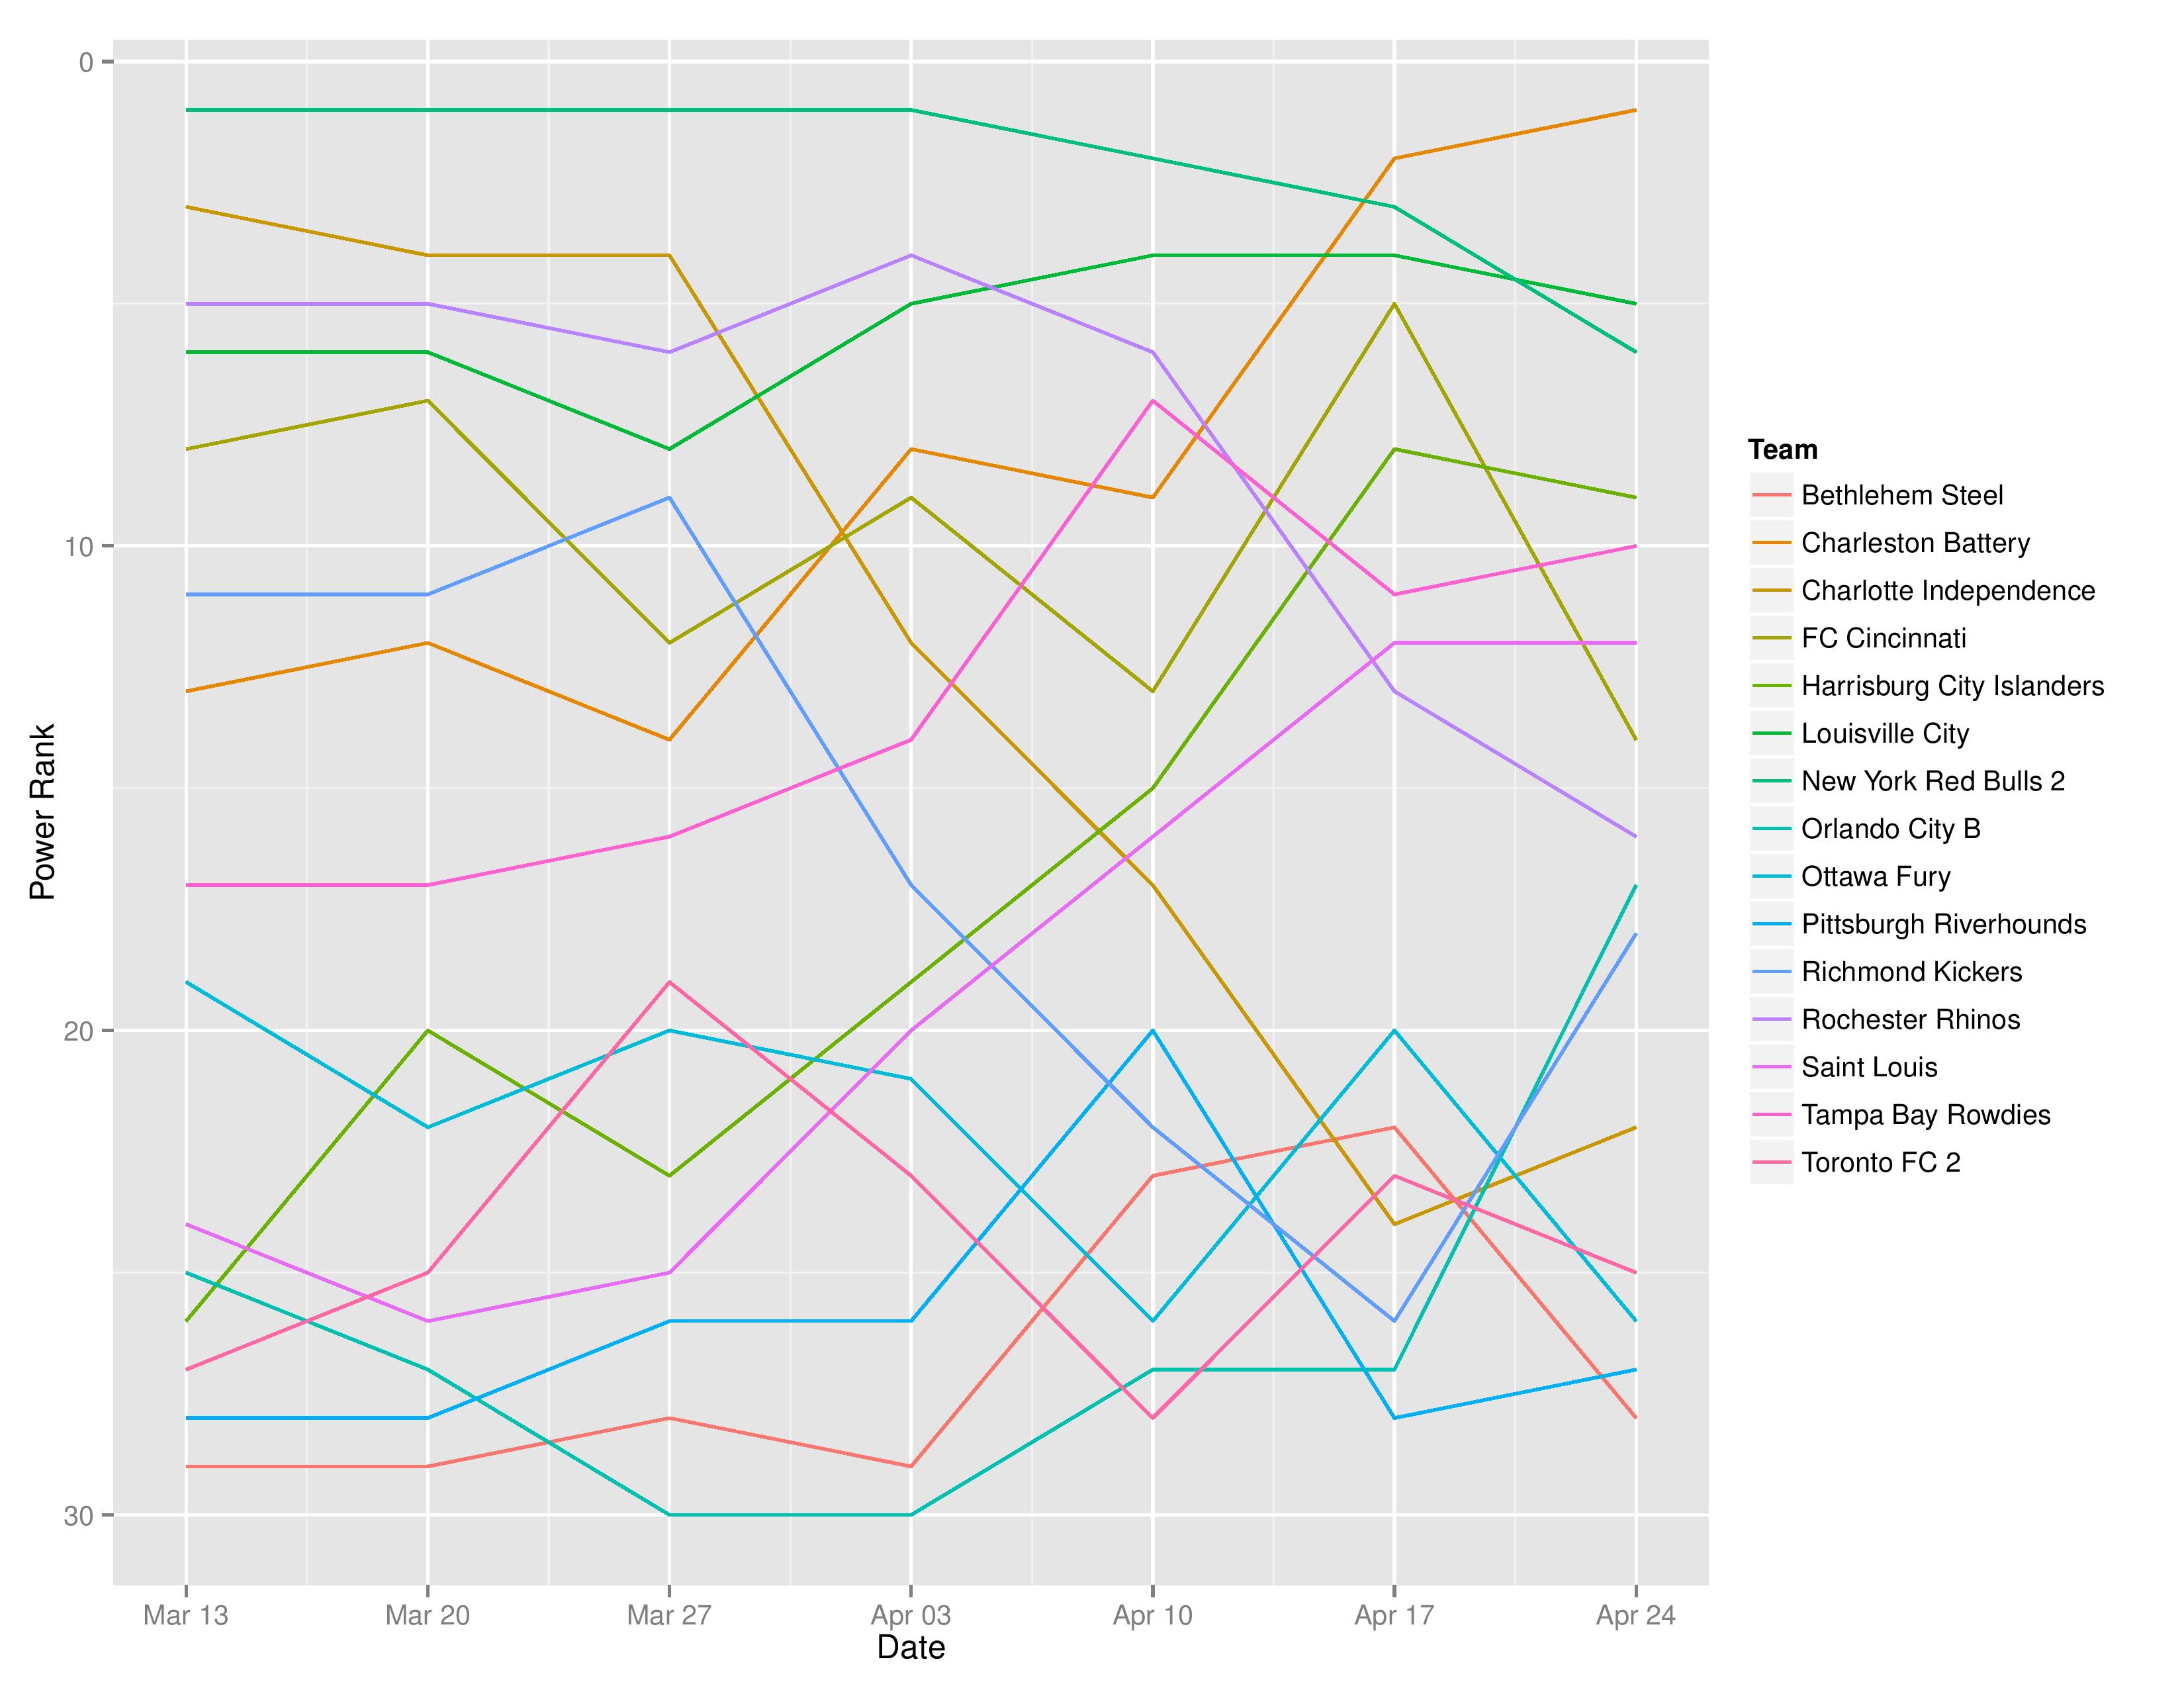
The following shows the evolution of SEBA’s power rankings for the USL East over time.
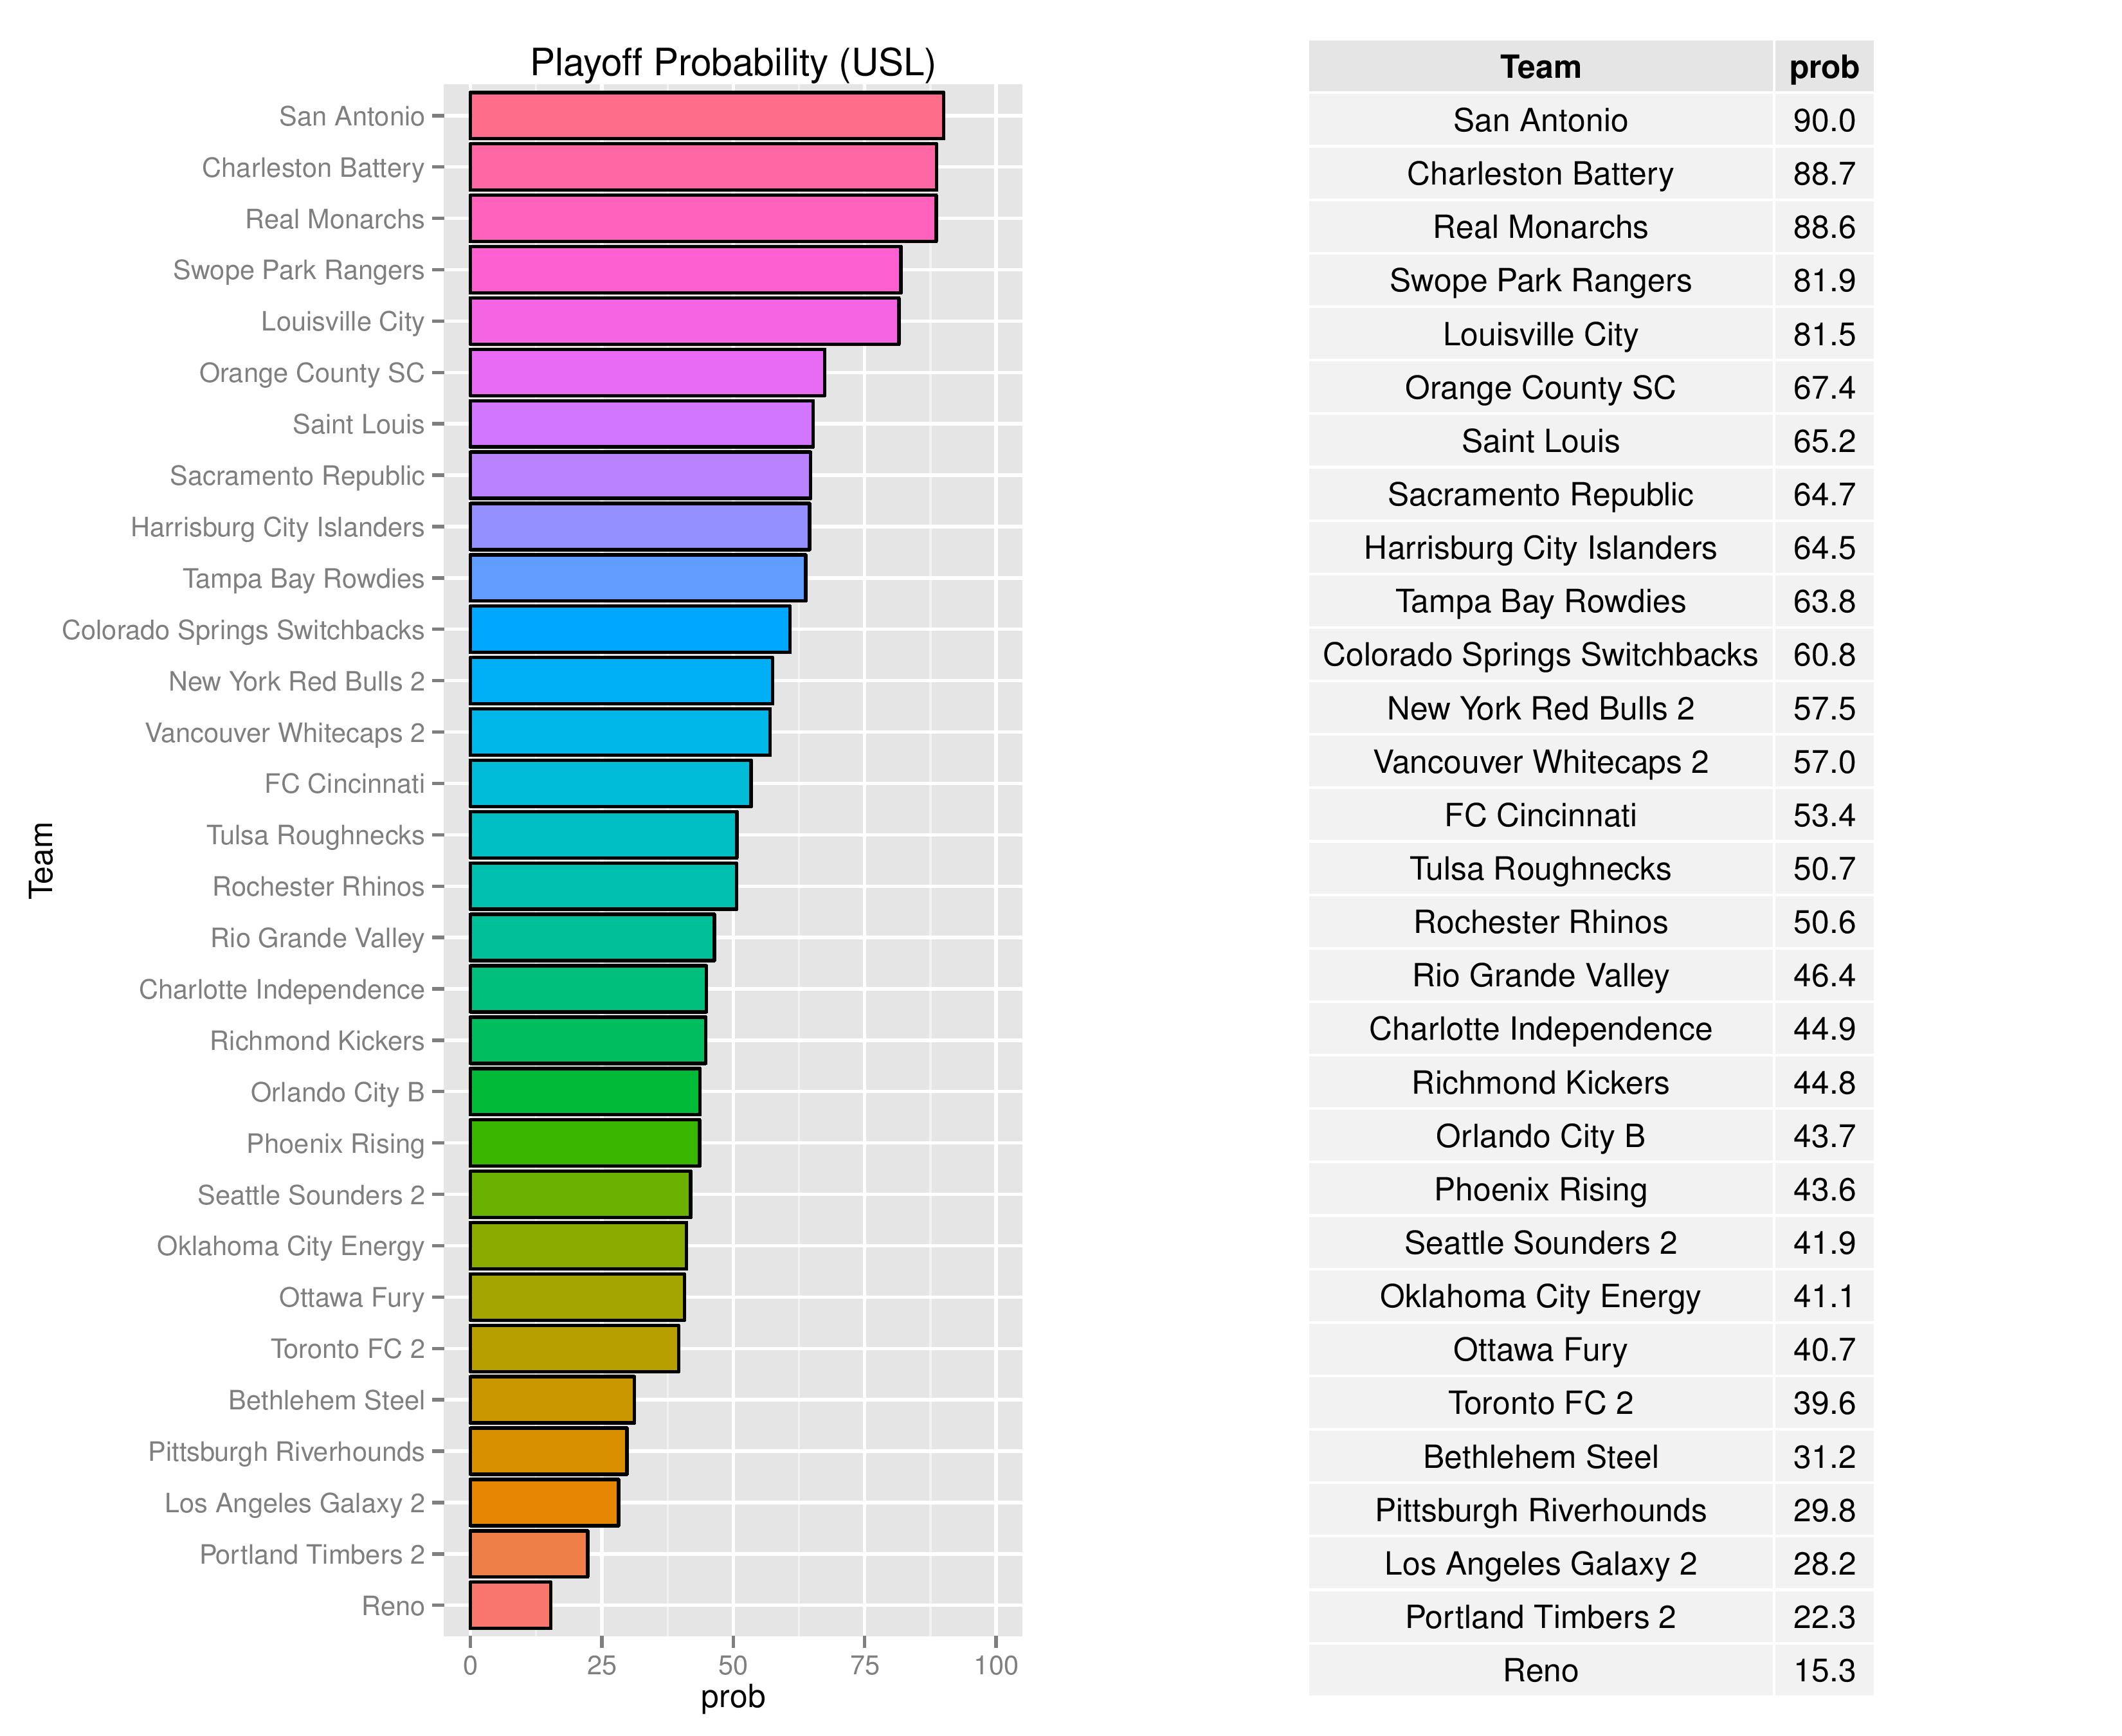
Playoffs probability and more
Bethlehem’s playoff odds increased from 30.7% to 31.2% and Harrisburg City’s odds decreased from 76.6% to 64.5% in making the playoffs.
Bethlehem’s chances at winning the Regular Season Title increased to 0.4% from 0.2% while Harrisburg City decreased from 3.3% to 2.9%.

Bethlehem’s odds at becoming the USL Champion increased from 0.6% to 1.3% while Harrisburg City’s remained at 4.2%:

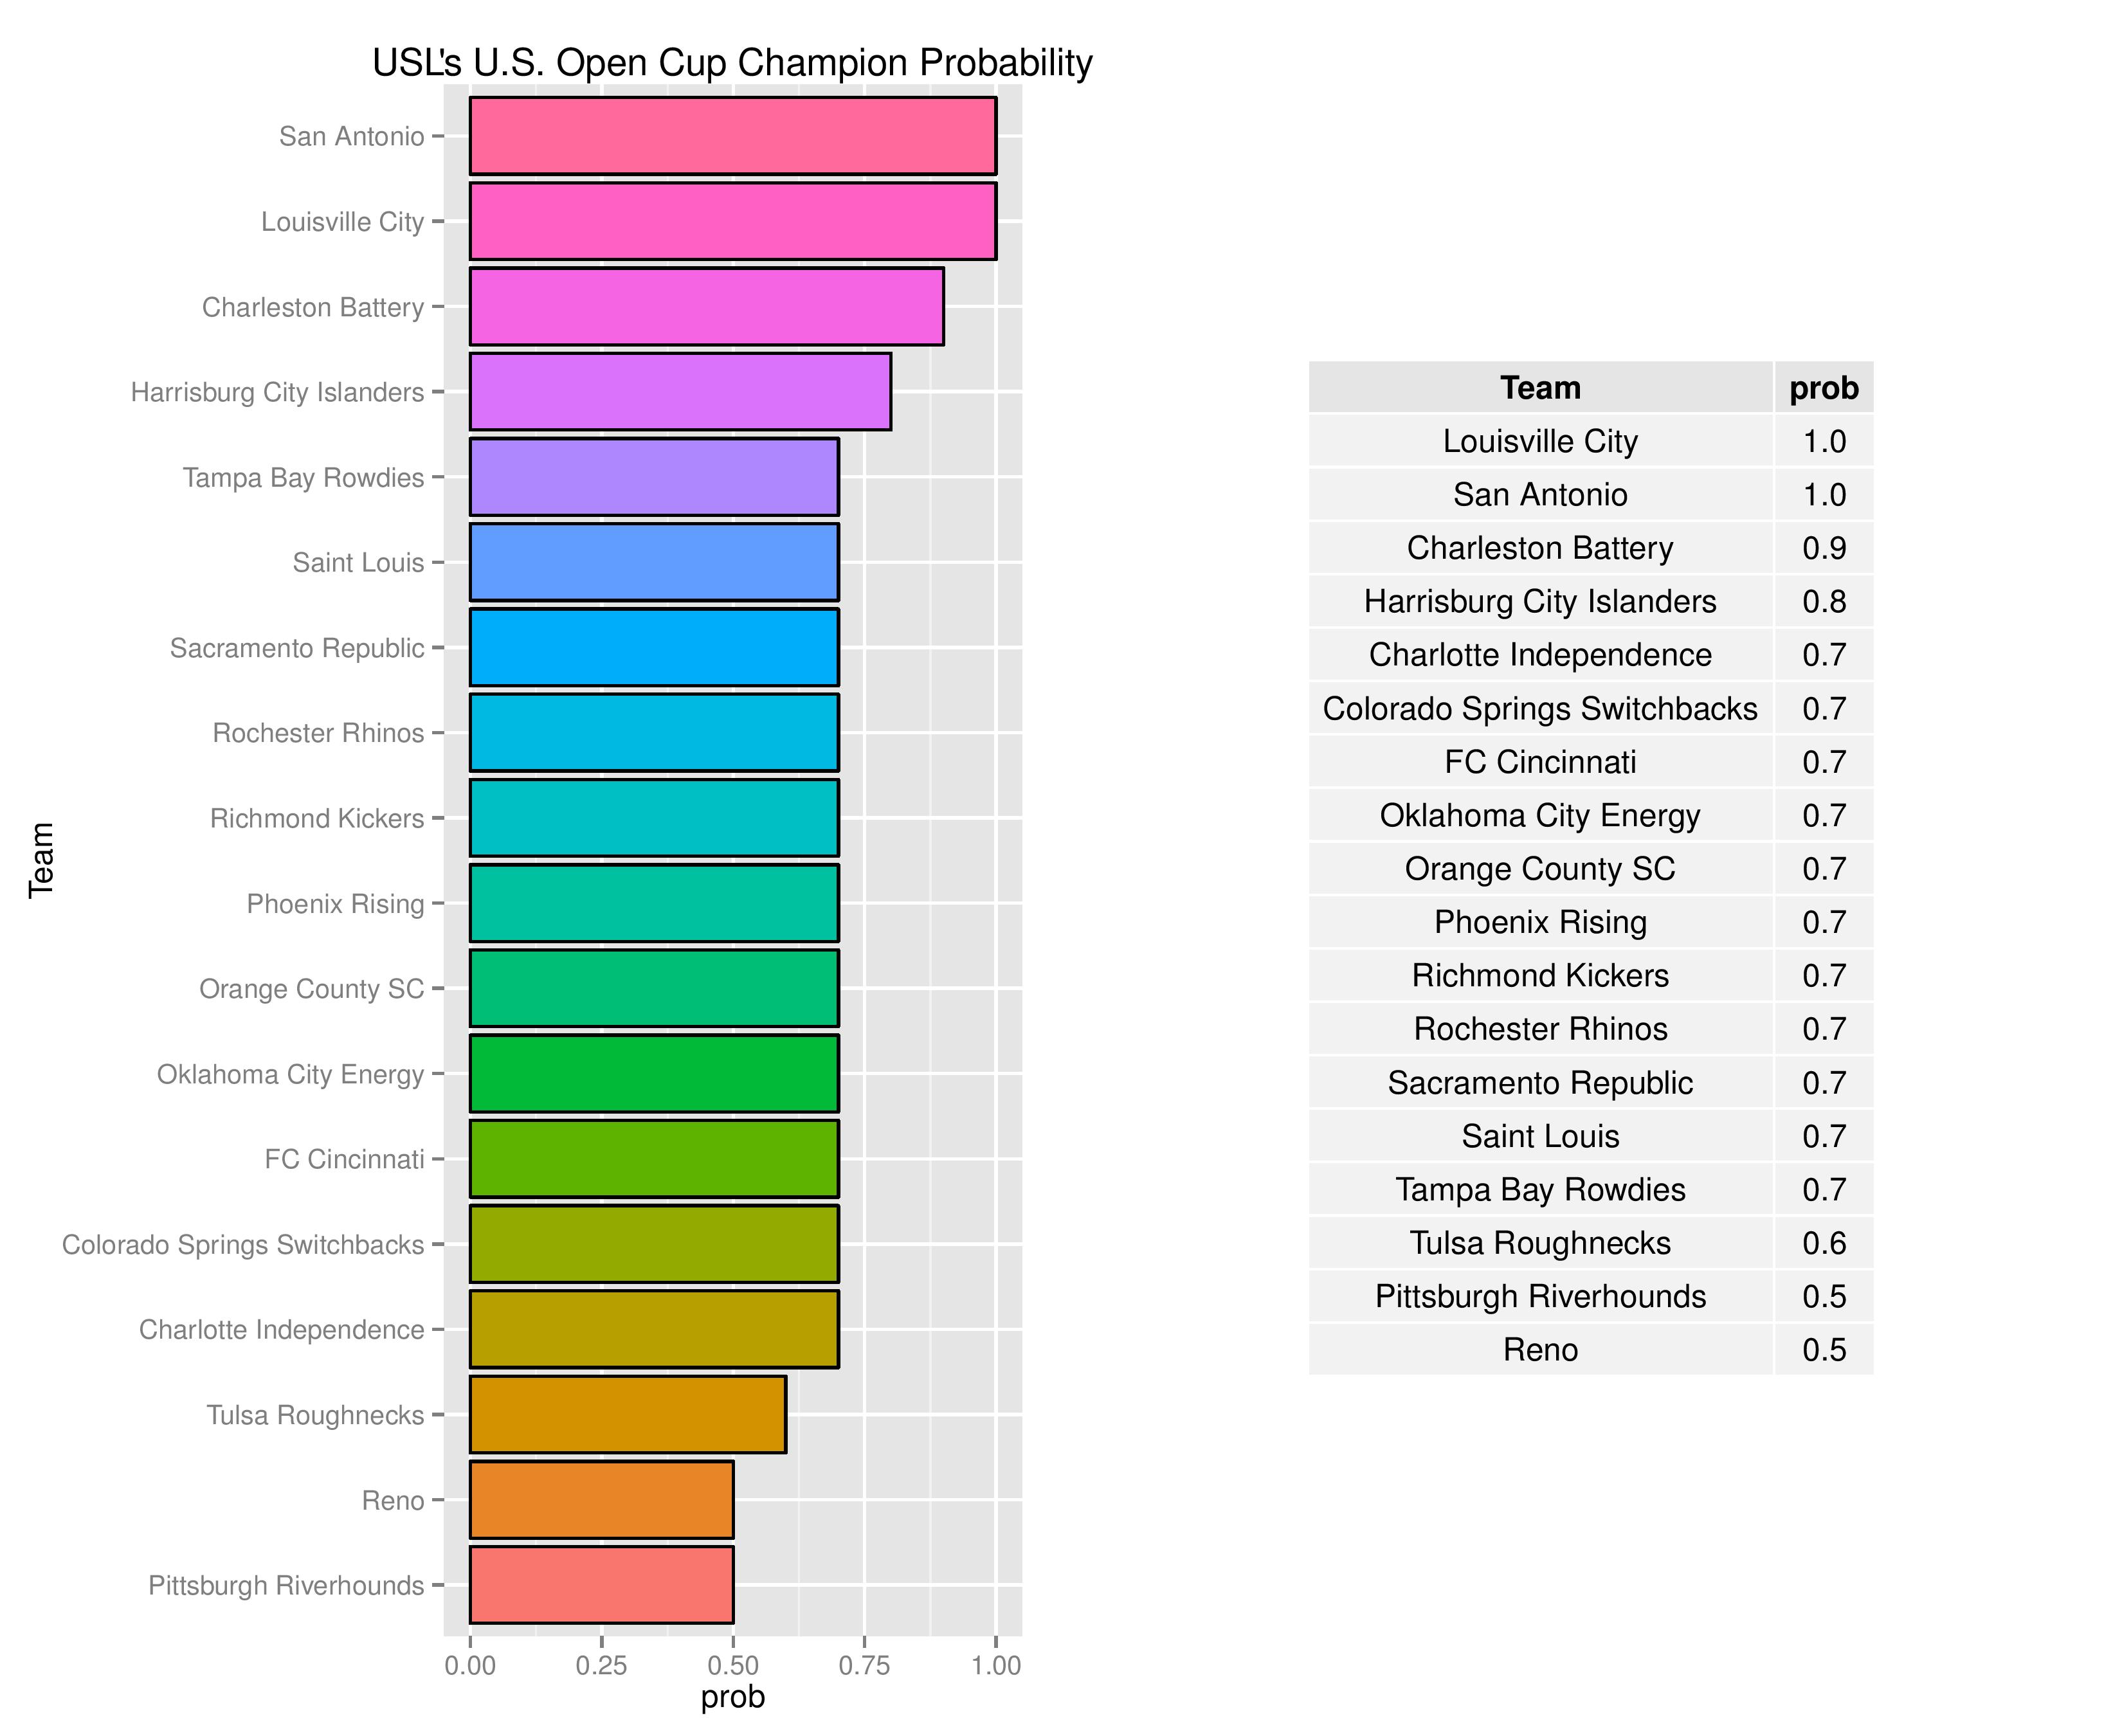
The USOC odds for USL clubs alone are as follows. Harrisburg increased to 0.8% odds from 0.4%.
Over time, we can see how the odds for different prizes change for Bethlehem and Harrisburg.


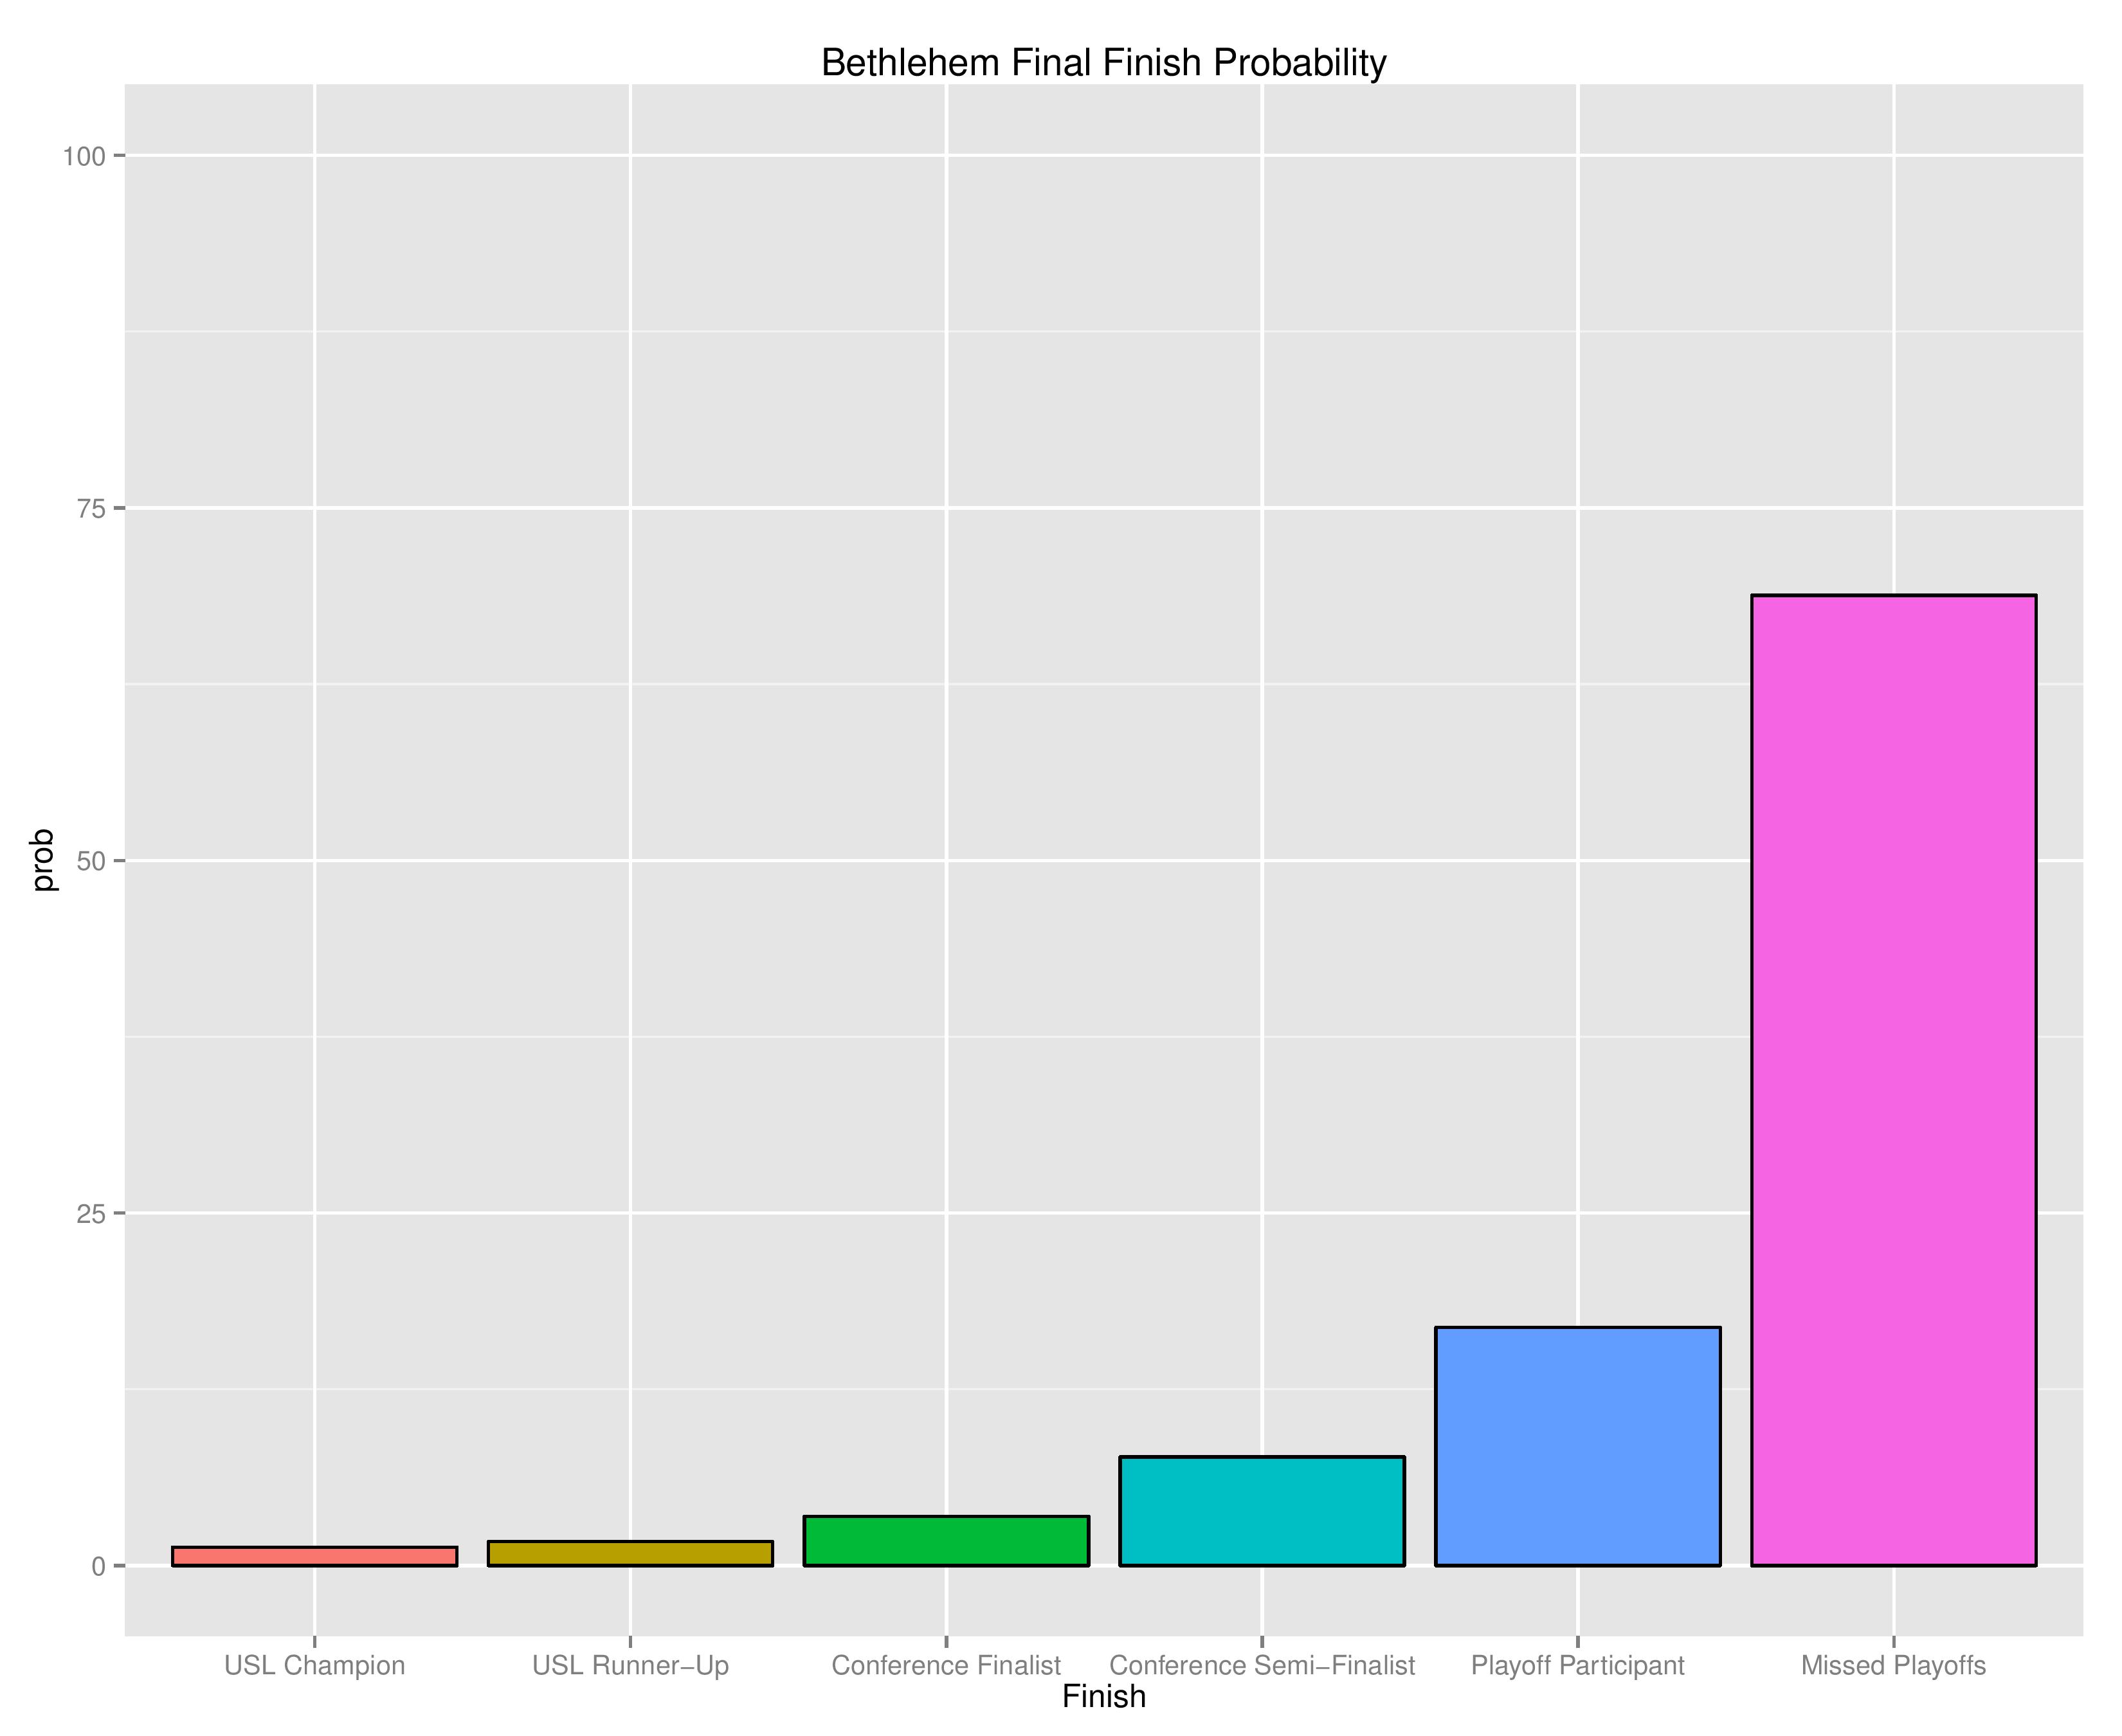
The following are probabilities for each category of outcomes for Bethlehem.
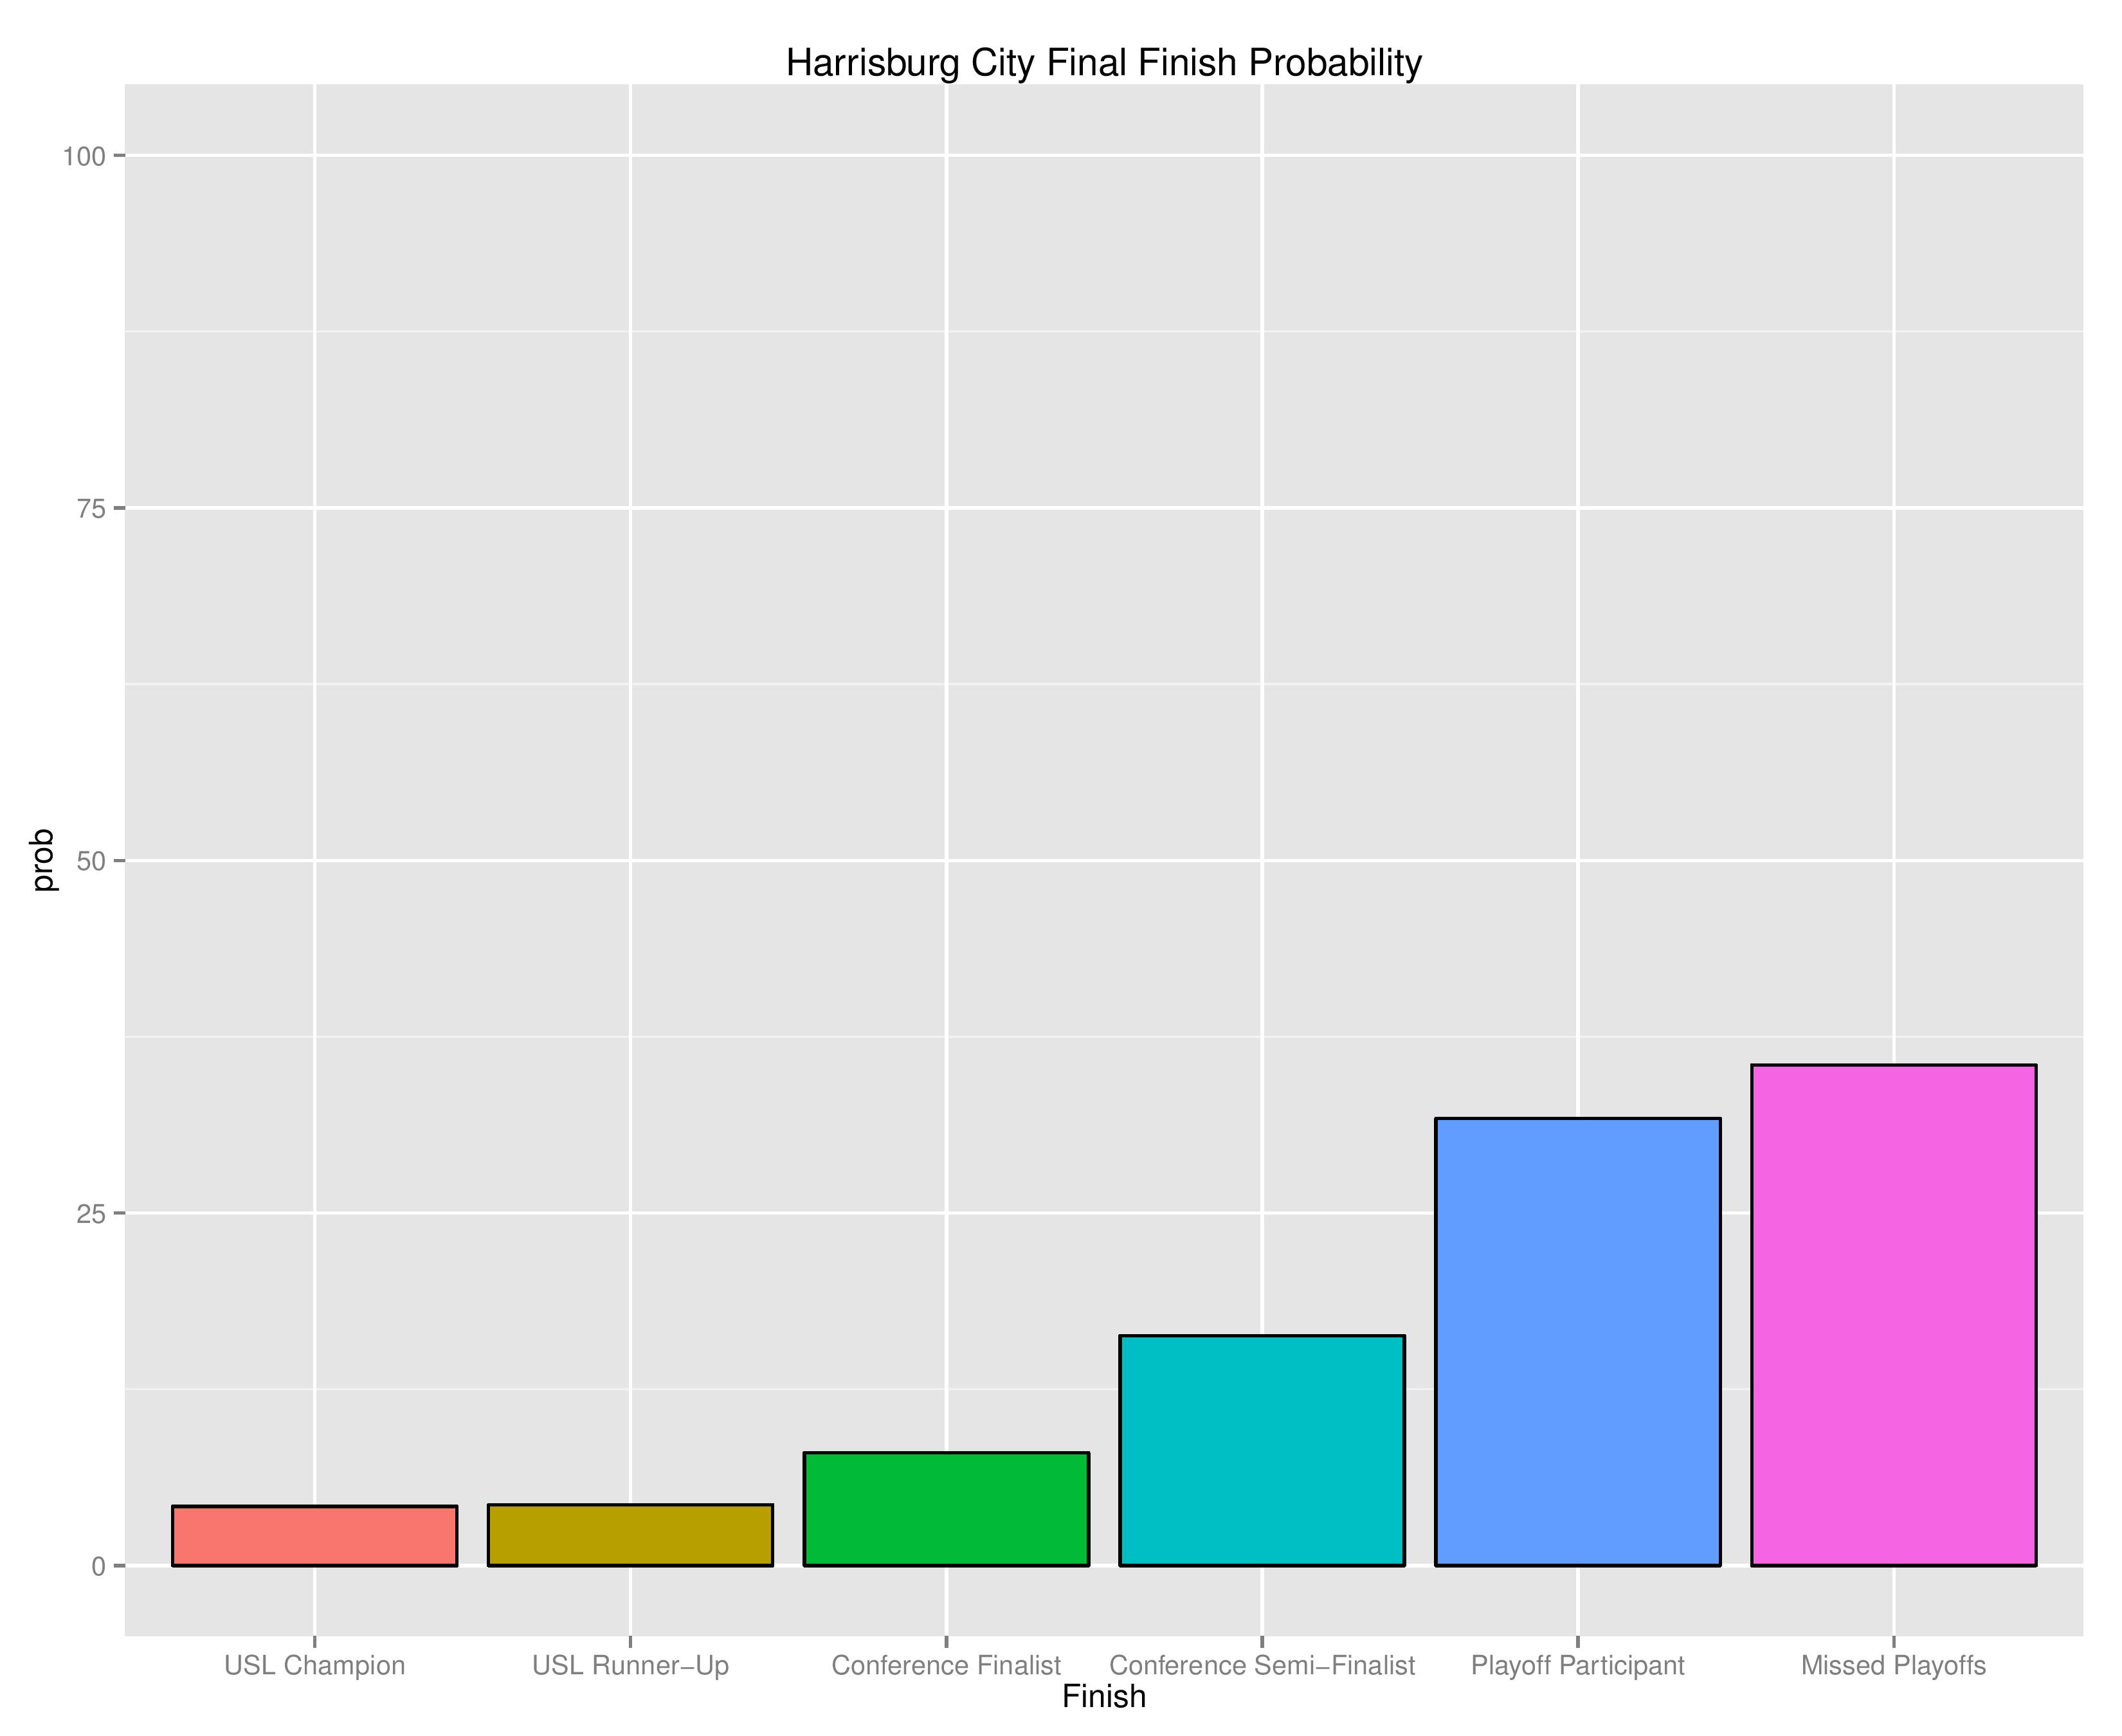
The following are probabilities for each category of outcomes for Harrisburg City.
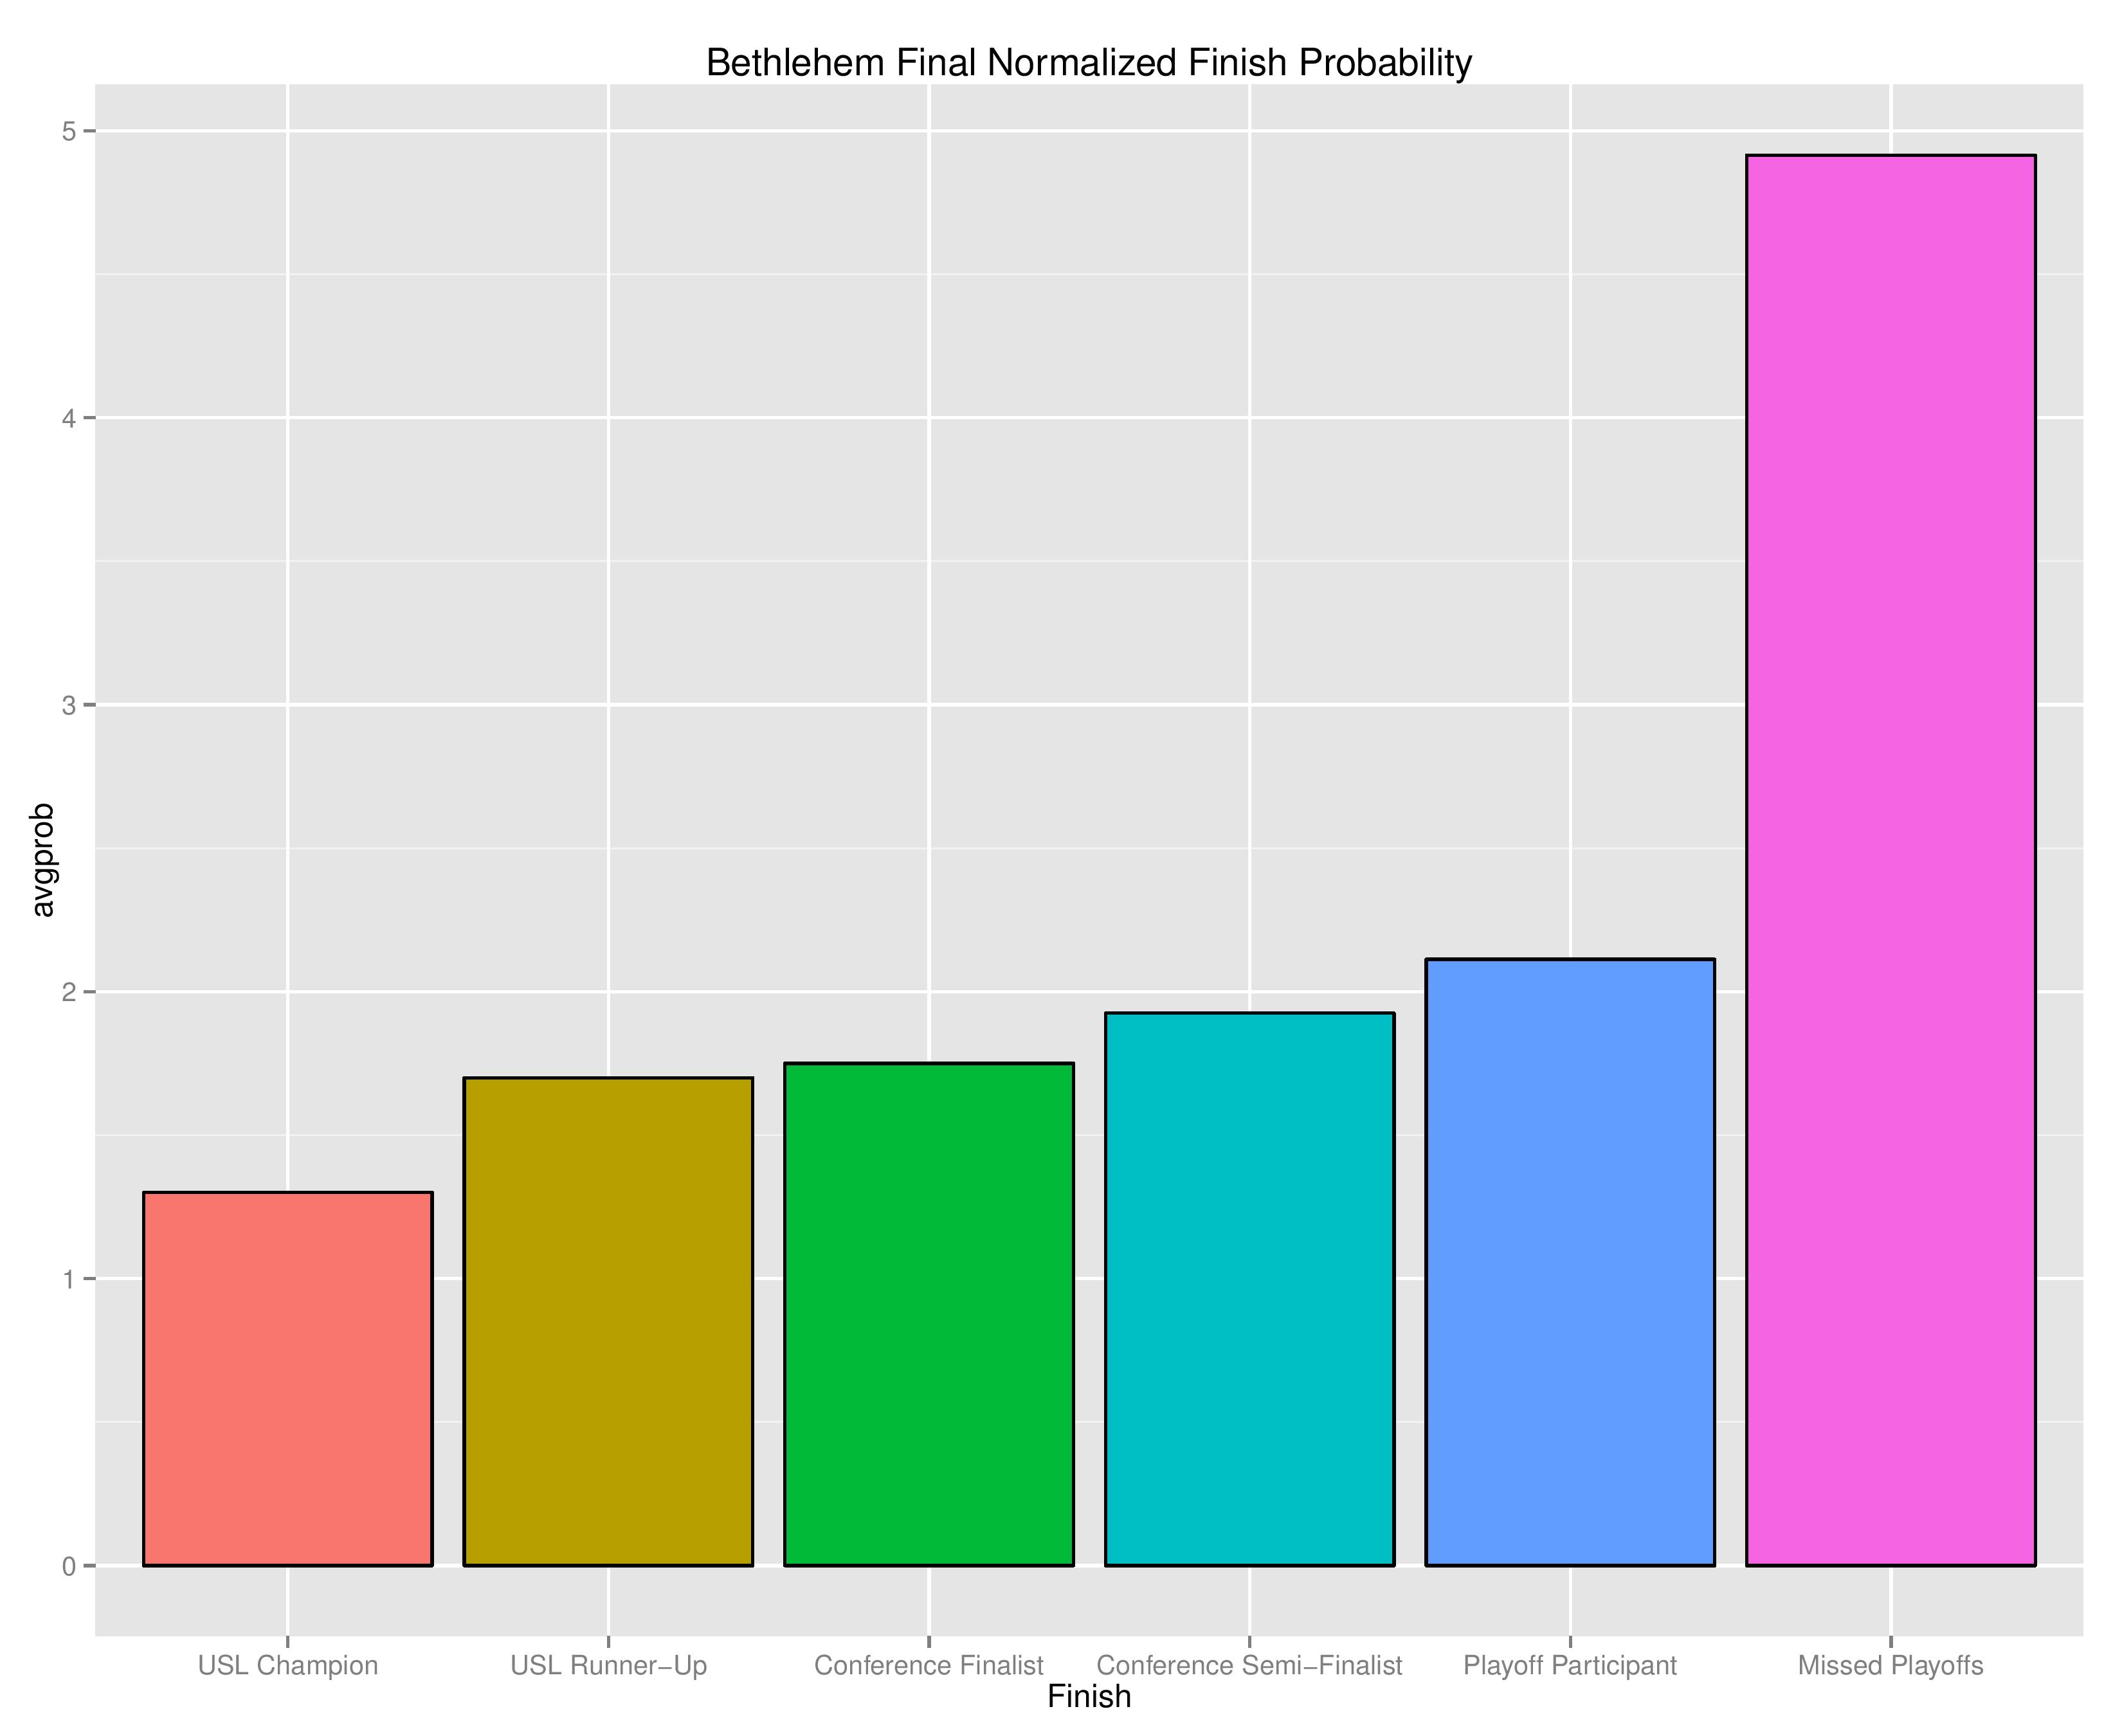
The following shows the relative probability of the prior categories. If the projection system were entirely random, these bars would be even, despite that “Missed Playoffs” is inherently 14 times more likely than “USL Champion.” The chart outlines where the club is headed. We begin with Bethlehem Steel.

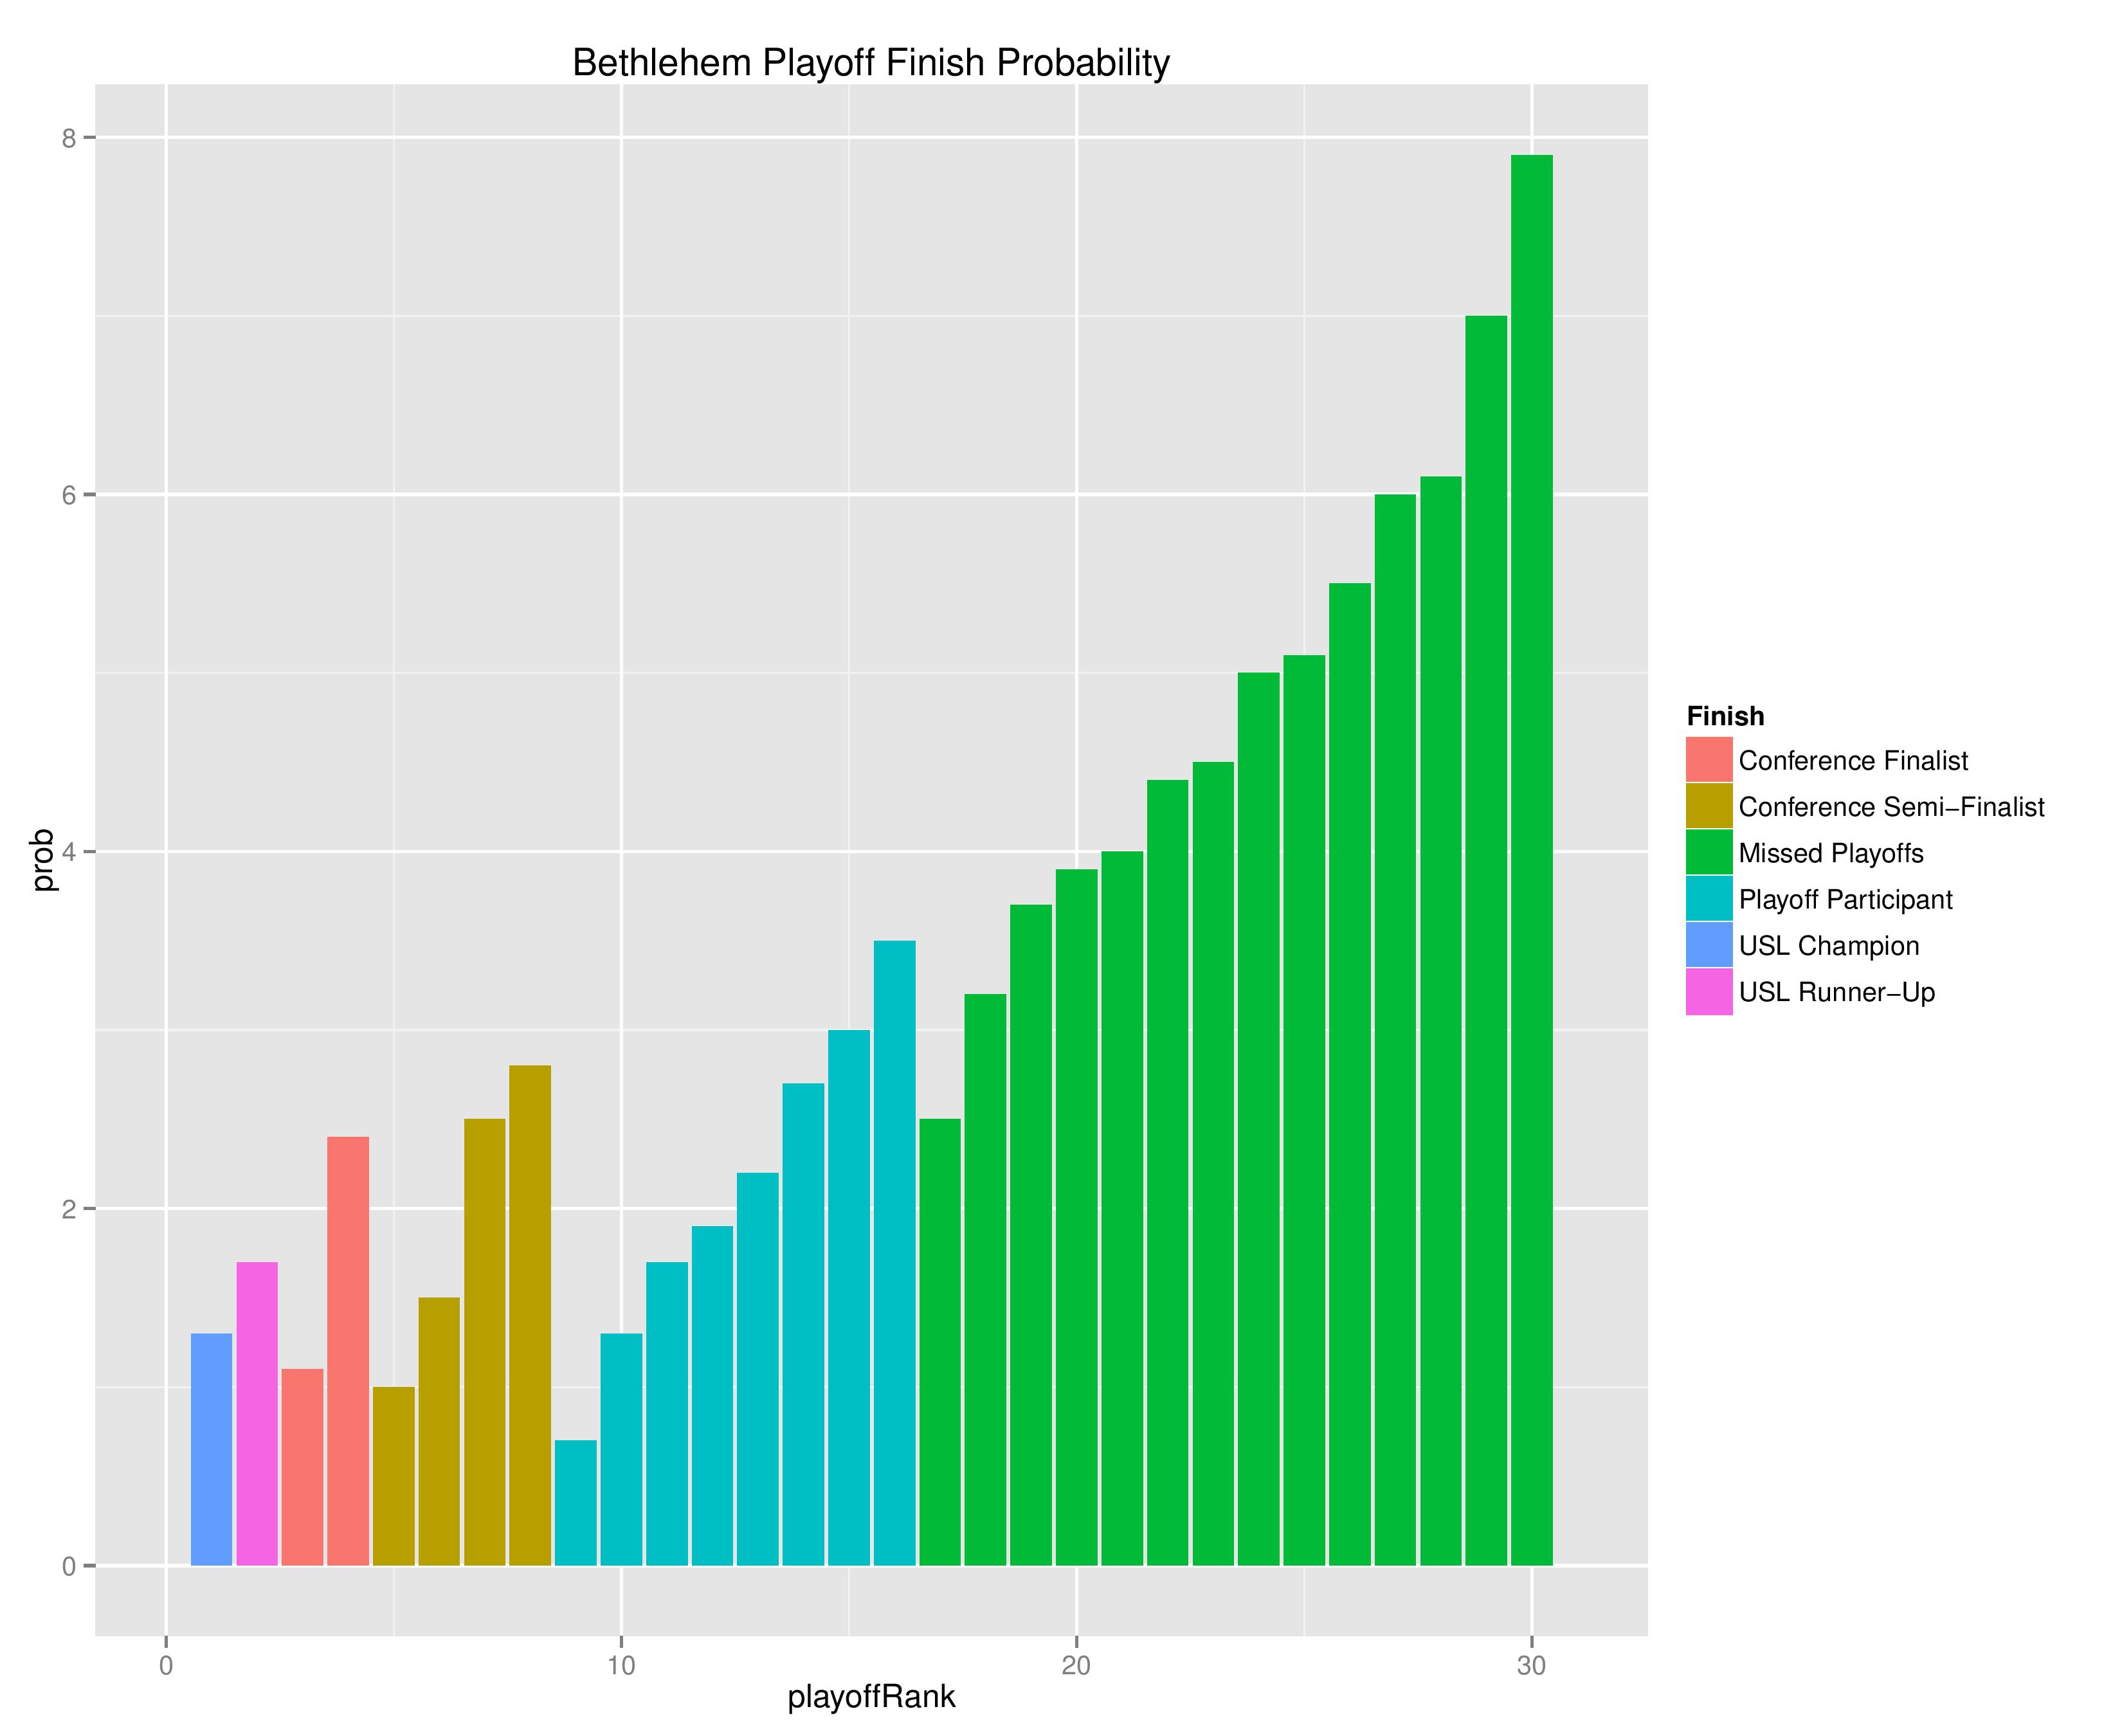
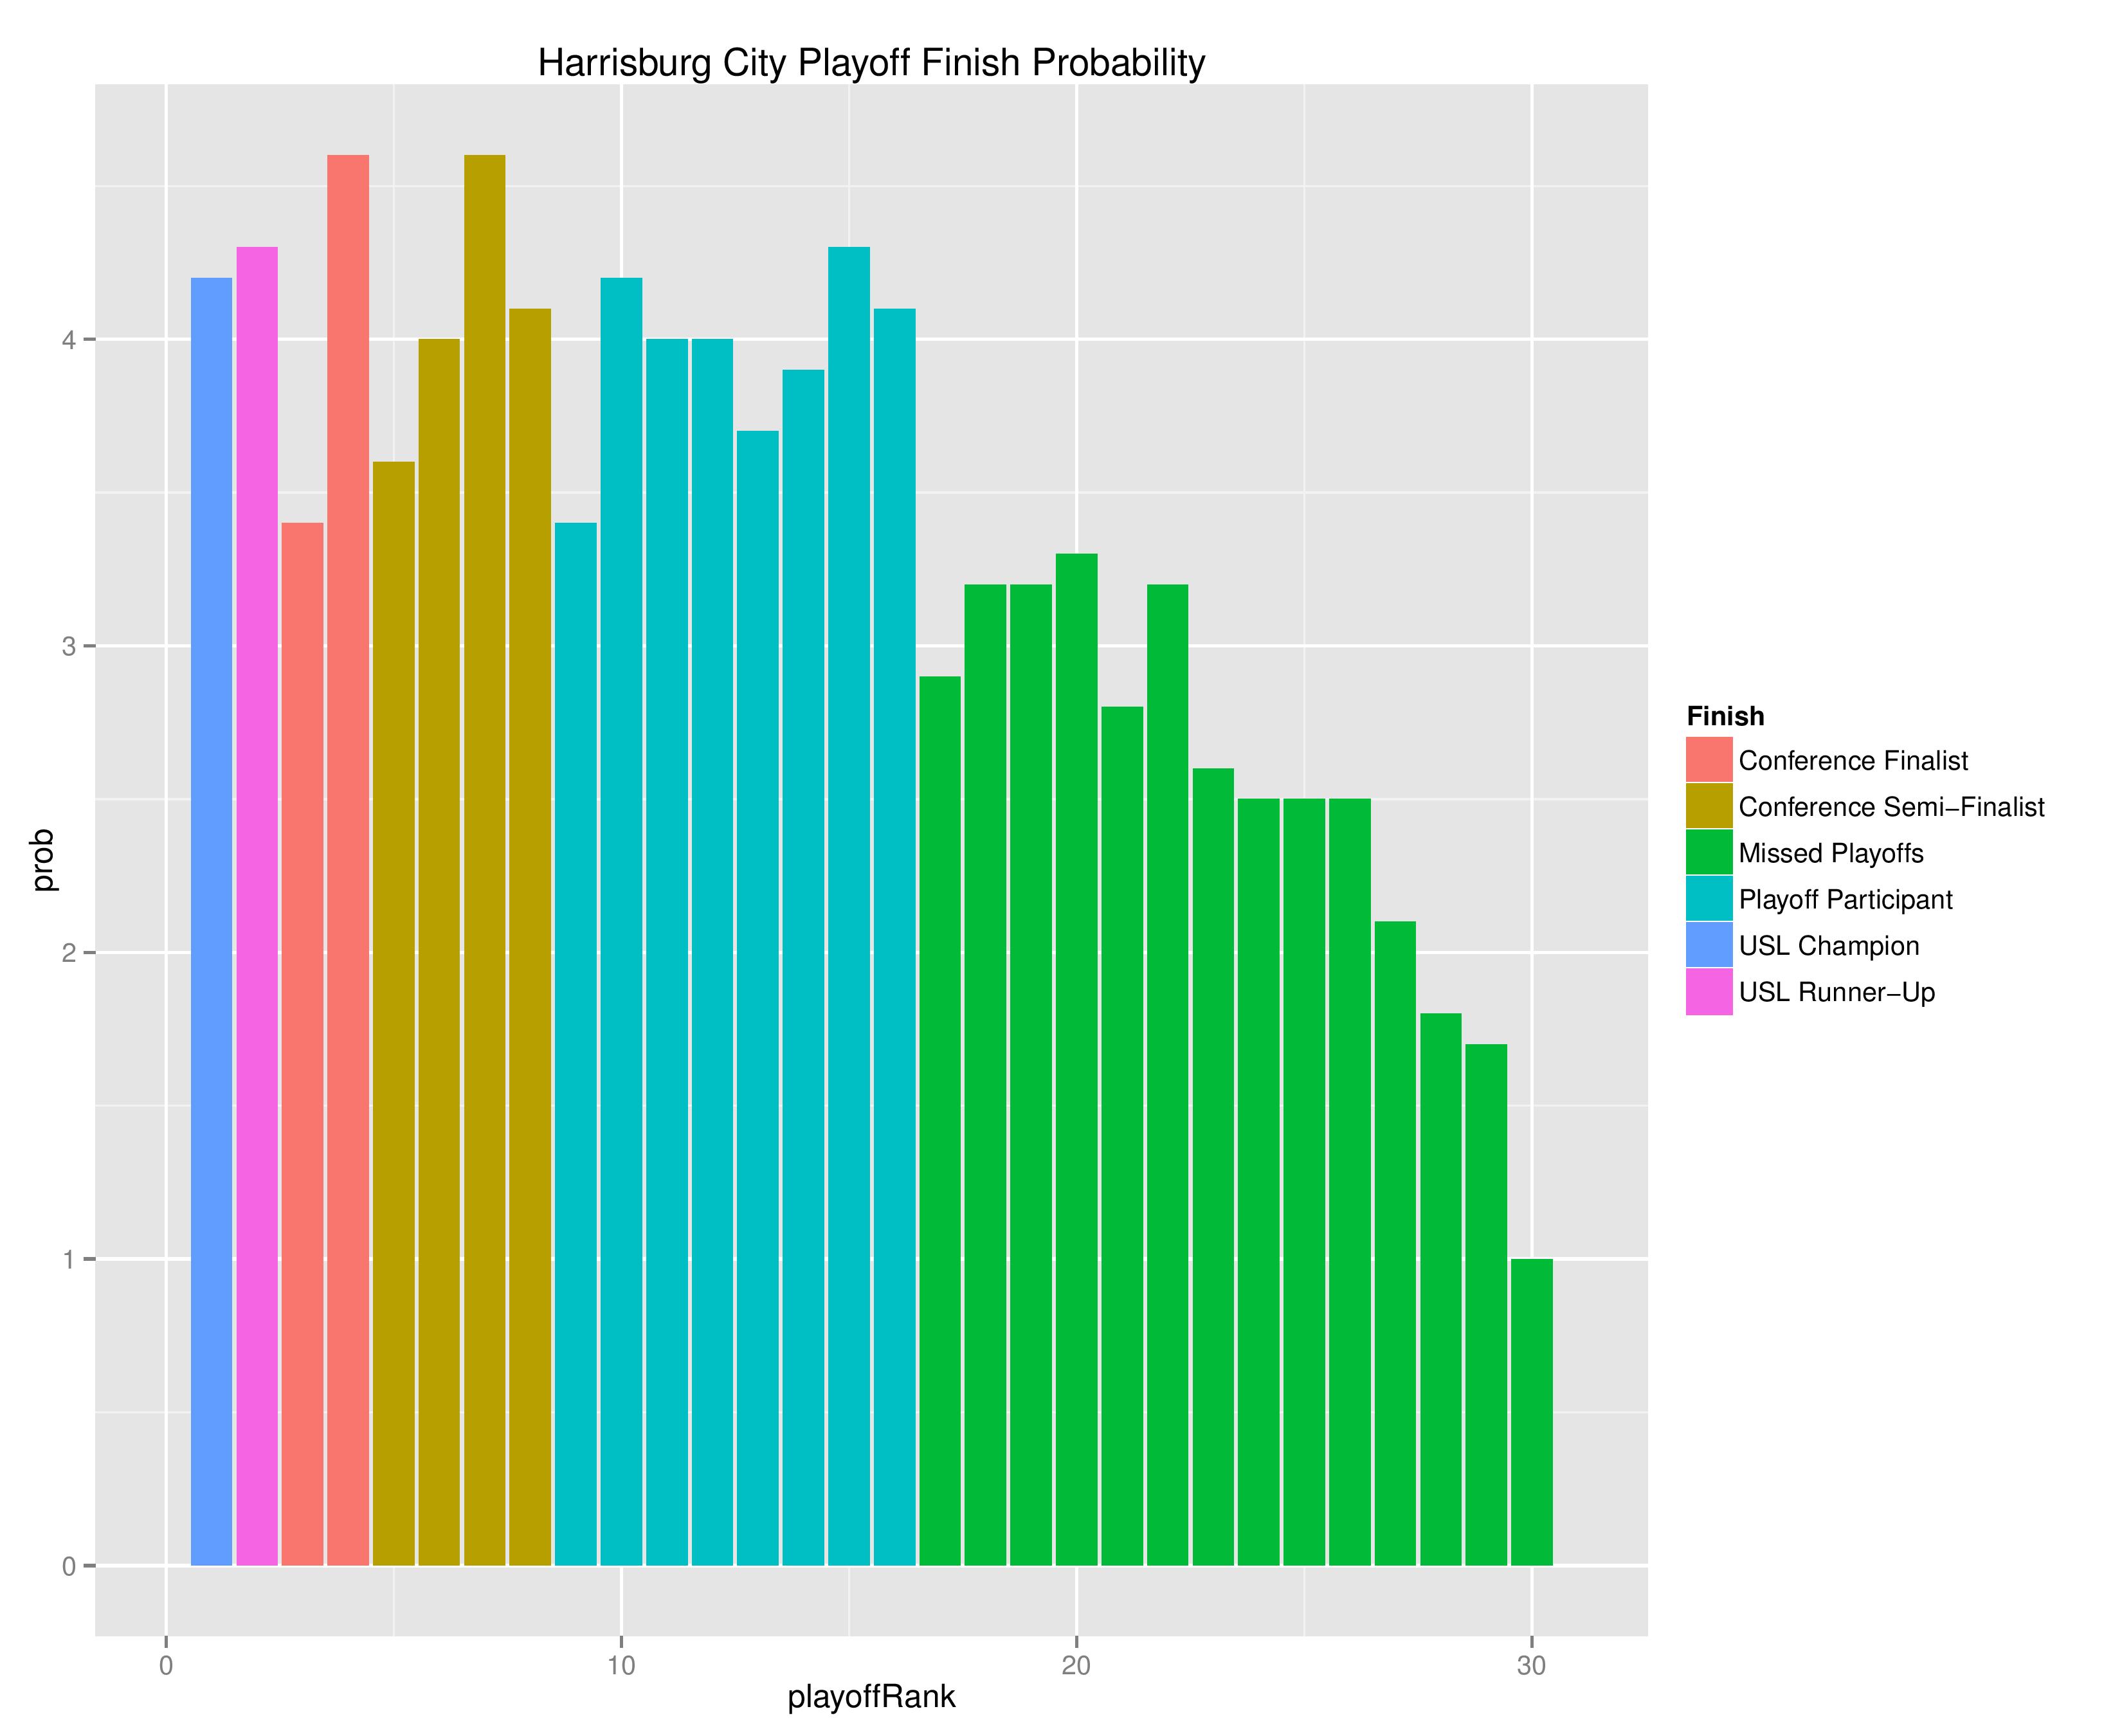
The following shows the probability of each post-playoff ranking finish.
The following shows the summary of the simulations in an easy table format.


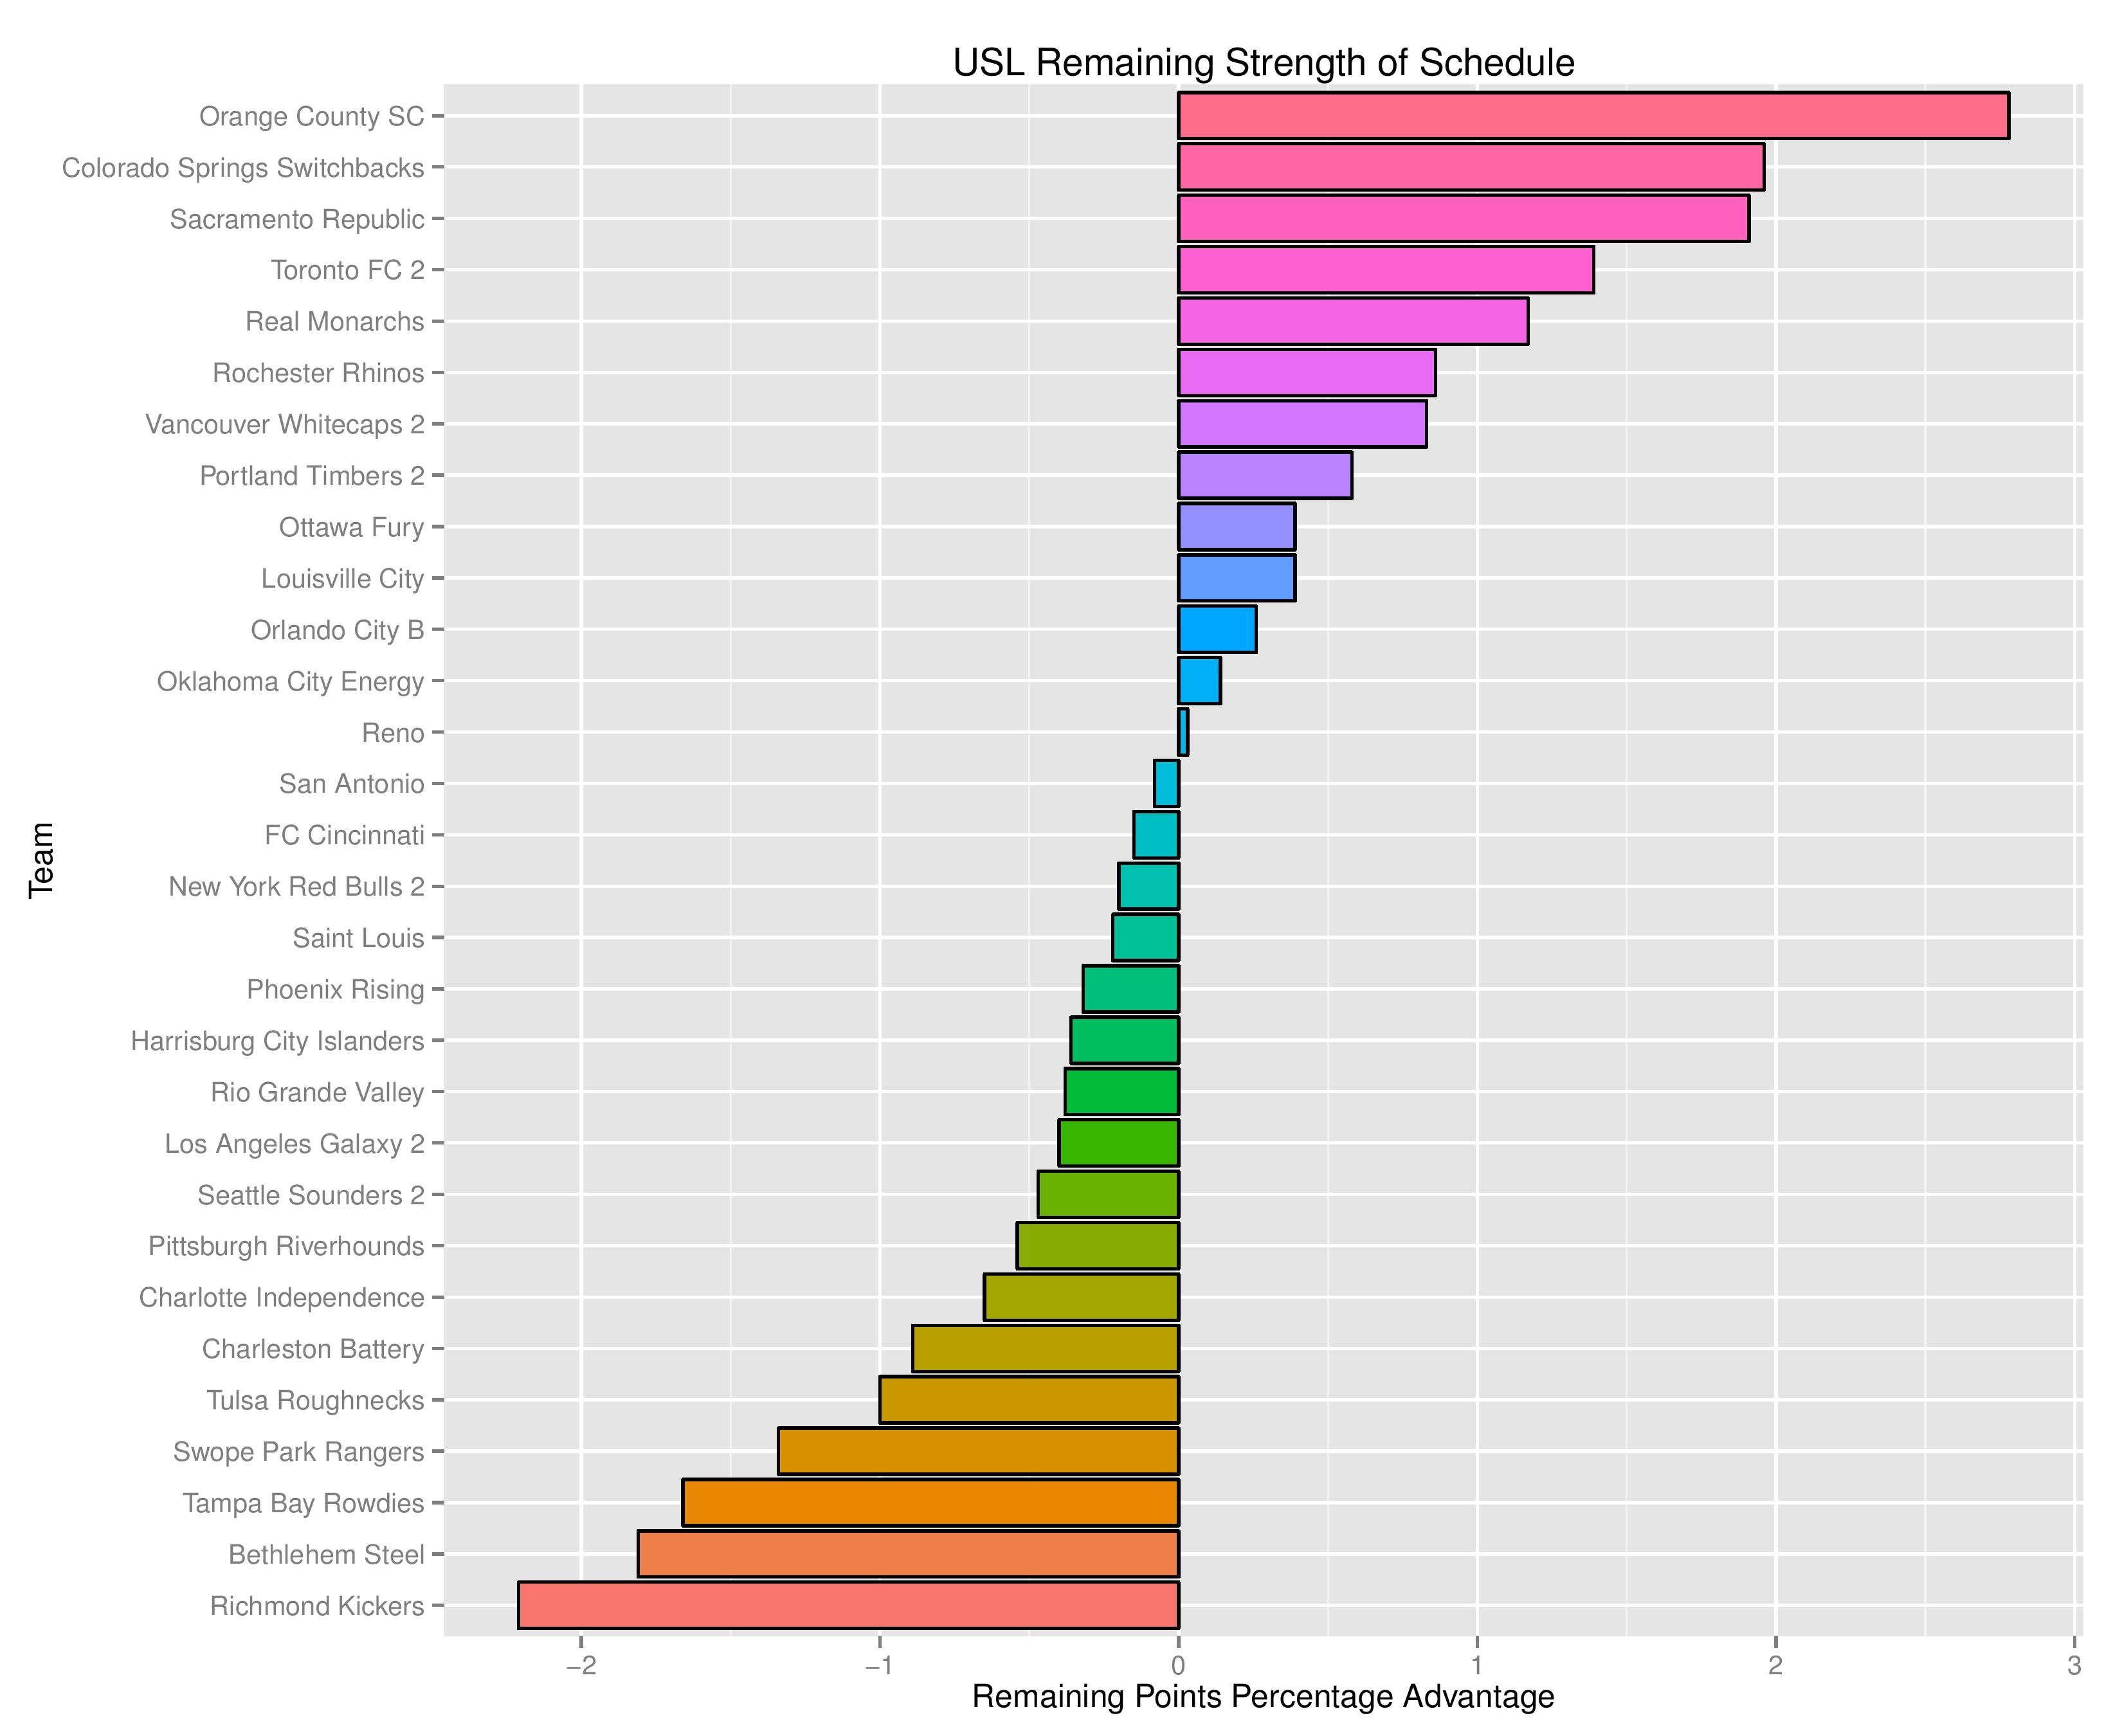
As a new feature, we can also show how the Remaining Strength of Schedule affects each team.
The “Points Percentage Advantage” shown on the X-axis represents the percentage of points expected over the league average schedule. This “points expected” value is generated by simulating how all teams would perform with all remaining schedules (and therefore judges a schedule based upon how all teams would perform in that scenario).
In short, the higher the value, the easier the remaining schedule.
Remaining home field advantage will make a large contribution here. It can also be true that a better team has an ‘easier’ schedule simply because they do not have to play themselves. Likewise, a bad team may have a ‘harder’ schedule because they also do not play themselves.
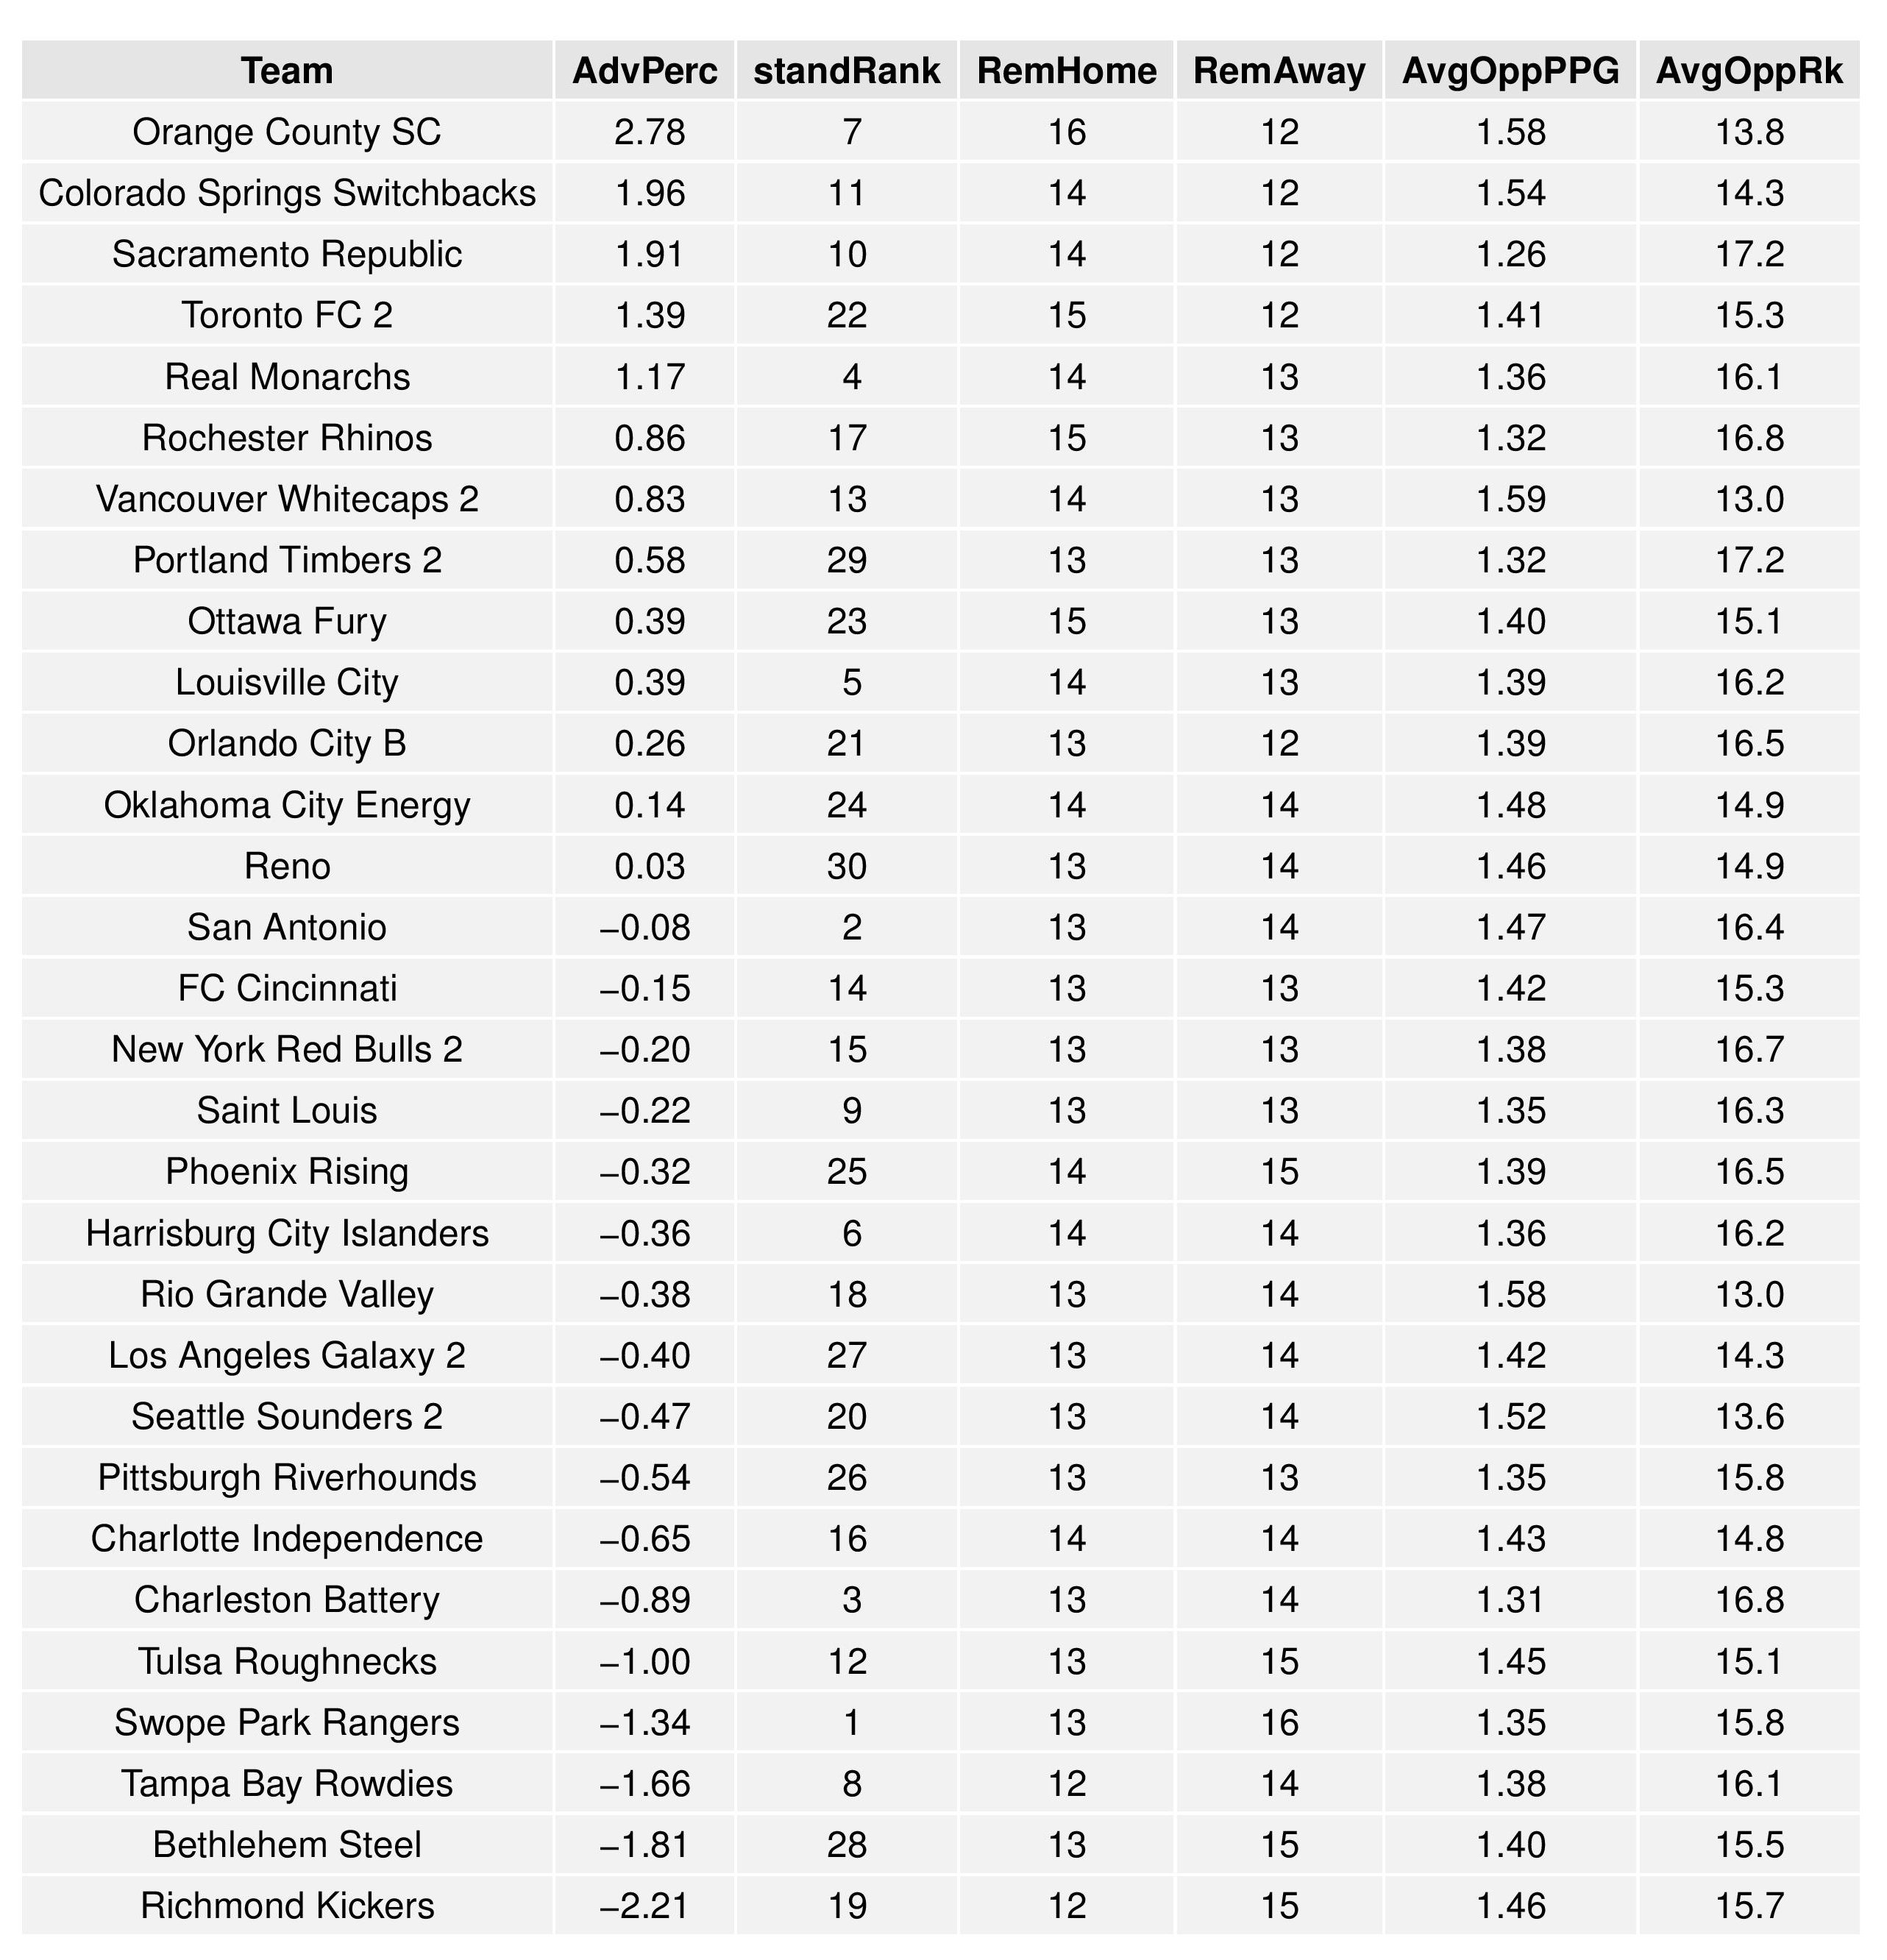
The table following the chart also shares helpful context with these percentages.
Accompanying the advantage percentage in the following table is their current standings rank (right now ties are not properly calculated beyond pts/gd/gf), the remaining home matches, the remaining away matches, the current average points-per-game of future opponents (results-based, not model-based), and the average power ranking of future opponents according to SEBA.
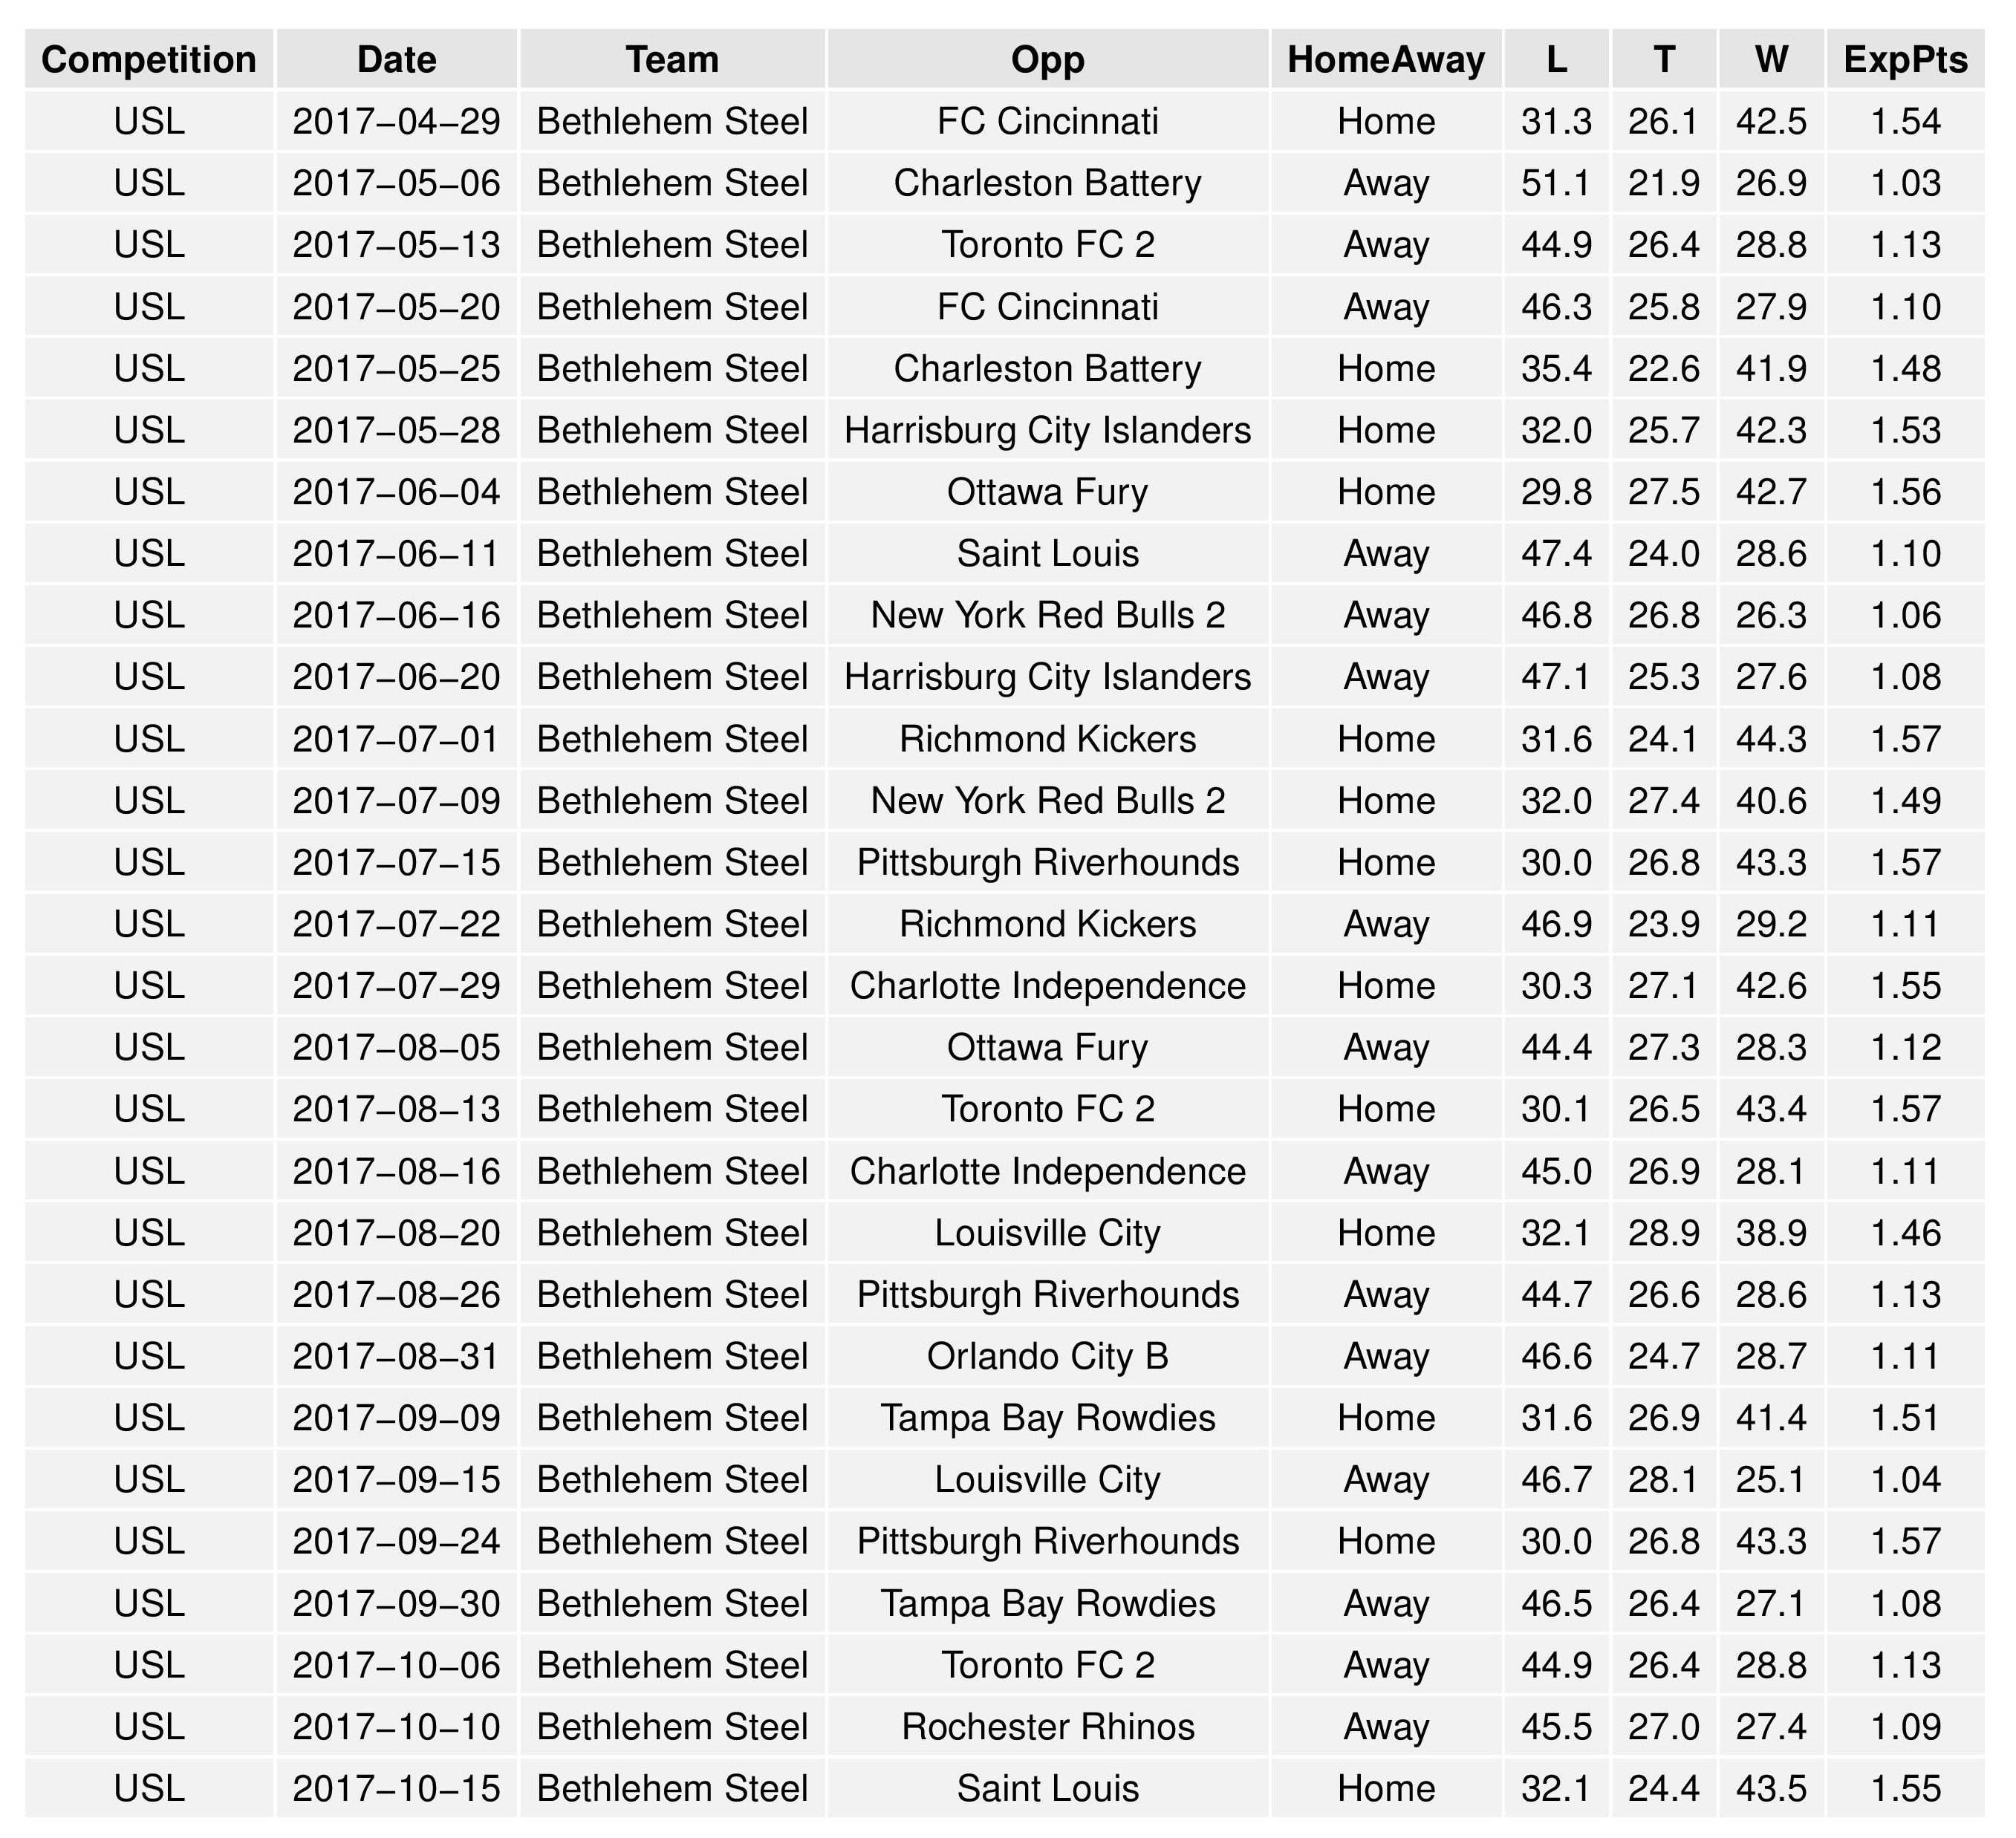
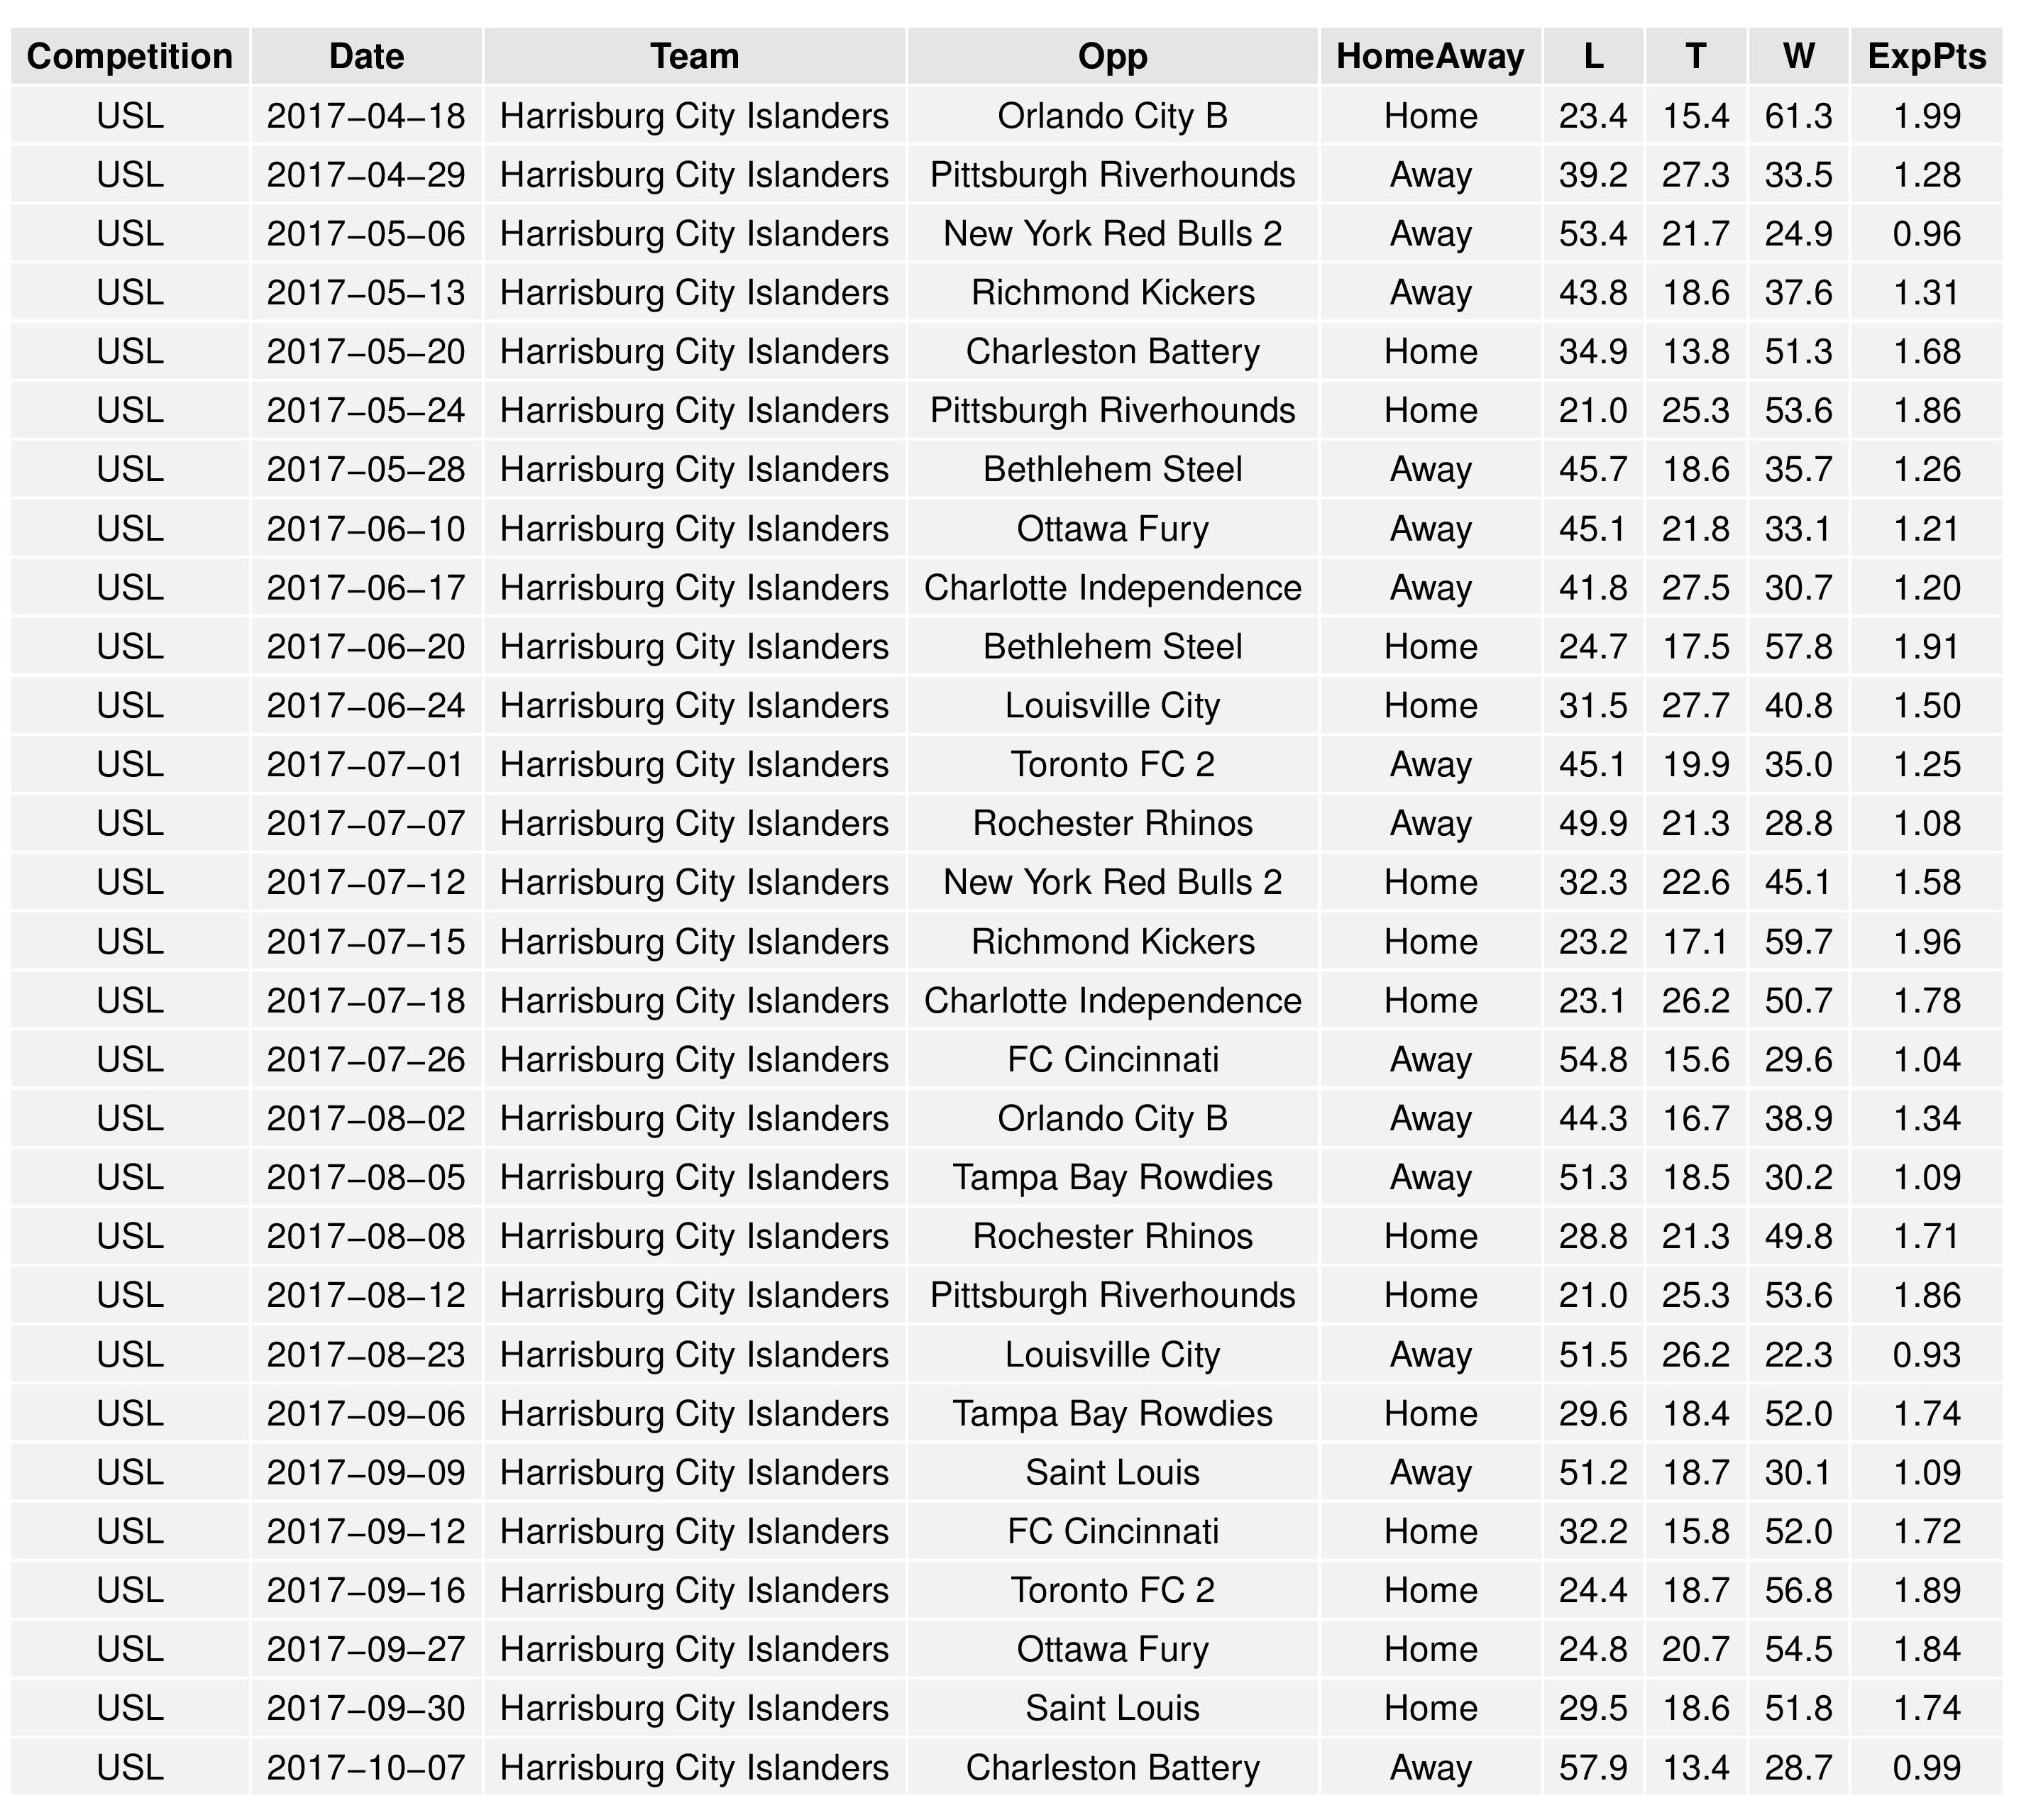
The following shows the expectations for upcoming matches for both Bethlehem and Harrisburg:
Model Validation
This chart is the same as that in the MLS forecast (except for USL matches instead of MLS).
Remember that these data points are not fixed until the end of the season.
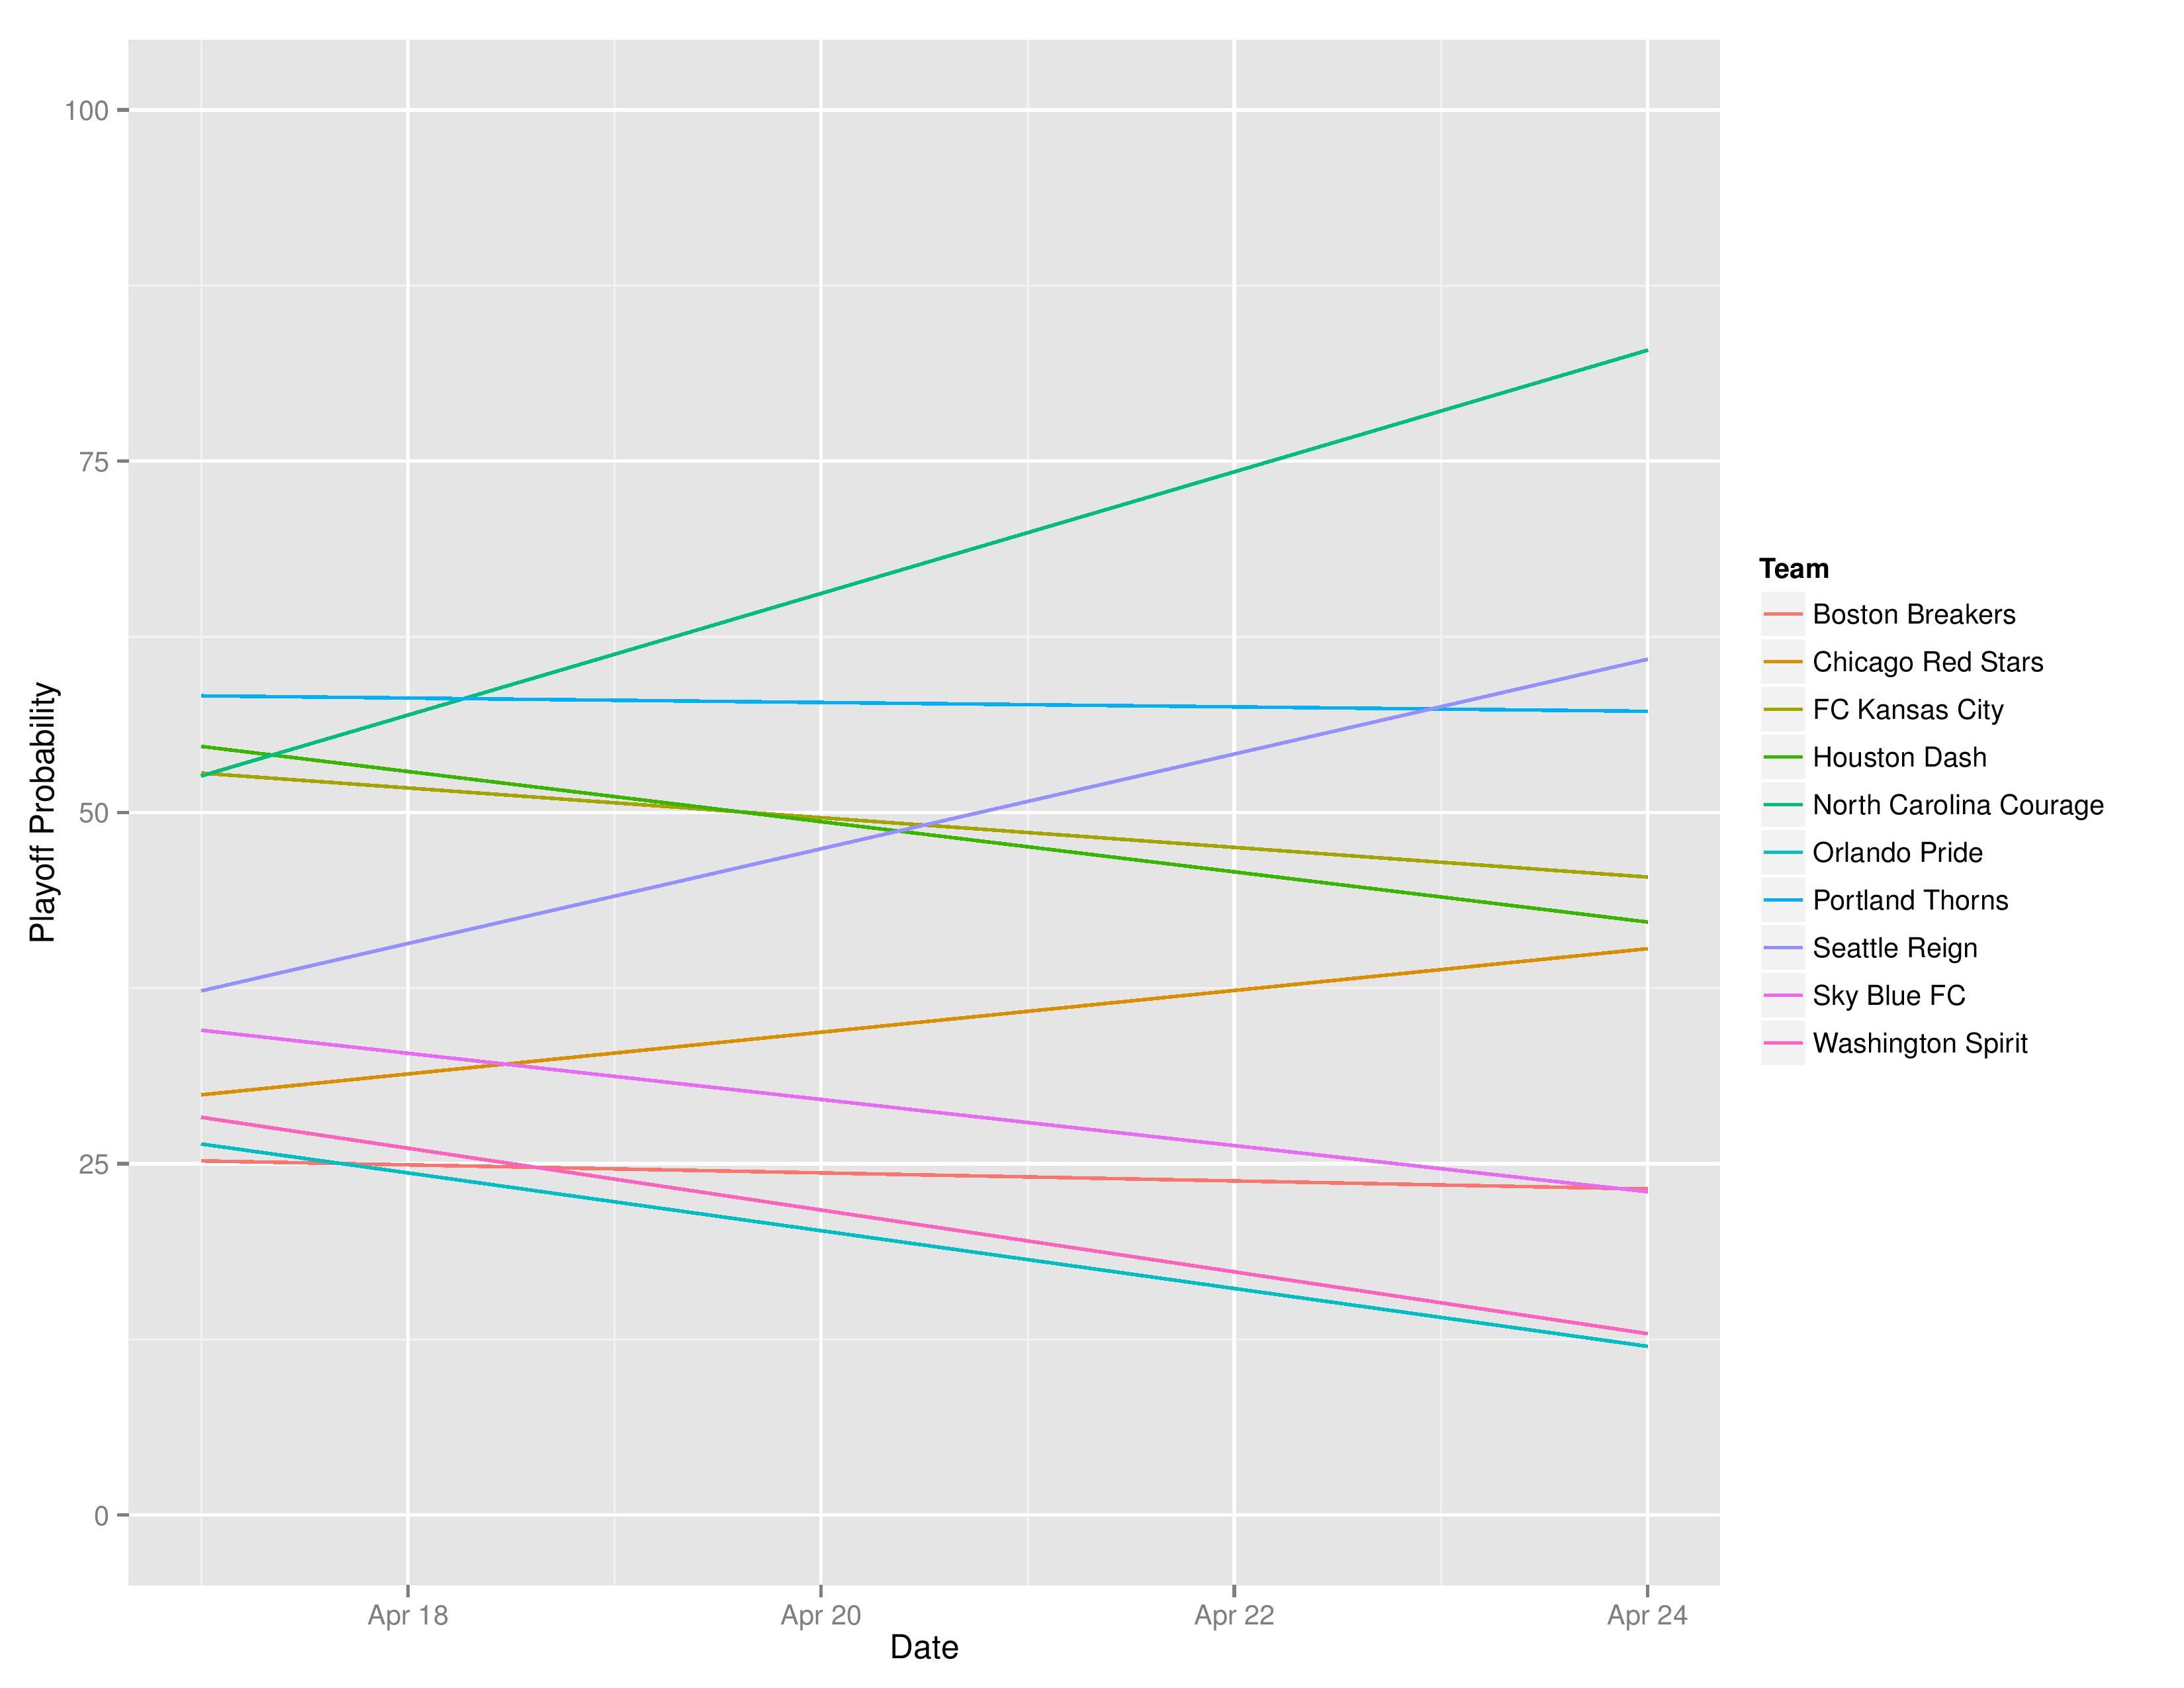
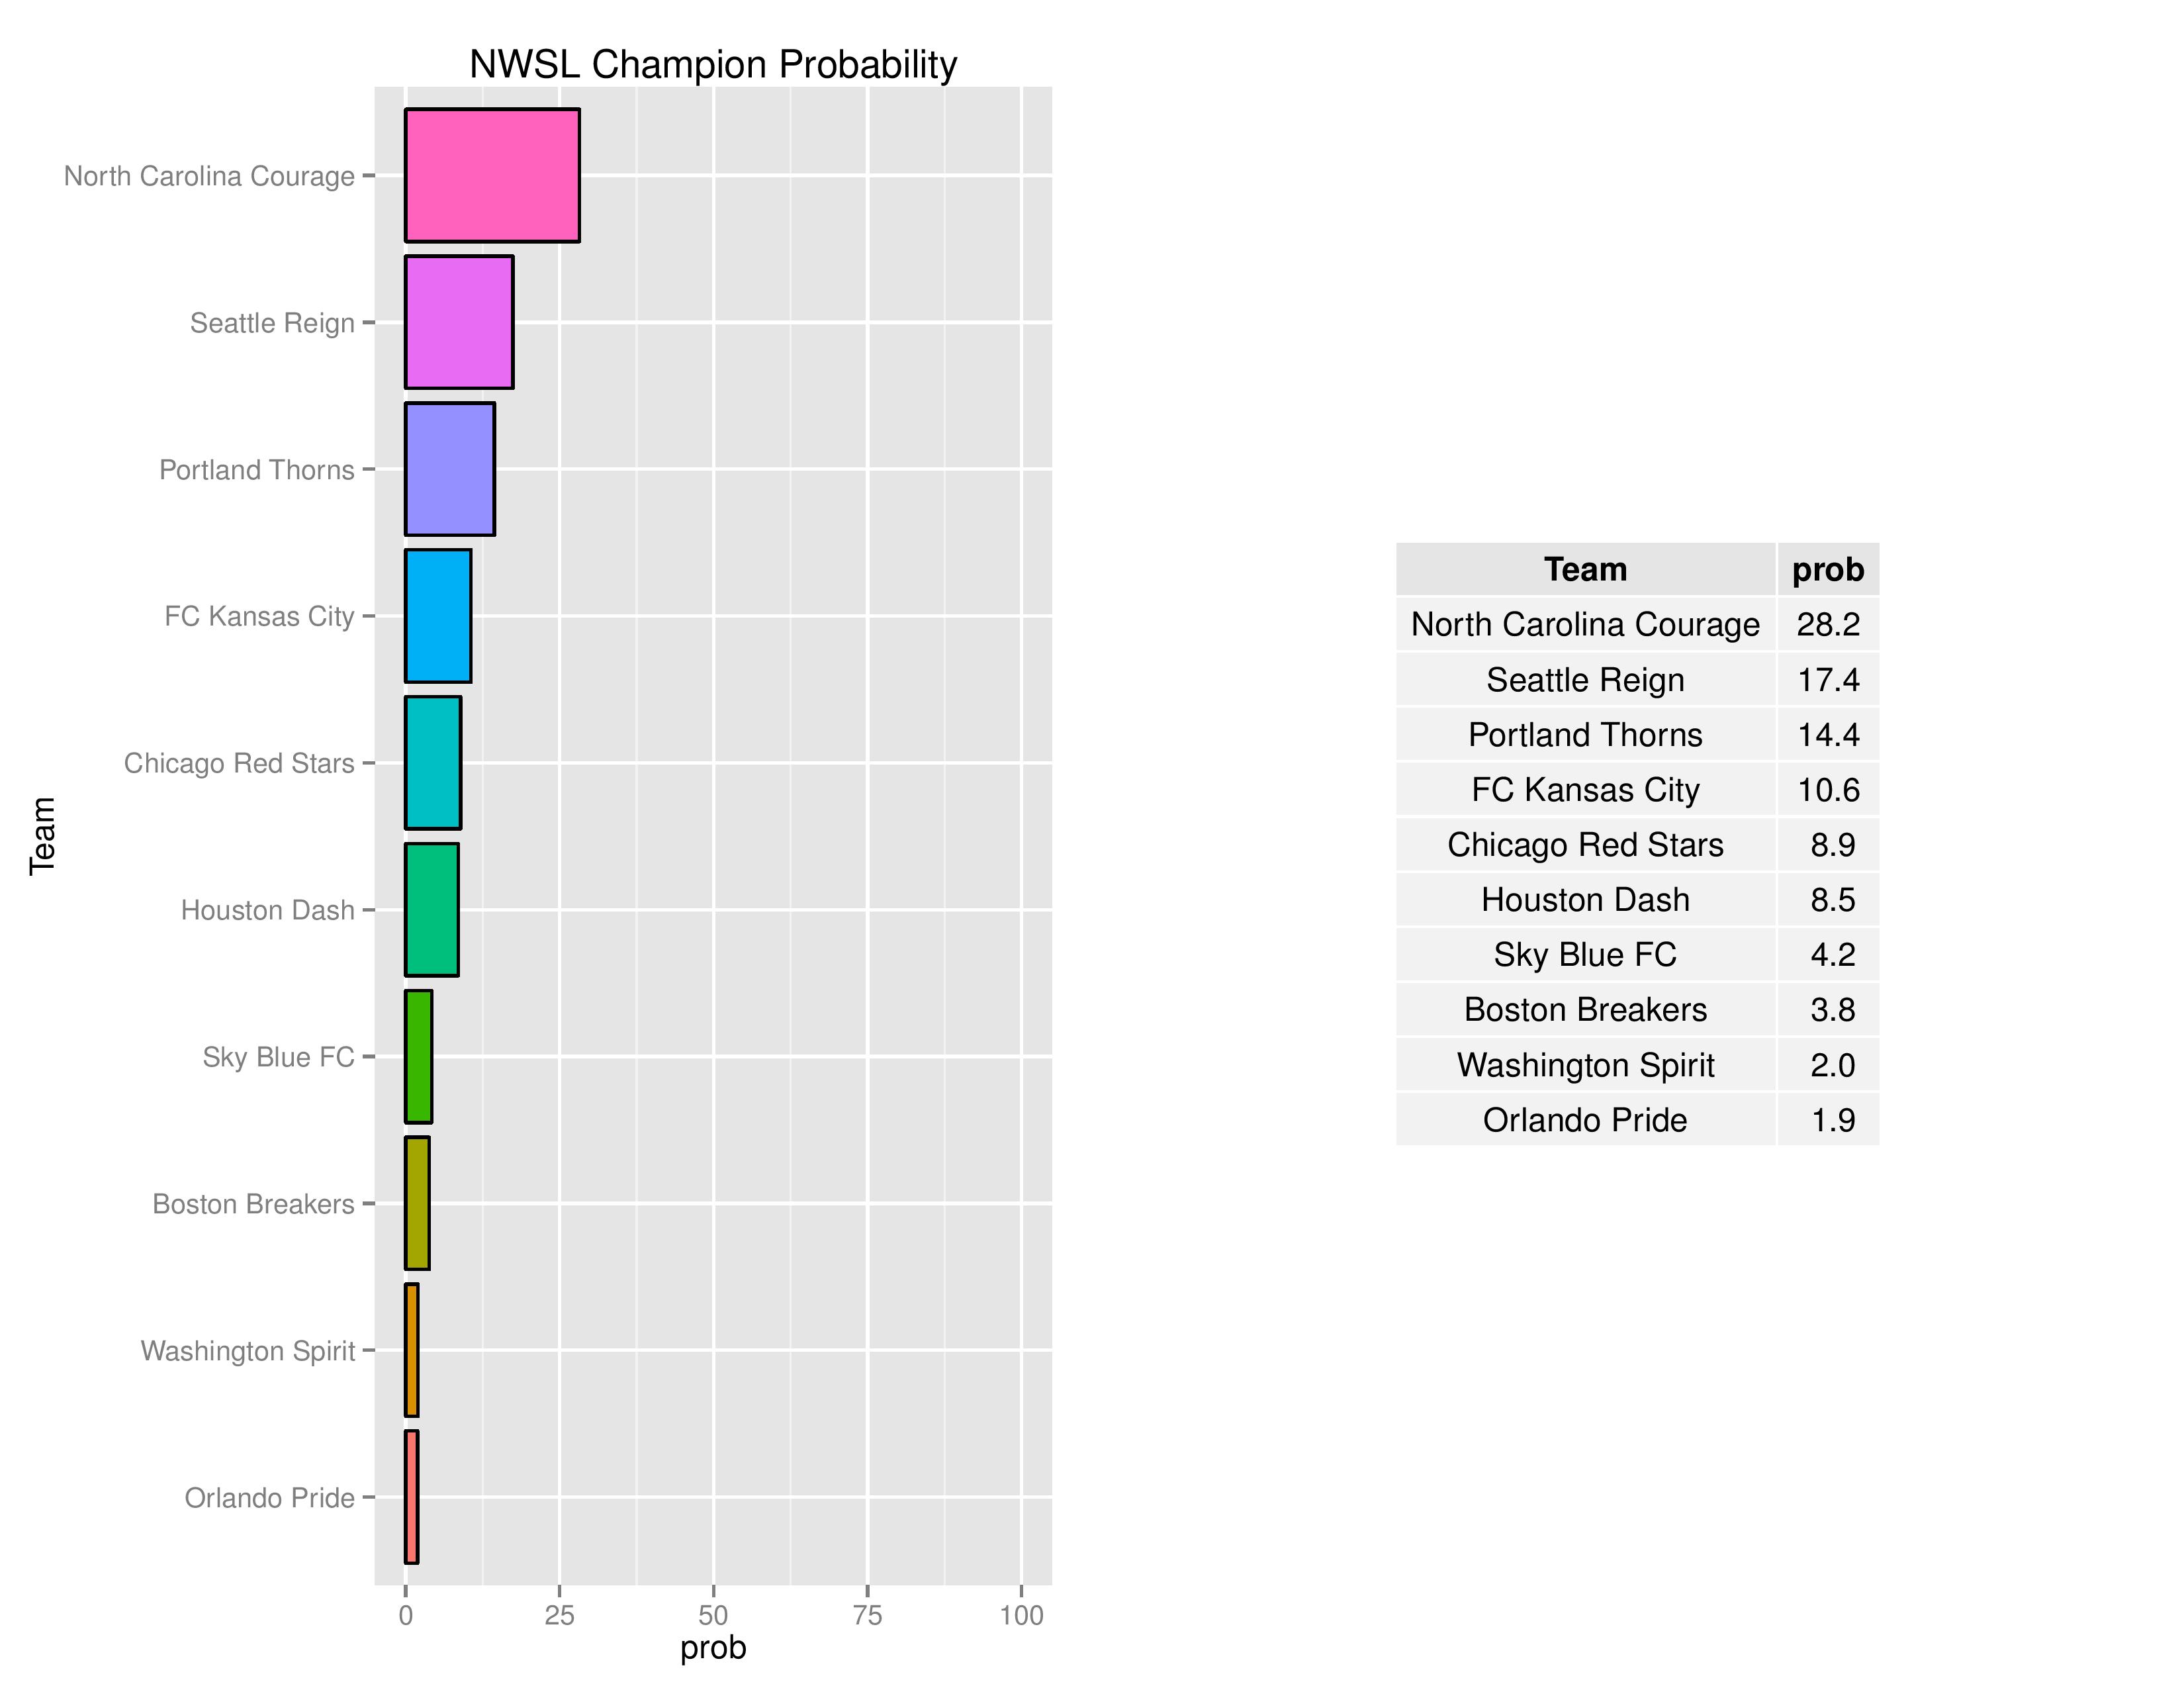
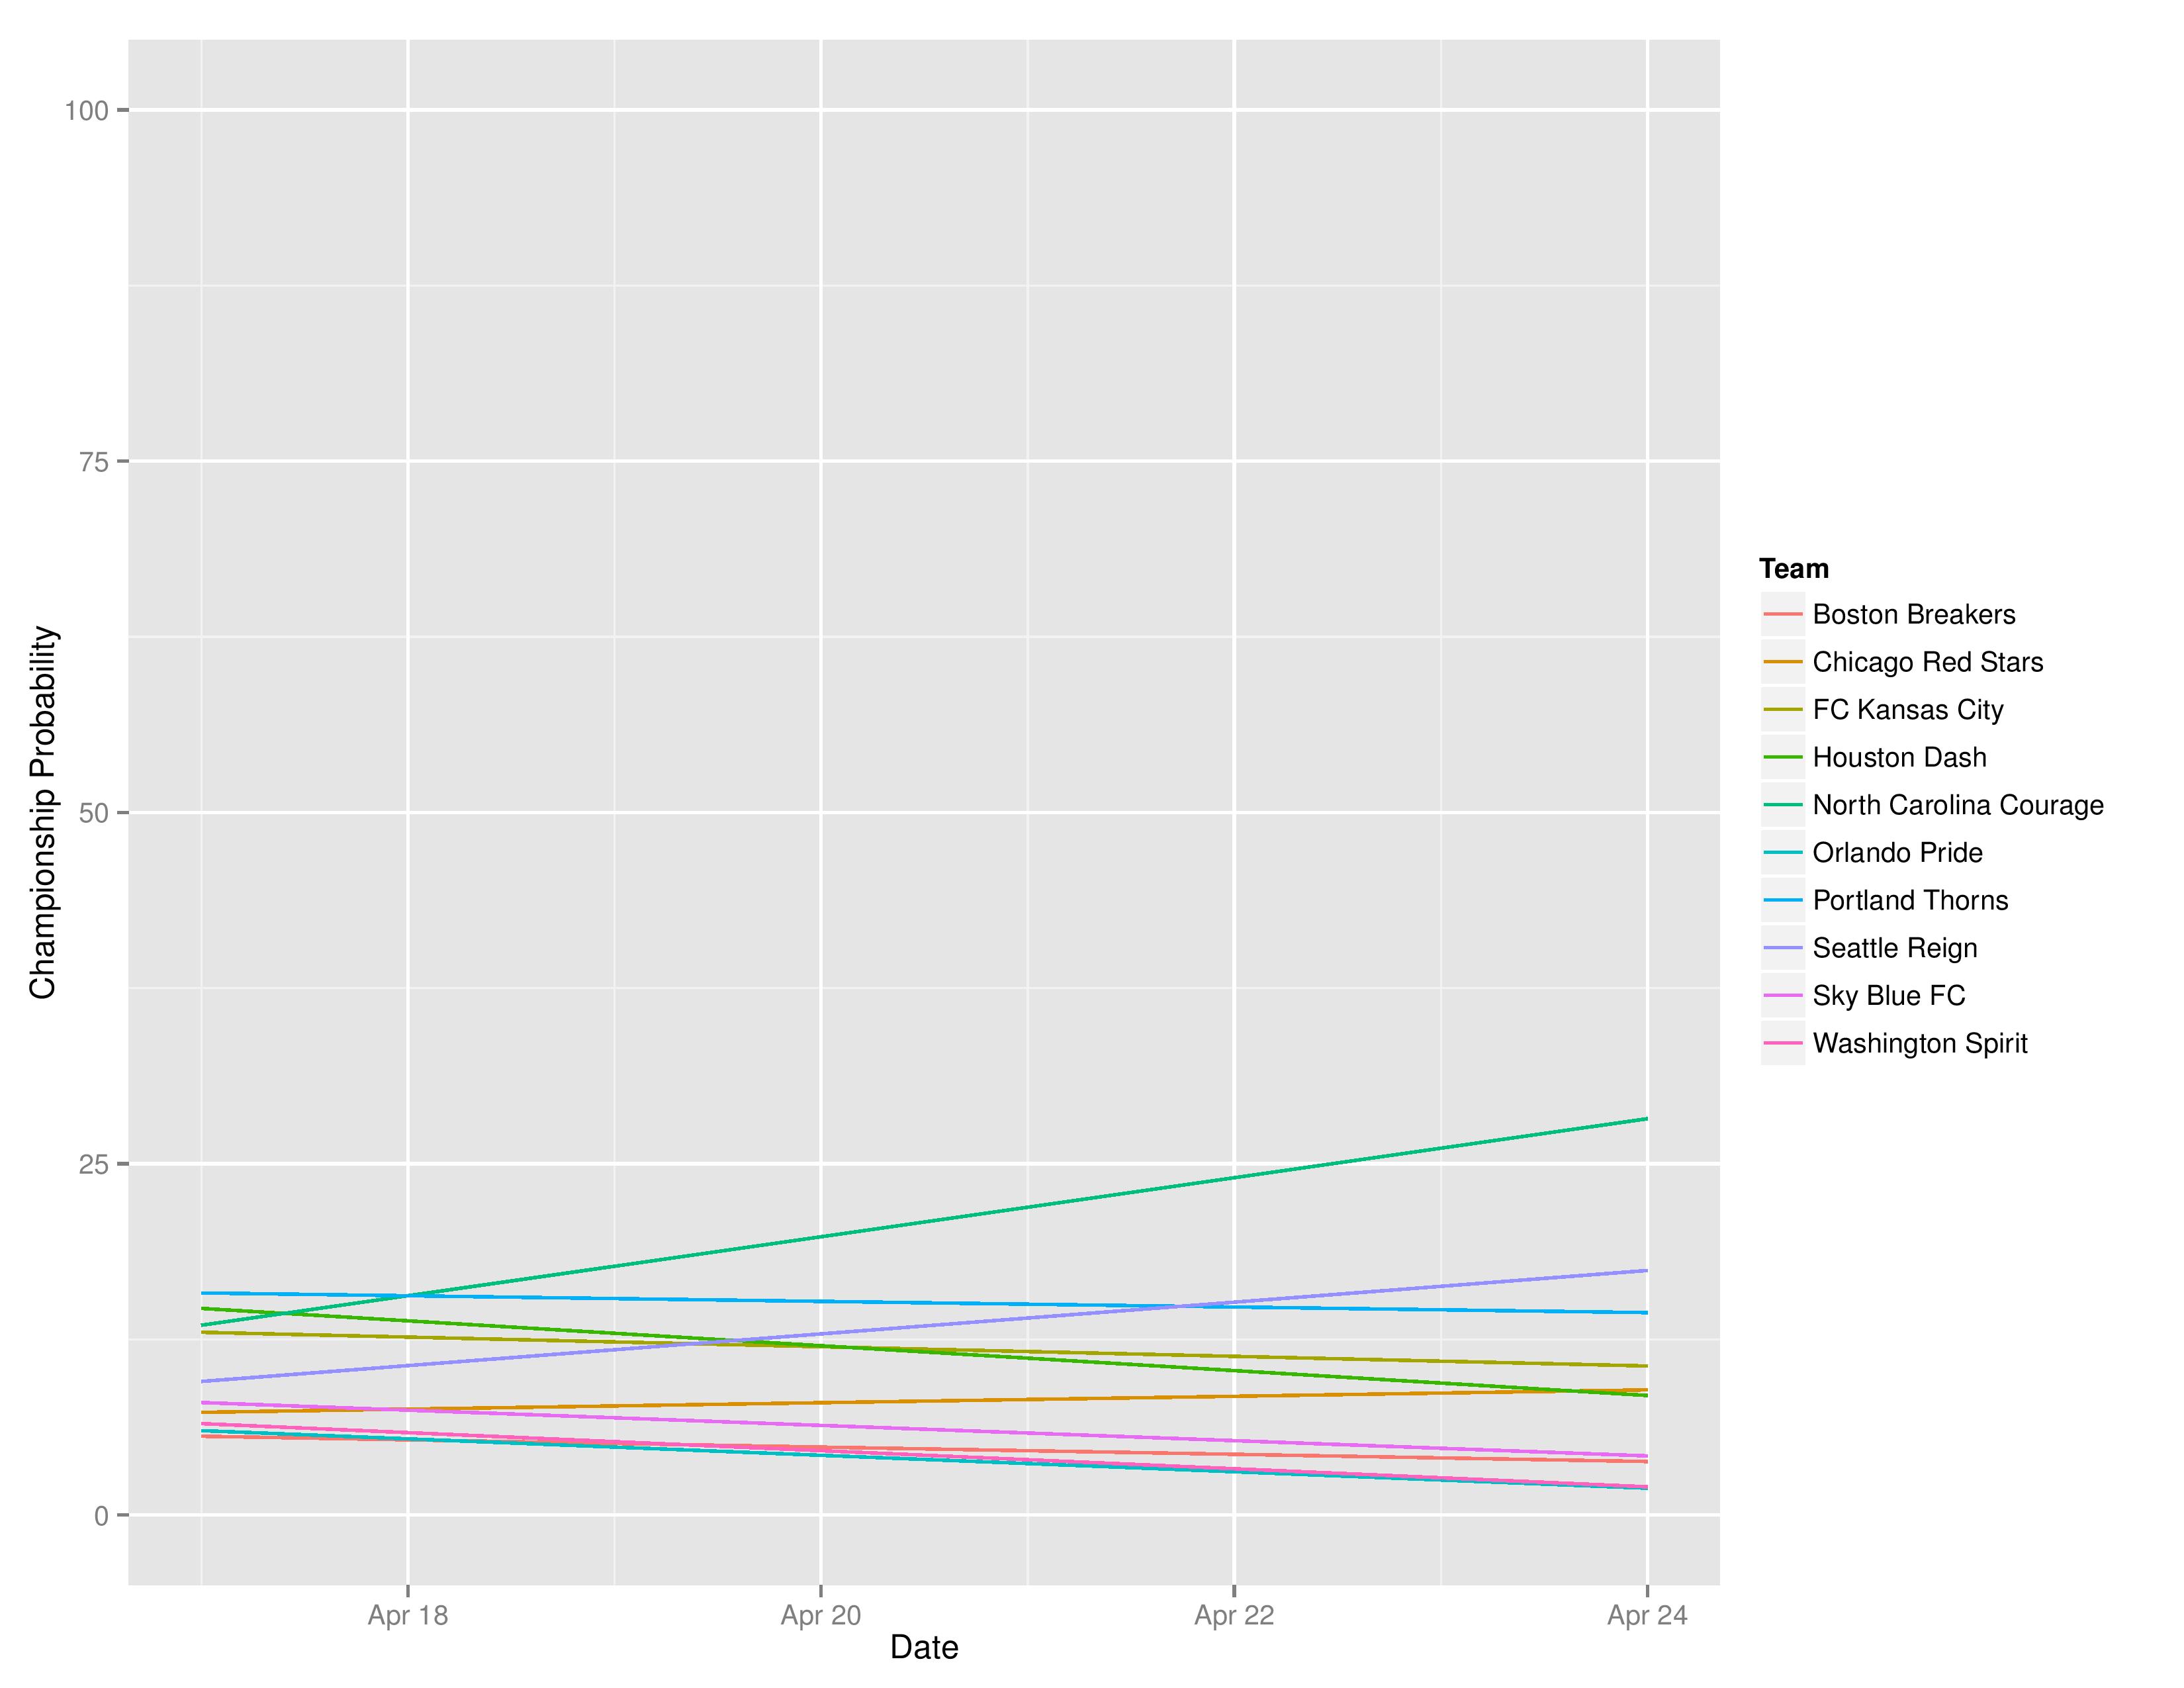
NWSL
Power Rankings

Playoffs probability and more
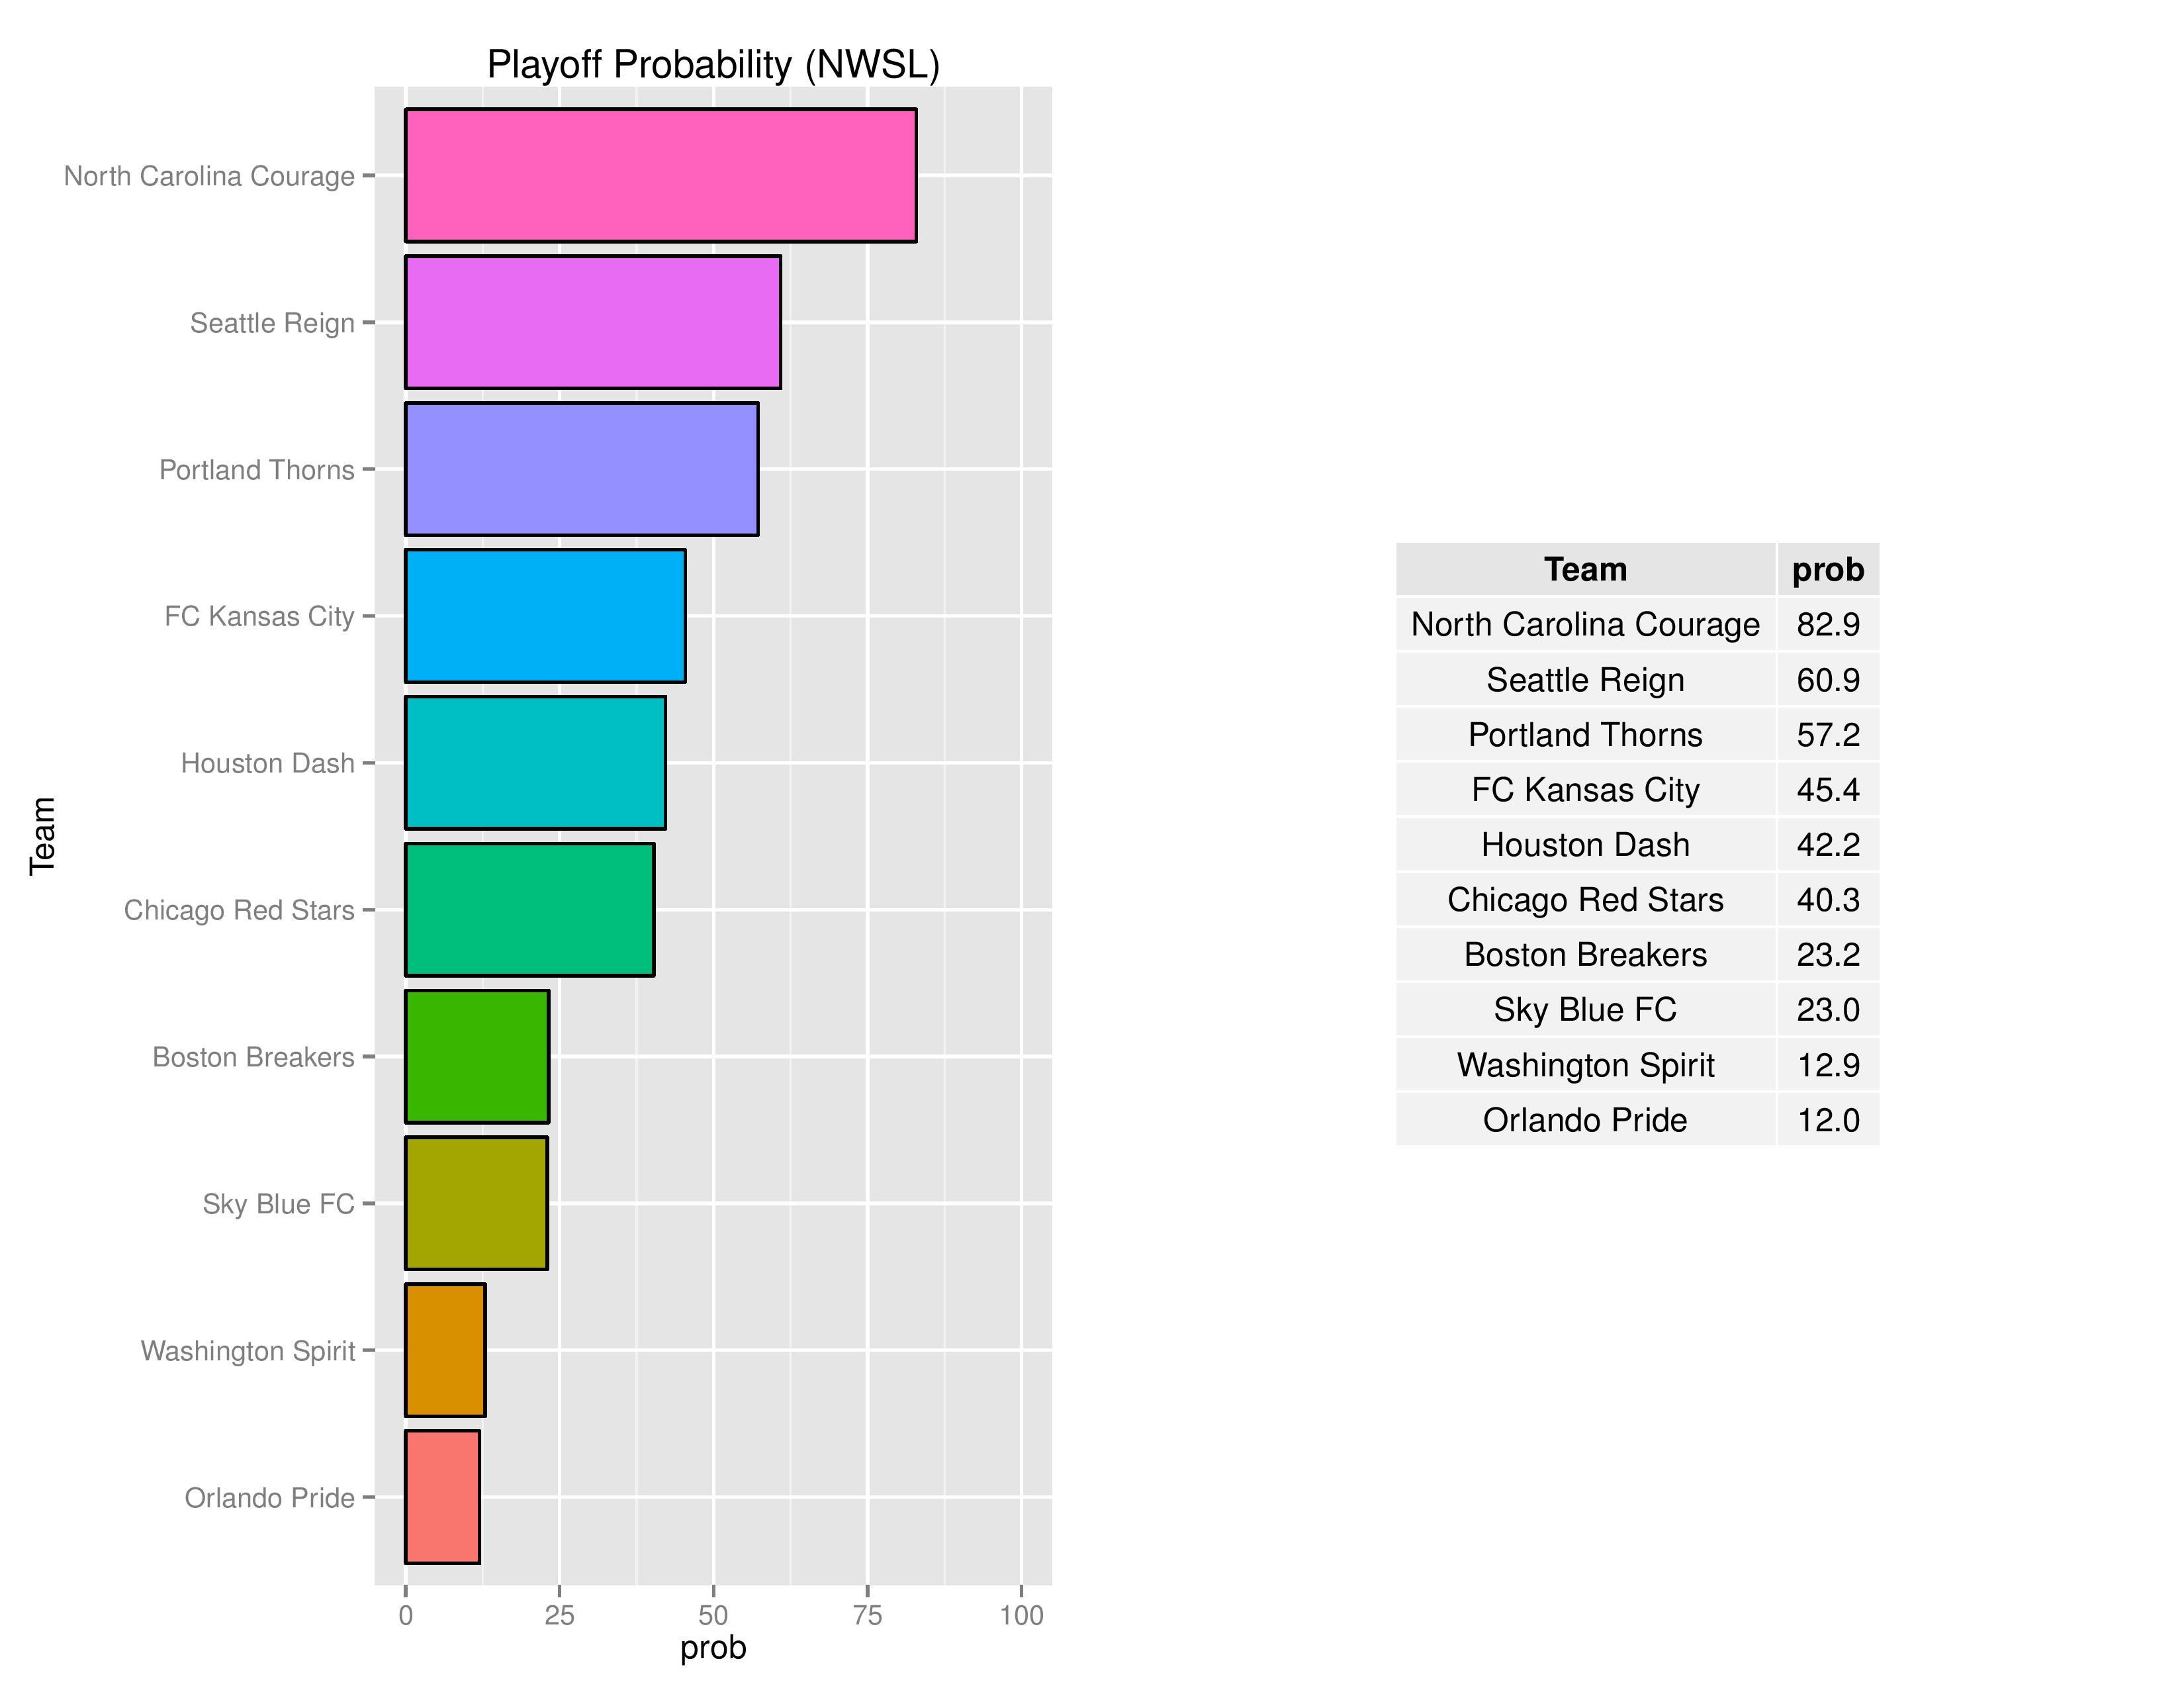
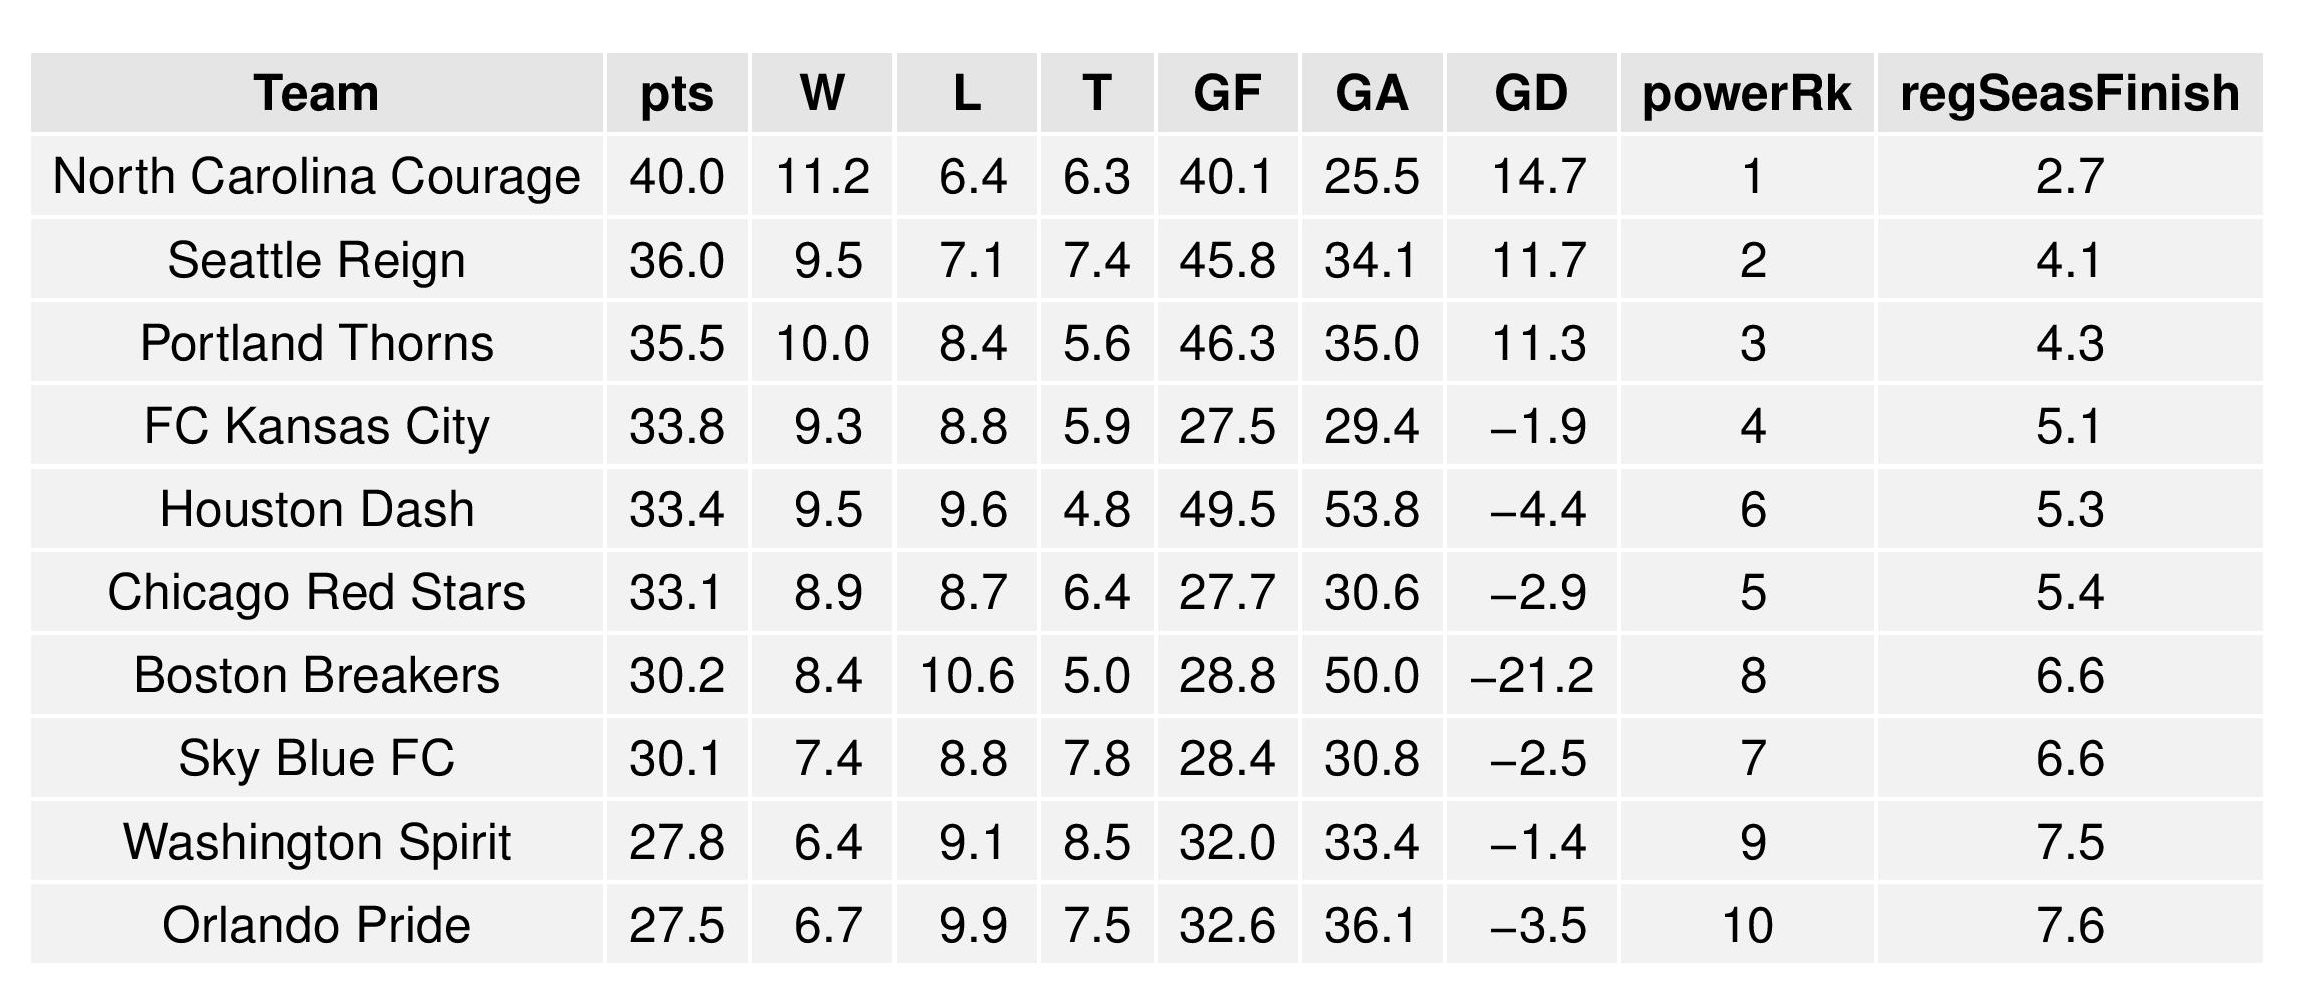
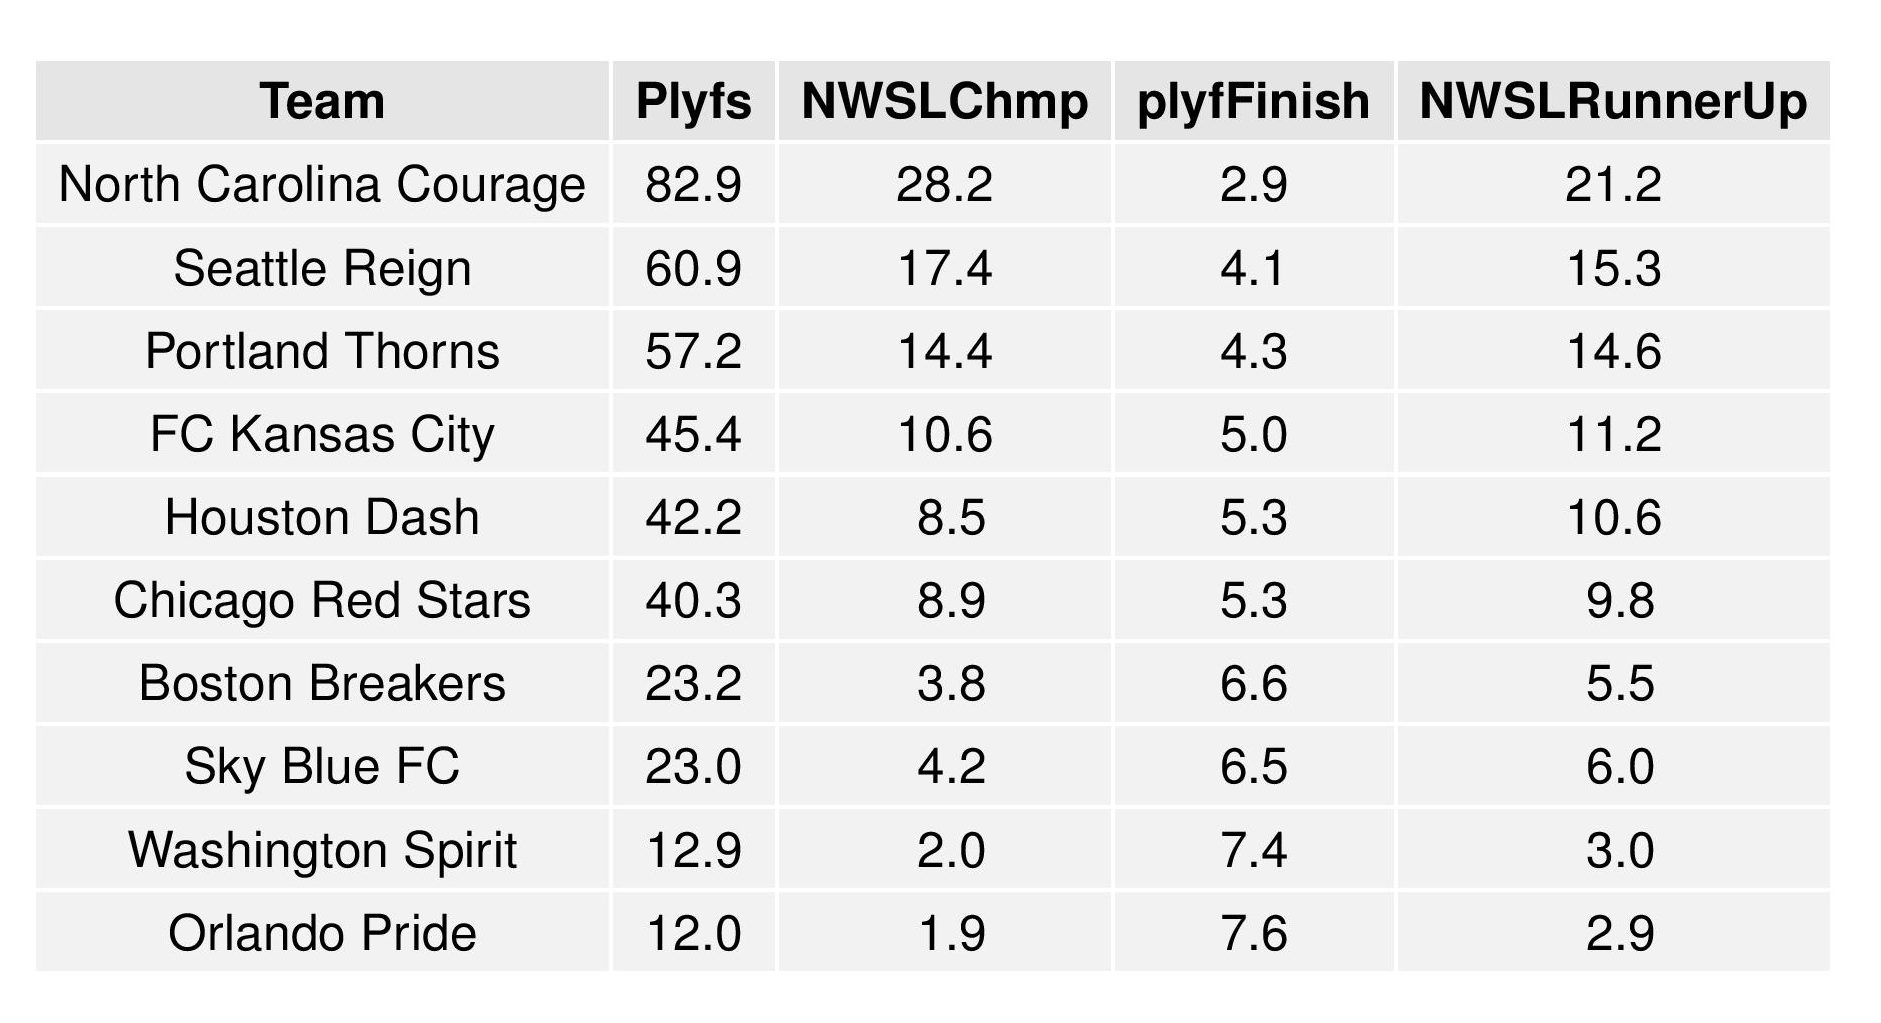
The following shows the summary of the simulations in an easy table format.
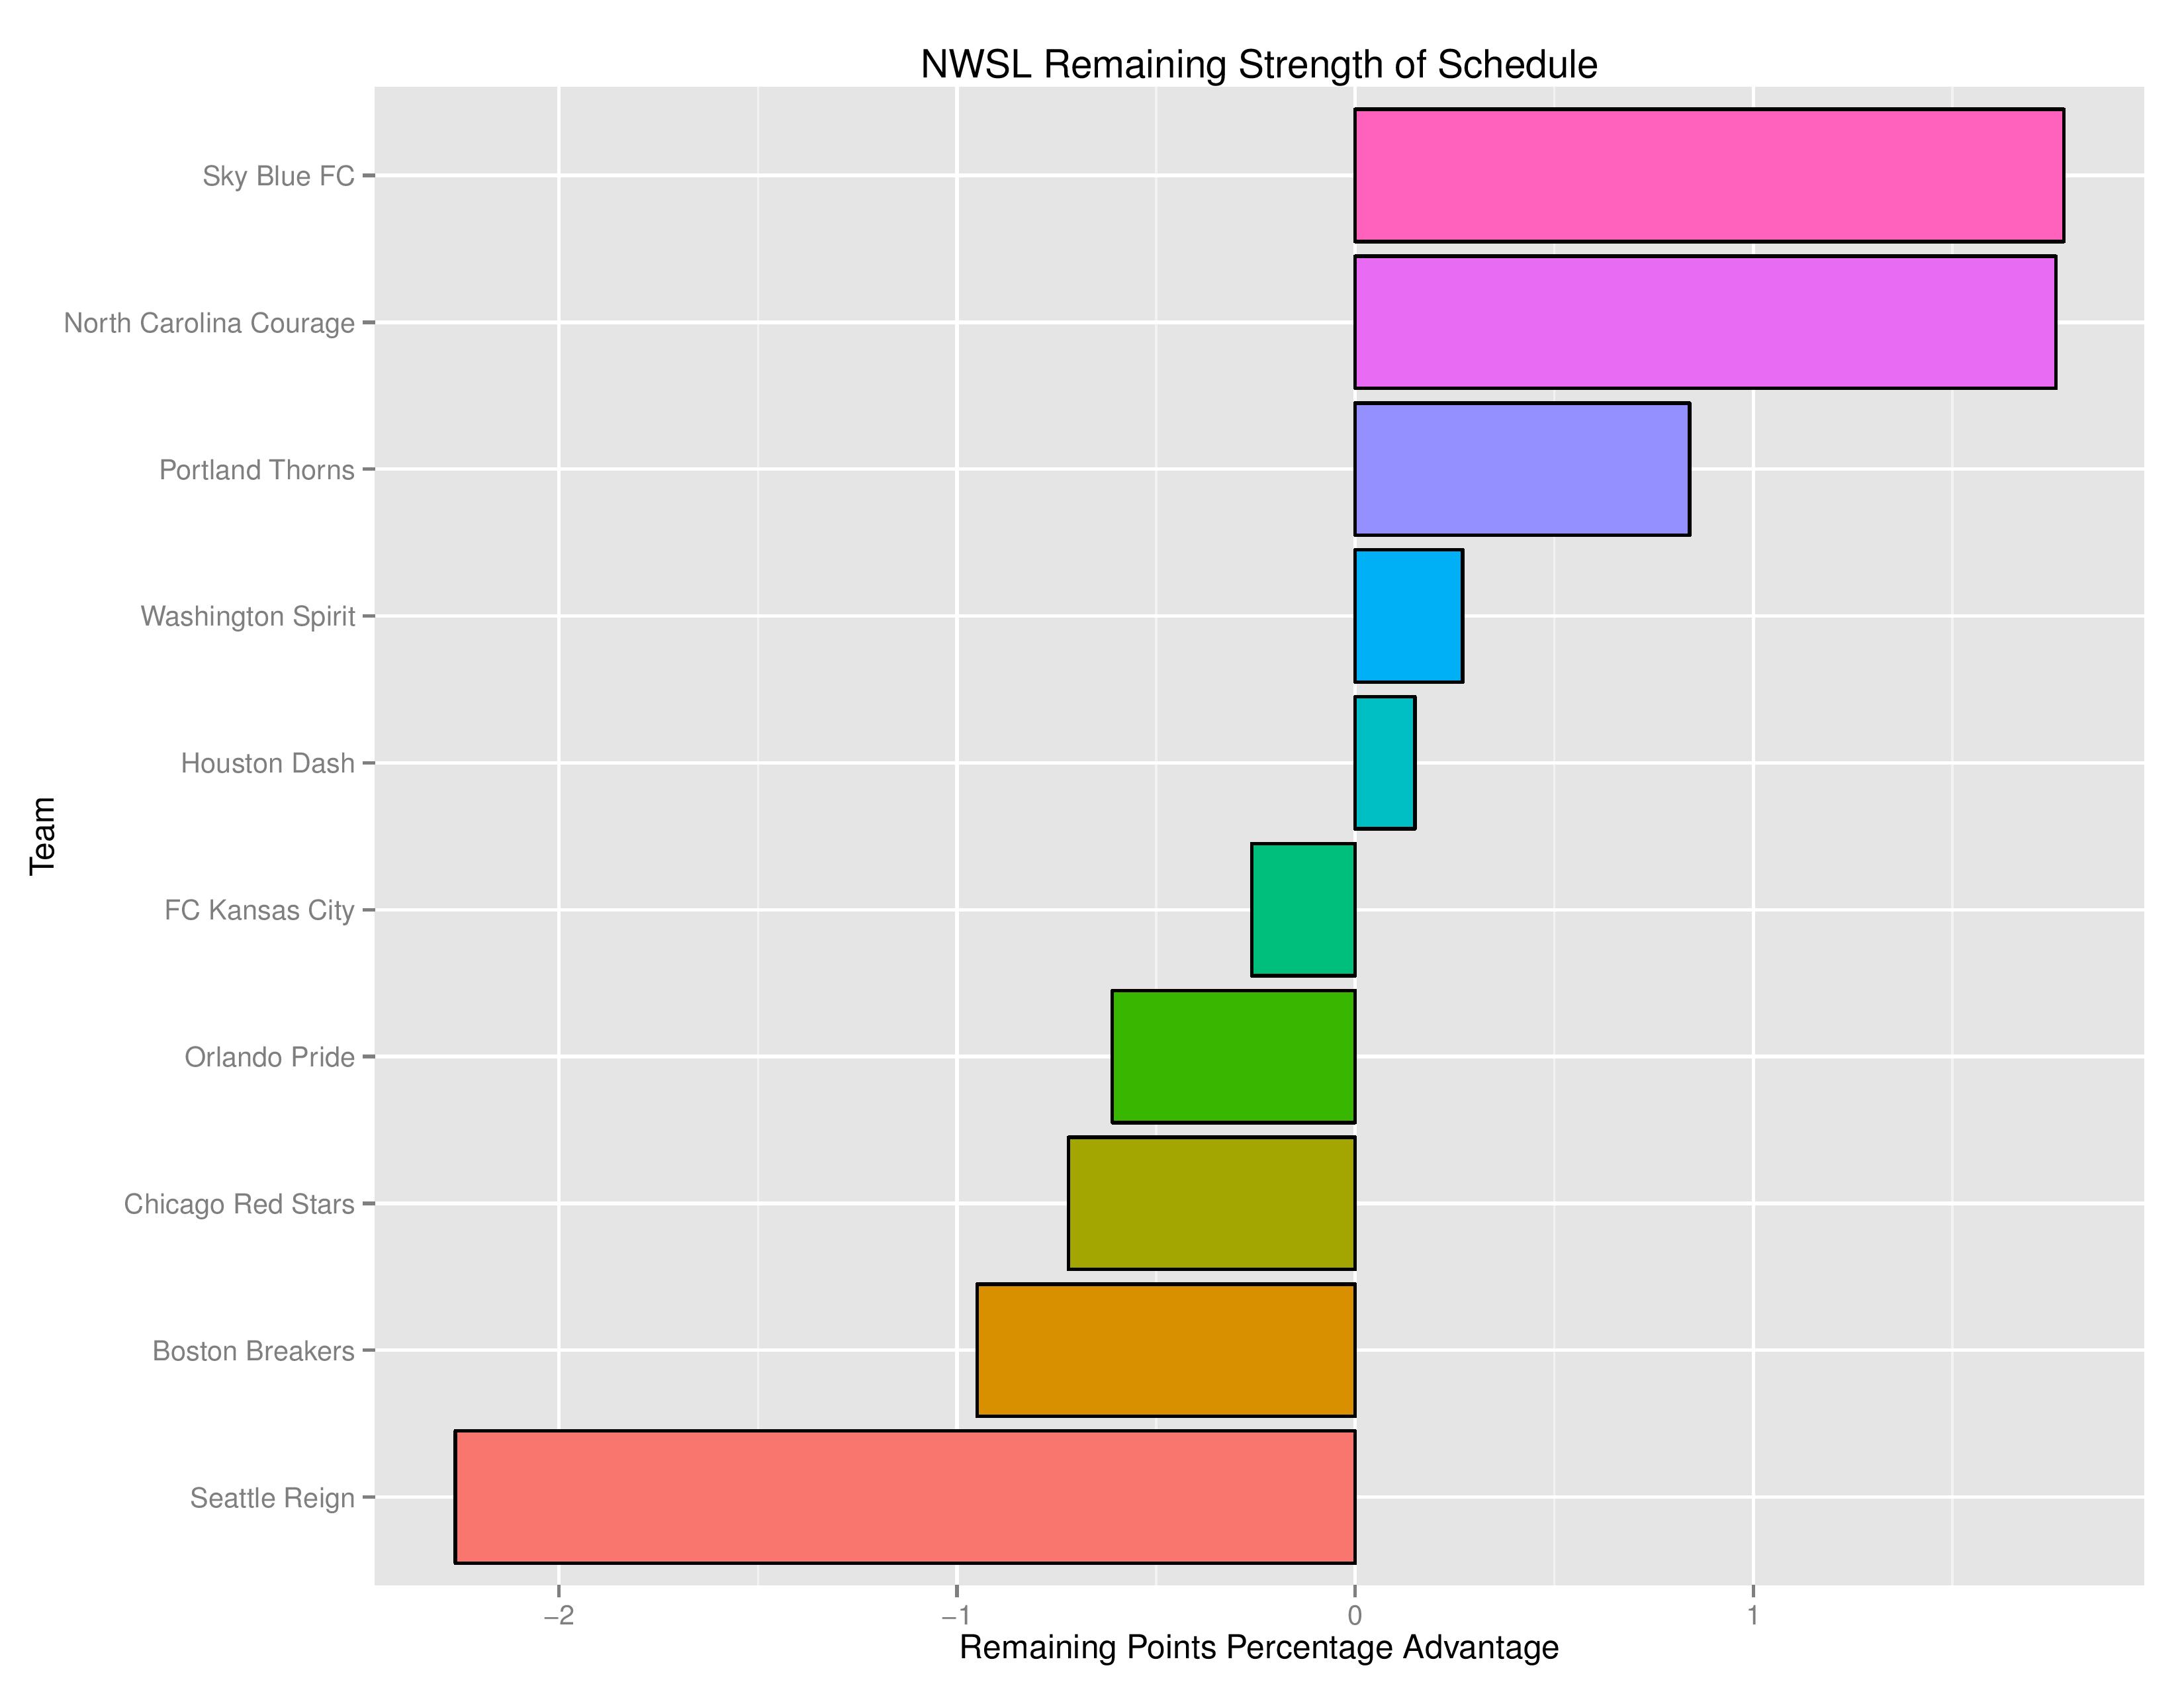
As a new feature, we can also show how the Remaining Strength of Schedule affects each team.
The “Points Percentage Advantage” shown on the X-axis represents the percentage of points expected over the league average schedule. This “points expected” value is generated by simulating how all teams would perform with all remaining schedules (and therefore judges a schedule based upon how all teams would perform in that scenario).
In short, the higher the value, the easier the remaining schedule.
Remaining home field advantage will be significant here. It can also be true that a better team has an ‘easier’ schedule simply because they do not have to play themselves. Likewise, a bad team may have a ‘harder’ schedule because they also do not play themselves.
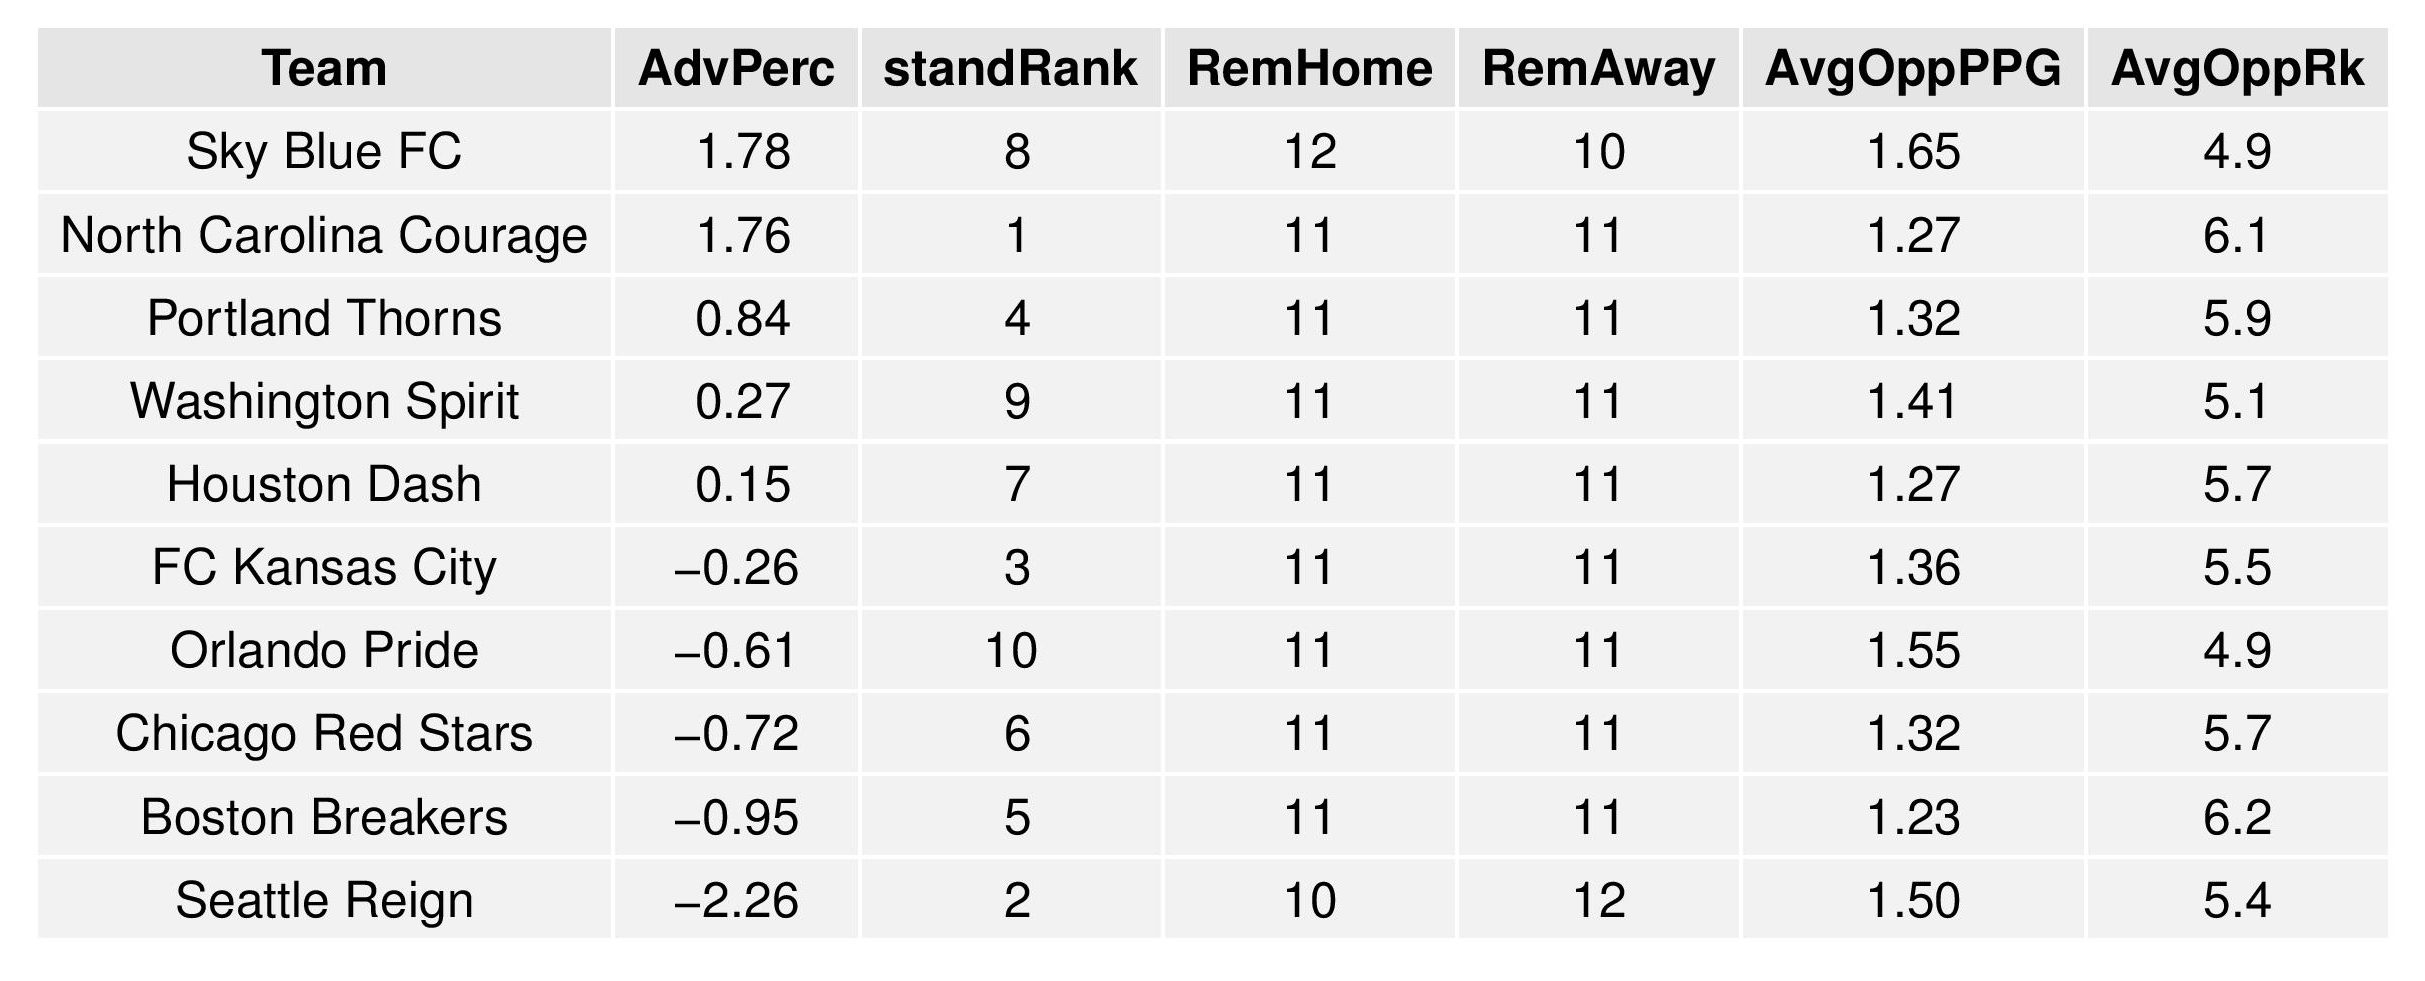
The table following the chart also shares helpful context with these percentages.
Accompanying the advantage percentage in the following table is their current standings rank (right now ties are not properly calculated beyond pts/gd/gf), the remaining home matches, the remaining away matches, the current average points-per-game of future opponents (results-based, not model-based), and the average power ranking of future opponents according to SEBA.
The SEBA Projection System is an acronym for a tortured collection of words in the Statistical Extrapolation Bayesian Analyzer Projection System. Check out the first season’s post to find out how it works (https://phillysoccerpage.net/2017/03/03/2017-initial-seba-projections/)


Comments