
Photo: Nicolae Stoian
As we enter the 2012 season, there are many questions surrounding the Union, but one of the biggest is what to make of our young striker, Danny Mwanga.
After a fantastic rookie year, Mwanga seemed to regress in 2011. He started fewer games and scored fewer goals than he did his rookie year, and his appearances were inconsistent: during some games he looked like an absolute world-beater, while more often he was anonymous. The Union’s signing of Costa Rican international Josué Martinez led to a surprising rumor on the eve of the MLS SuperDraft: that the Union were considering trading Mwanga, the team’s first No. 1 pick. Even more bizarre: some Union fans were advocating for such a move.
These people, I assure you, are bonkers.
There are four elite young goalscorers in MLS right now. Three of them—Juan Agudelo, Teal Bunbury and Brek Shea—get regular looks from the senior USMNT.
The other is Danny Mwanga.
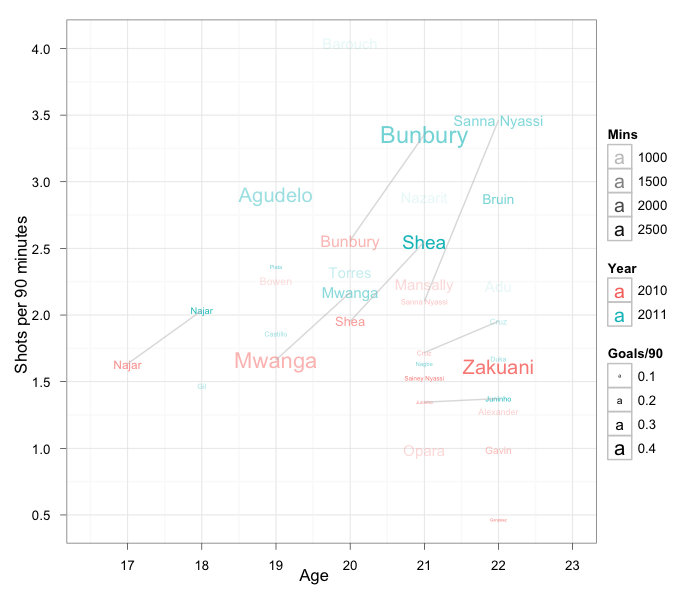
As shown above (big text), Mwanga is young. And he scores goals. In 2010, he scored nearly once every two full games (0.43 goals every 90 minutes); in 2011, that number went down to nearly once in every three. He is in the neighborhood with Agudelo, Bunbury and Shea. And in some ways, he’s better than any of them.
Mwanga is a very accurate shooter: over 53% of his shots are on target. This compares favorably to nearly everyone in MLS, much less these young players. Among players with more than two goals over the past two years, only Charlie Davies, Danny Koevermans and Blaise Nkufo are more accurate (and each with a smaller sample size). Accuracy is correlated with goalscoring rate, for obvious reasons. (Some might argue that being too accurate would reduce one’s effectiveness as a goalscorer, but the data don’t support it, so let’s leave that aside for a moment. You have to hit the target to score a goal).
Why did Mwanga seem to regress in 2011? He took more shots in 2011 (2.17 vs. 1.66 per 90 minutes), and put more of them on goal (1.17 vs. 0.86), but his goalscoring rate was down. I attribute it to statistical noise, aka bad luck, aka random chance. If he continues to take more shots, and put a high percentage on target, the goals will come, and no Union fans will support silly rumors about Mwanga’s future in Philadelphia.

Wow, what a graph! Great work.
he’s going to need to shoot more with Le Toux on Bolton. God help us.
I CANNOT BELIEVE the union are shopping LeToux and will pay Adu 600k… this is unreal
Well, when you put it that way … that should be the entire content of a post on PSP. 😉
So the first 98% of this blog post employs excellent use of factual information and statistics (fantastic graph btw), then sums it all up at the end by chalking it up to “random noise”. Ha!! No further analysis necessary on work rate (those heat-based movement charts), inconsistent starting lineups, formation differences, etc. Just simple random noise. Well I look forward to Danny having a massive breakout season in 2012. I’m convinced!
Garner, fair enough. But I don’t have any answers. You have hypotheses to test there. Go for it.
Wait a minute, though. How do you think the heat maps work?
With all due respect (and I do have much respect for the analysis you provided up until the end), I don’t have a soccer blog nor do I have the time to invest in performing such an analysis! My point was that chalking it up to bad luck without a more robust analysis is a bit haphazard (though it’s fine to offer it as a possibility, of course). To my understanding the heat maps track where the players travel throughout the game. Combined with distance-run figures, you can probably get a decent idea of how much distance a player covered and/or which areas they were asked to cover. Comparing Mwanga’s values in games where he scored versus didn’t, or 2010 trends vs 2011 trends, might be an interesting way to proceed. From a purely eyewitness standpoint, Danny seemed much more tentative and slow in 2011 than in 2010, often disappearing for long periods of time. I wonder if this would be reflected in such an analysis? I’d also be more inclined to believe the bad luck angle if his shot locations and work rates were all similar, rather than relying solely on the “on target” aspect. Shooting 50% more from poorer angles and locations may technically be on target but won’t necessarily lead to more goals.
Haha. I don’t have time either. In fact, I fell asleep while writing that last paragraph last night at 2AM.
Your criticism is a fair one. I have no idea why Mwanga’s conversion rate dipped so much in 2011. I glibly wrote it off to noise, which in the absence of other data is probably the best explanation.
That said, all of the things you suggested are great ideas and definitely would be worthwhile to explore. Unfortunately (and much to their own detriment), MLS and OPTA are very proprietary with the data they collect. Distance run? Never seen it from MLS. Even passing numbers can’t be downloaded or even copied/pasted–they have to be copied by hand. We could conceivably look at all those heatmaps and convert them to numbers, but I’ve got a PhD to finish at some point before my wife divorces me.
Looking forward to the day when we can do more sophisticated models like the one you suggest. Until then we’re left with shots on goal.