Below are the 2018 MLS season forecasts using data from games through March 11, 2018.
Interactive Charts
*Hint: If you ever want a sneak peak on forecasts, these charts are often updated earlier than the official post
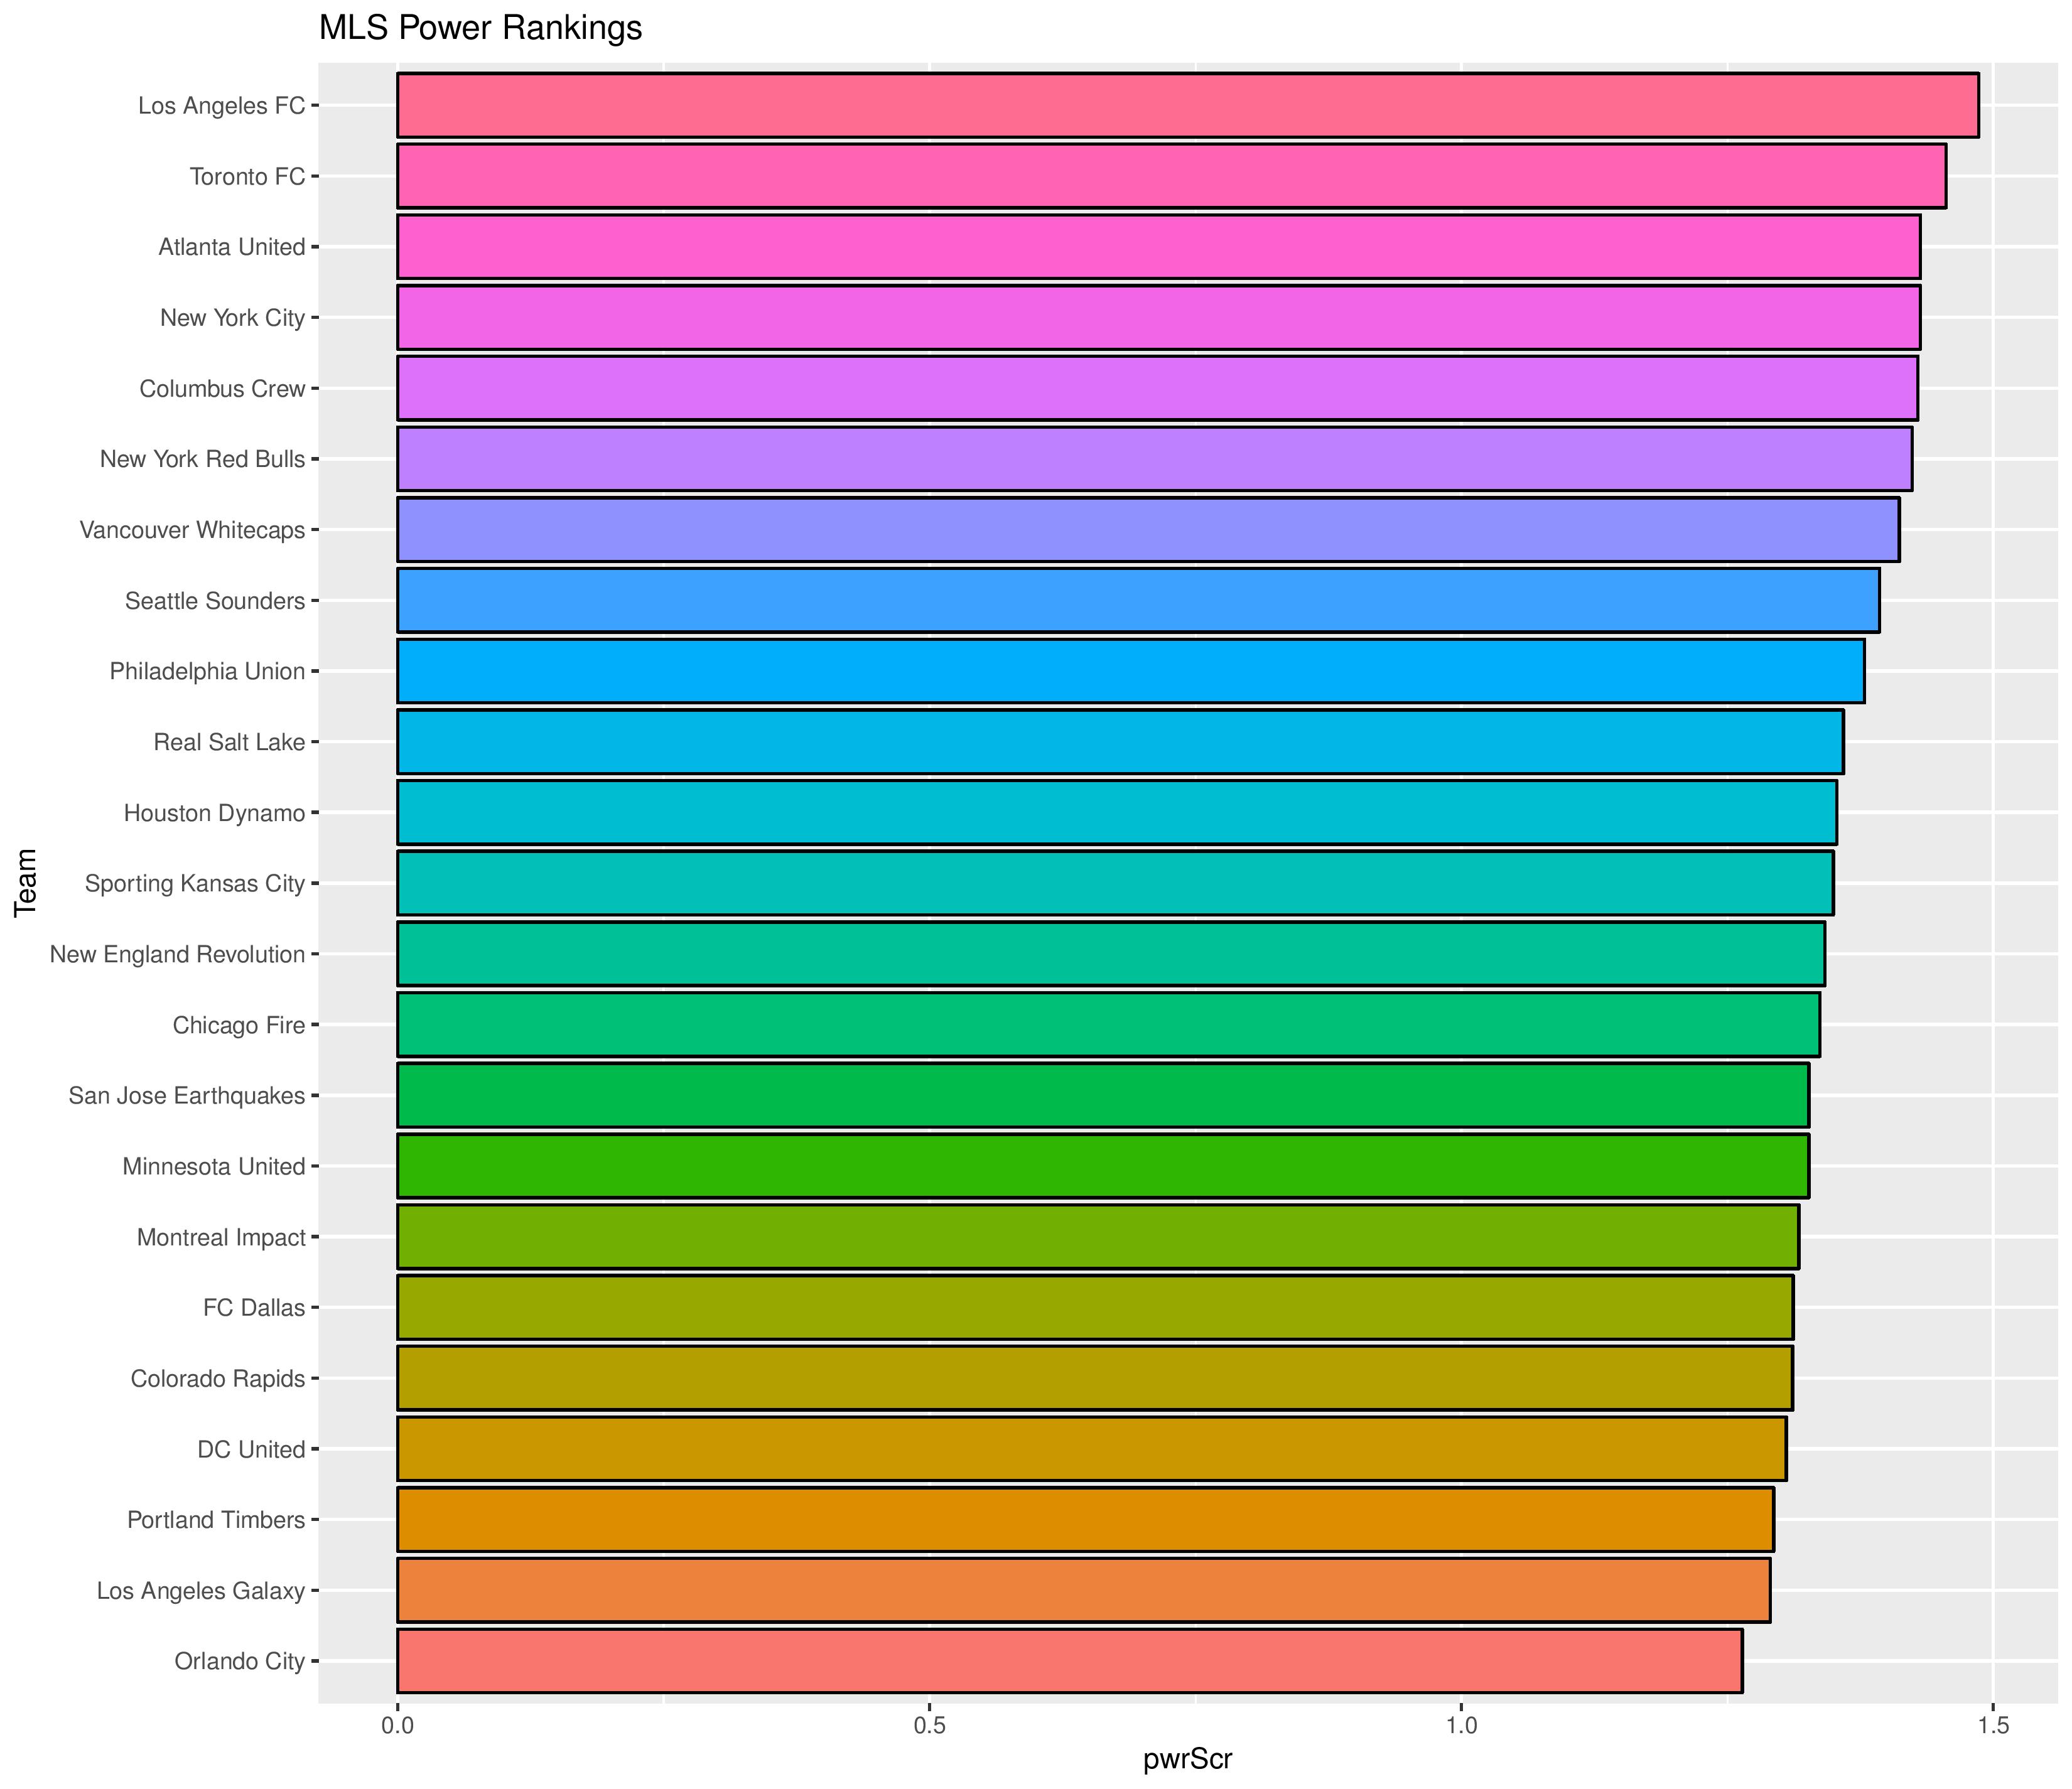
Power Rankings
The “Power Rankings” we concoct are the actual “strength” of the team according to competitive expectations. They are computed showing average expected points result if every team in MLS played every team both home and away.
SEBA has Philadelphia down to 9th from 7th.
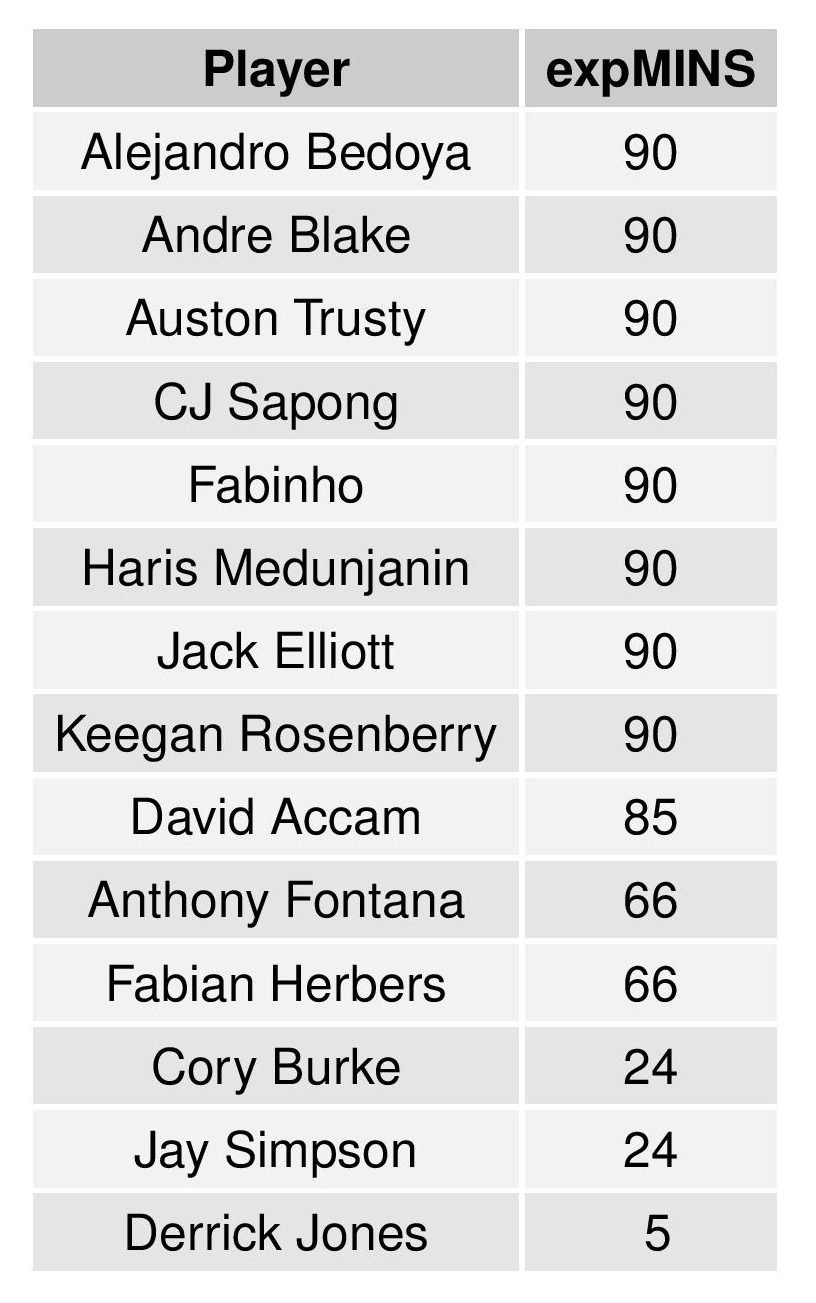
Currently, Philadelphia’s performance expectation is set by the following distribution of minutes:
Philadelphia +/- for 2018
Philadelphia Plus/Minus
| plyr | NetGoals | PlusGoals | MinusGoals | MINS | NetGoalsPer90 | PlusGoalsPer90 | MinusGoalsPer90 |
|---|---|---|---|---|---|---|---|
| Cory Burke | 6 | 29 | 23 | 1427 | 0.378 | 1.829 | 1.451 |
| Alejandro Bedoya | 5 | 49 | 44 | 2777 | 0.162 | 1.588 | 1.426 |
| Jay Simpson | 4 | 4 | 0 | 158 | 2.278 | 2.278 | 0 |
| Mark McKenzie | 3 | 30 | 27 | 1629 | 0.166 | 1.657 | 1.492 |
| Raymon Gaddis | 3 | 43 | 40 | 2298 | 0.117 | 1.684 | 1.567 |
| John McCarthy | 2 | 2 | 0 | 90 | 2 | 2 | 0 |
| Keegan Rosenberry | 2 | 46 | 44 | 2773 | 0.065 | 1.493 | 1.428 |
| Olivier Mbaizo | 1 | 1 | 0 | 85 | 1.059 | 1.059 | 0 |
| Derrick Jones | 1 | 5 | 4 | 385 | 0.234 | 1.169 | 0.935 |
| Haris Medunjanin | 1 | 41 | 40 | 2530 | 0.036 | 1.458 | 1.423 |
| Warren Creavalle | 0 | 11 | 11 | 681 | 0 | 1.454 | 1.454 |
| Marcus Epps | 0 | 10 | 10 | 609 | 0 | 1.478 | 1.478 |
| Auston Trusty | -1 | 49 | 50 | 3060 | -0.029 | 1.441 | 1.471 |
| Borek Dockal | -1 | 37 | 38 | 2397 | -0.038 | 1.389 | 1.427 |
| Anthony Fontana | -1 | 1 | 2 | 99 | -0.909 | 0.909 | 1.818 |
| Fafa Picault | -2 | 40 | 42 | 2190 | -0.082 | 1.644 | 1.726 |
| Andre Blake | -3 | 47 | 50 | 2970 | -0.091 | 1.424 | 1.515 |
| Ilsinho | -3 | 13 | 16 | 985 | -0.274 | 1.188 | 1.462 |
| Fabinho | -3 | 7 | 10 | 714 | -0.378 | 0.882 | 1.261 |
| Fabian Herbers | -3 | 4 | 7 | 428 | -0.631 | 0.841 | 1.472 |
| David Accam | -4 | 17 | 21 | 1213 | -0.297 | 1.261 | 1.558 |
| Matthew Real | -4 | 1 | 5 | 236 | -1.525 | 0.381 | 1.907 |
| Jack Elliott | -5 | 18 | 23 | 1430 | -0.315 | 1.133 | 1.448 |
| CJ Sapong | -6 | 31 | 37 | 2321 | -0.233 | 1.202 | 1.435 |
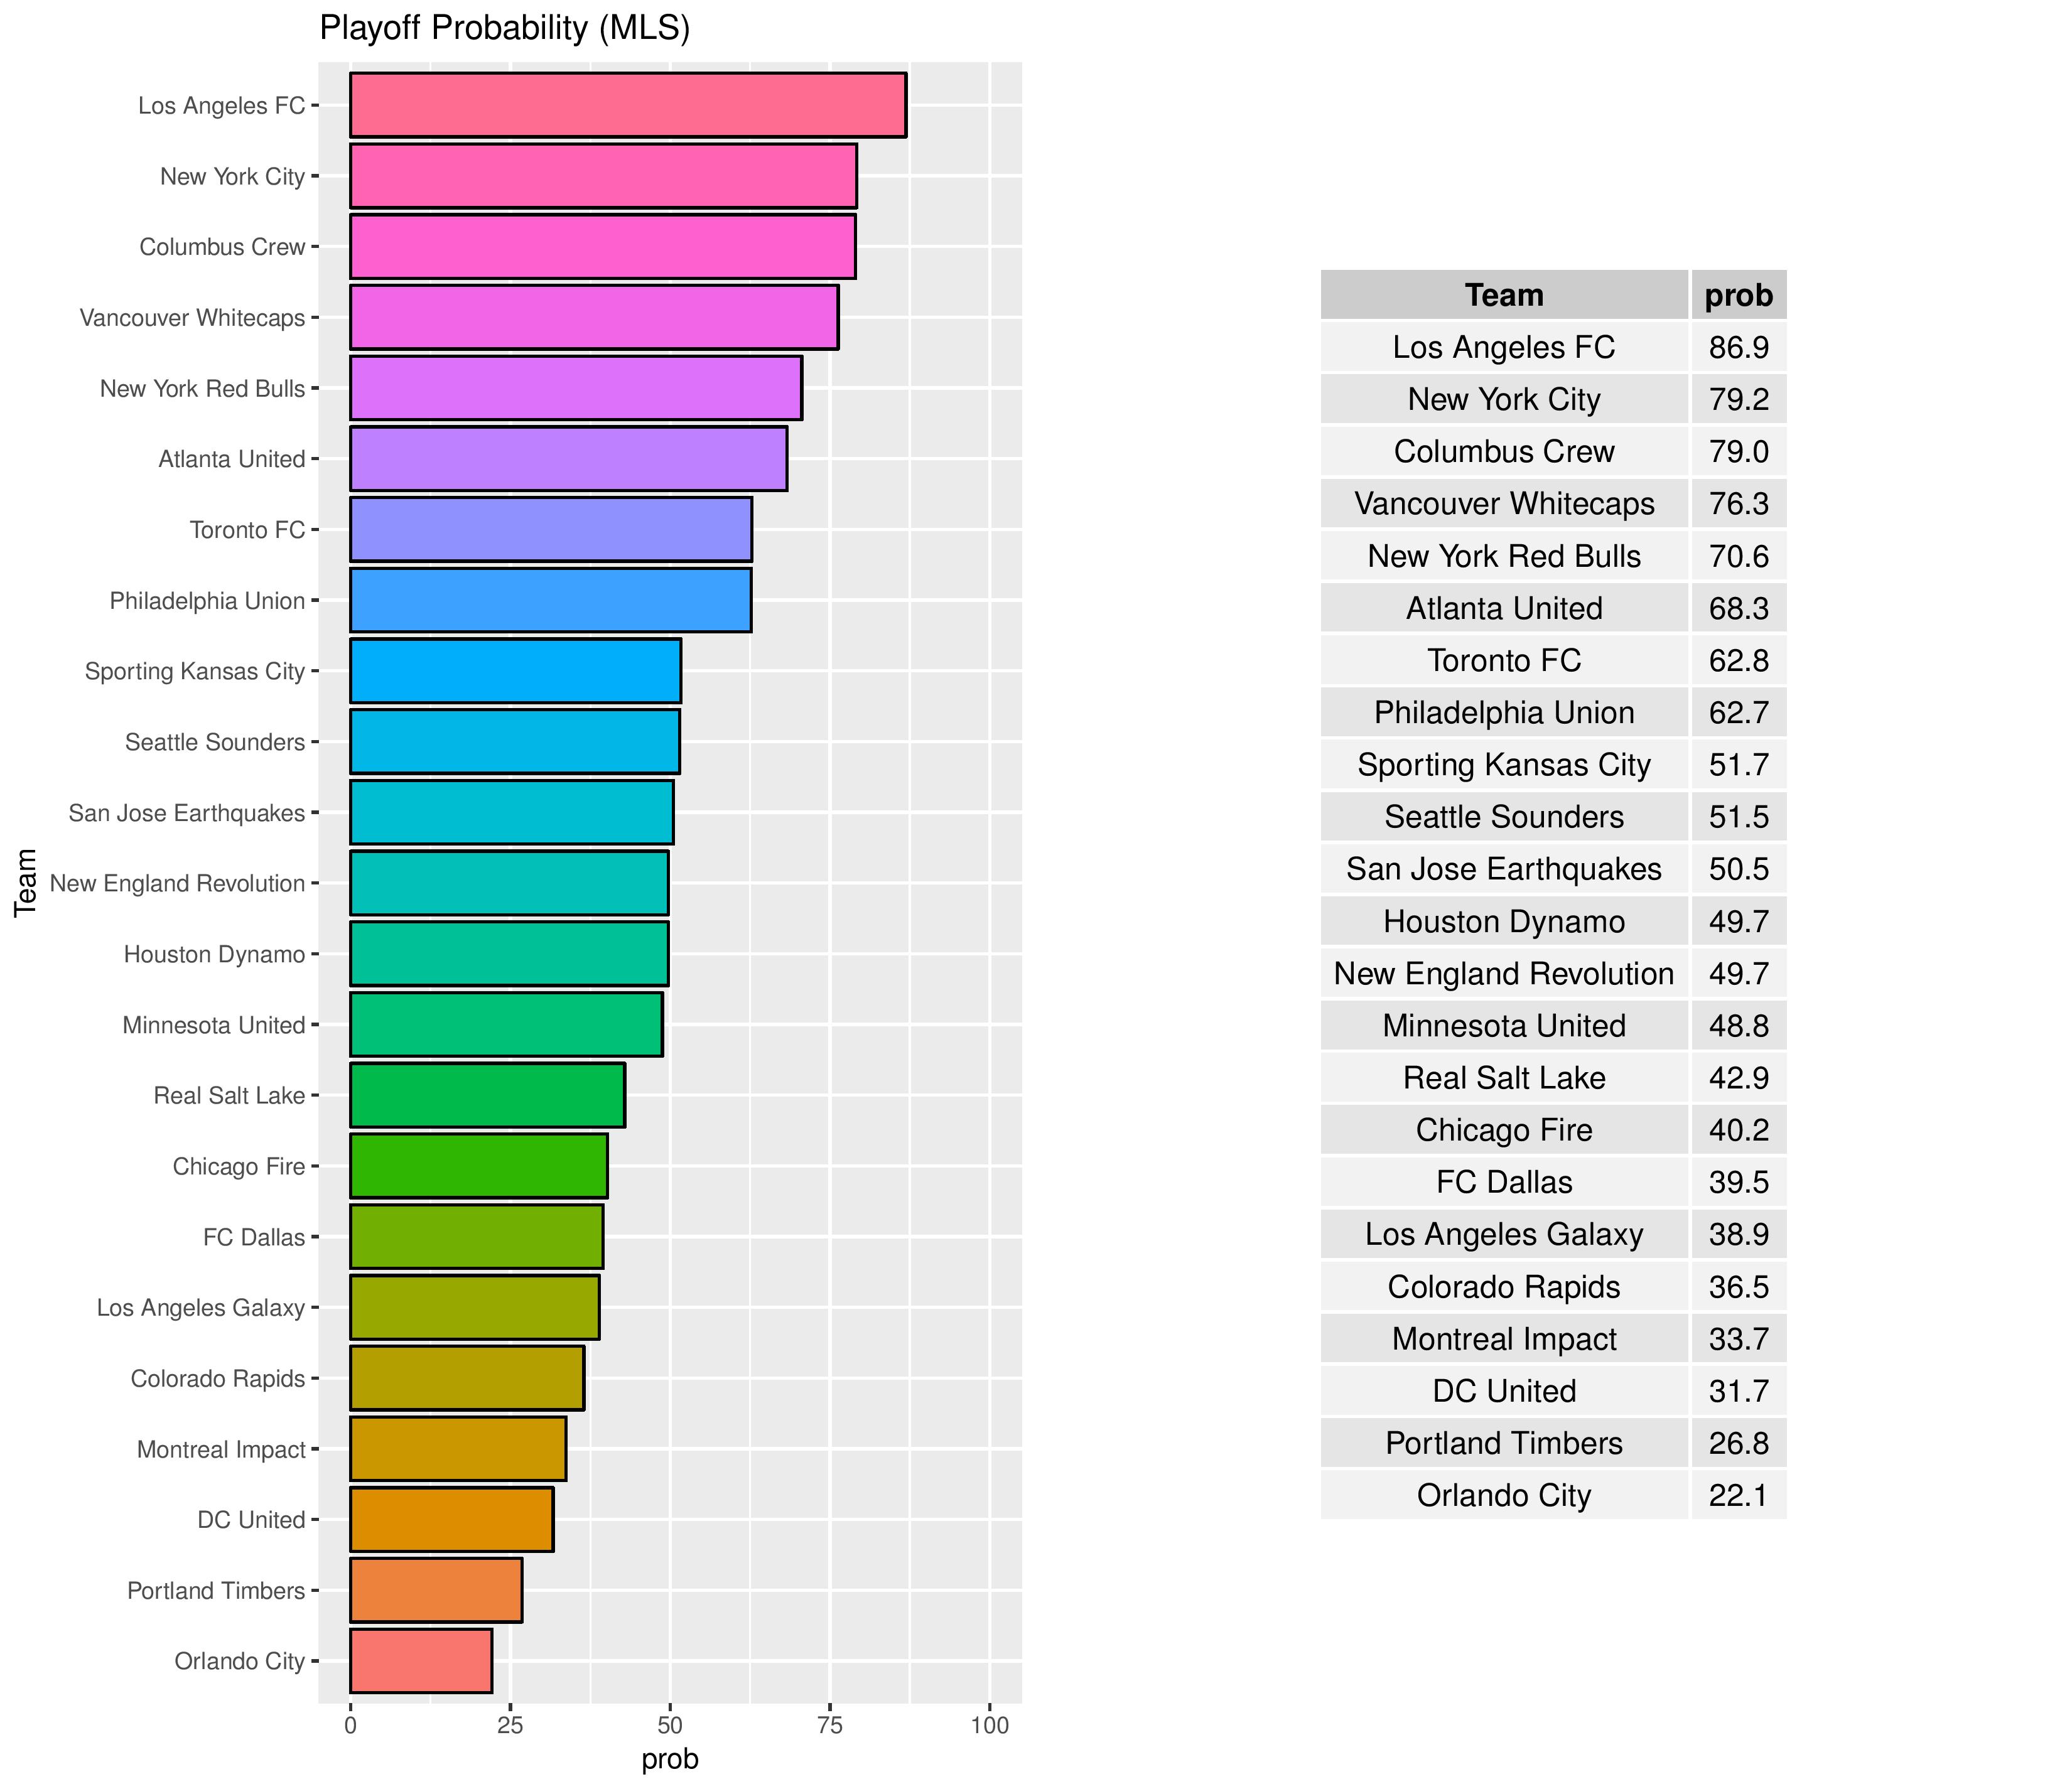
Playoffs probability and more
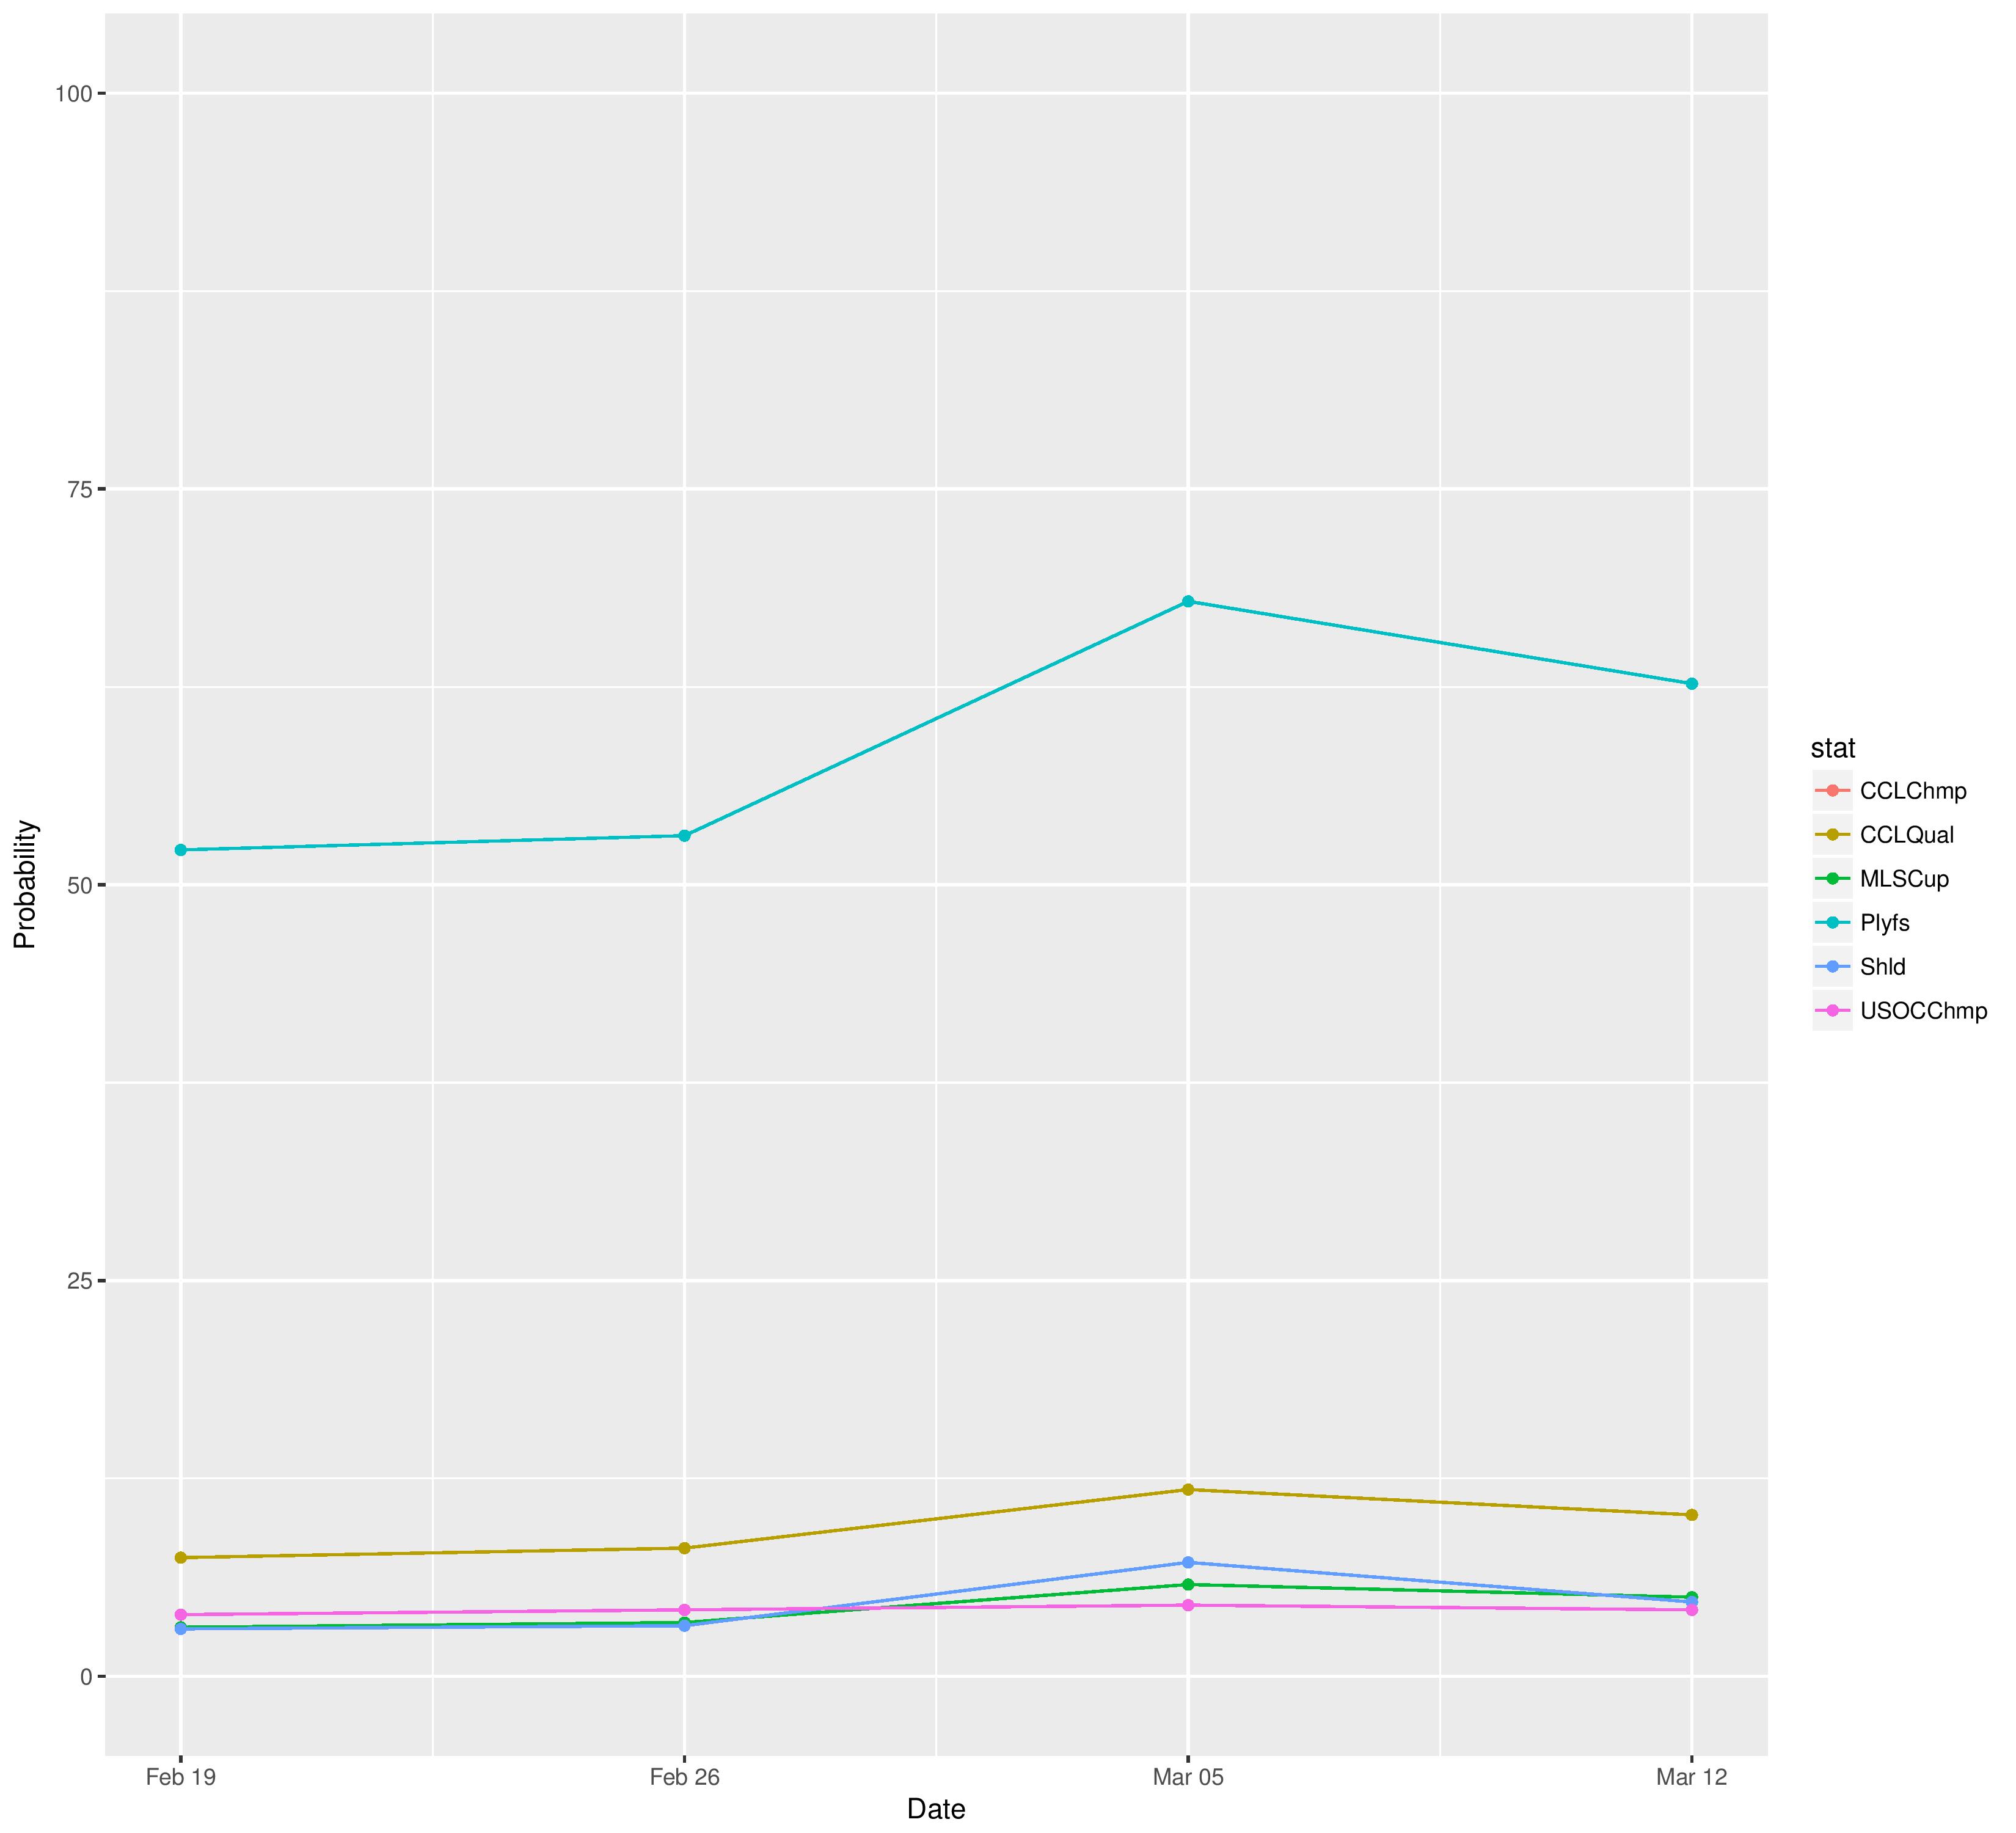
Philadelphia has decreased from a 67.9% to a 62.7% chance of making the playoffs.
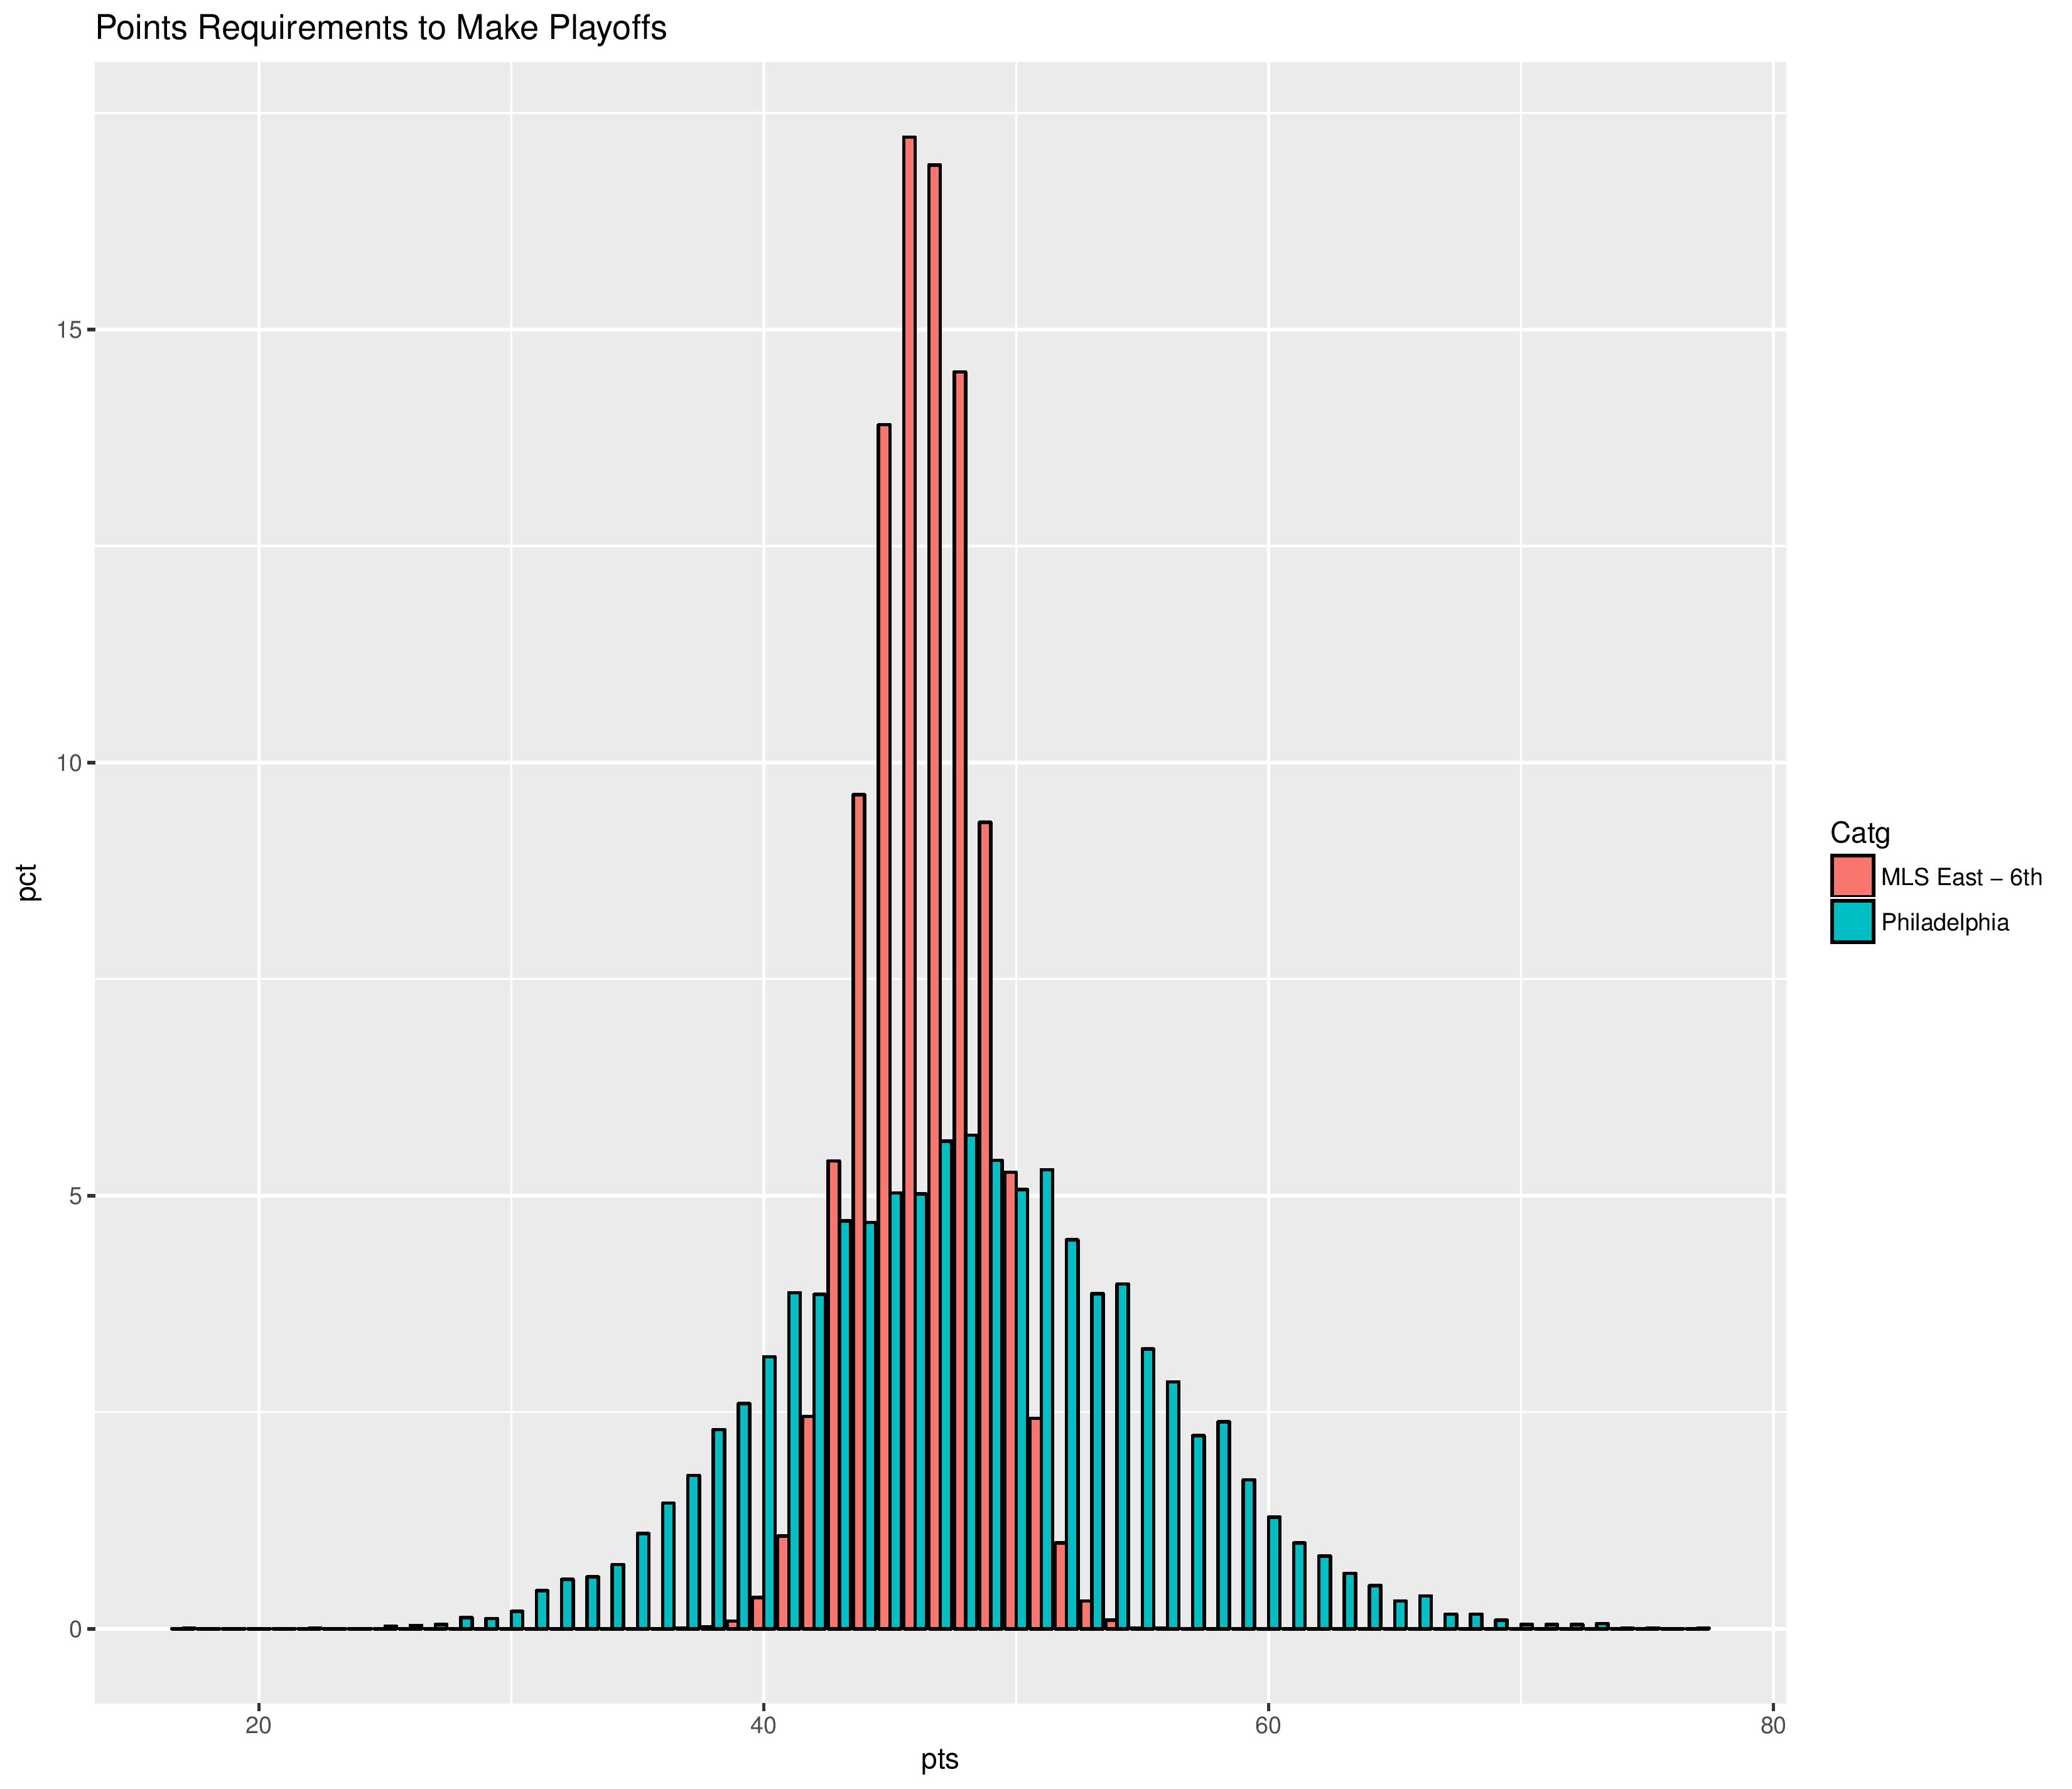
Next is the distribution of Philadelphia’s points against the MLS East’s sixth seed in all the simulations.
Philadelphia decreased from a 7.2% to a 4.7% chance of winning the Supporters’ Shield.

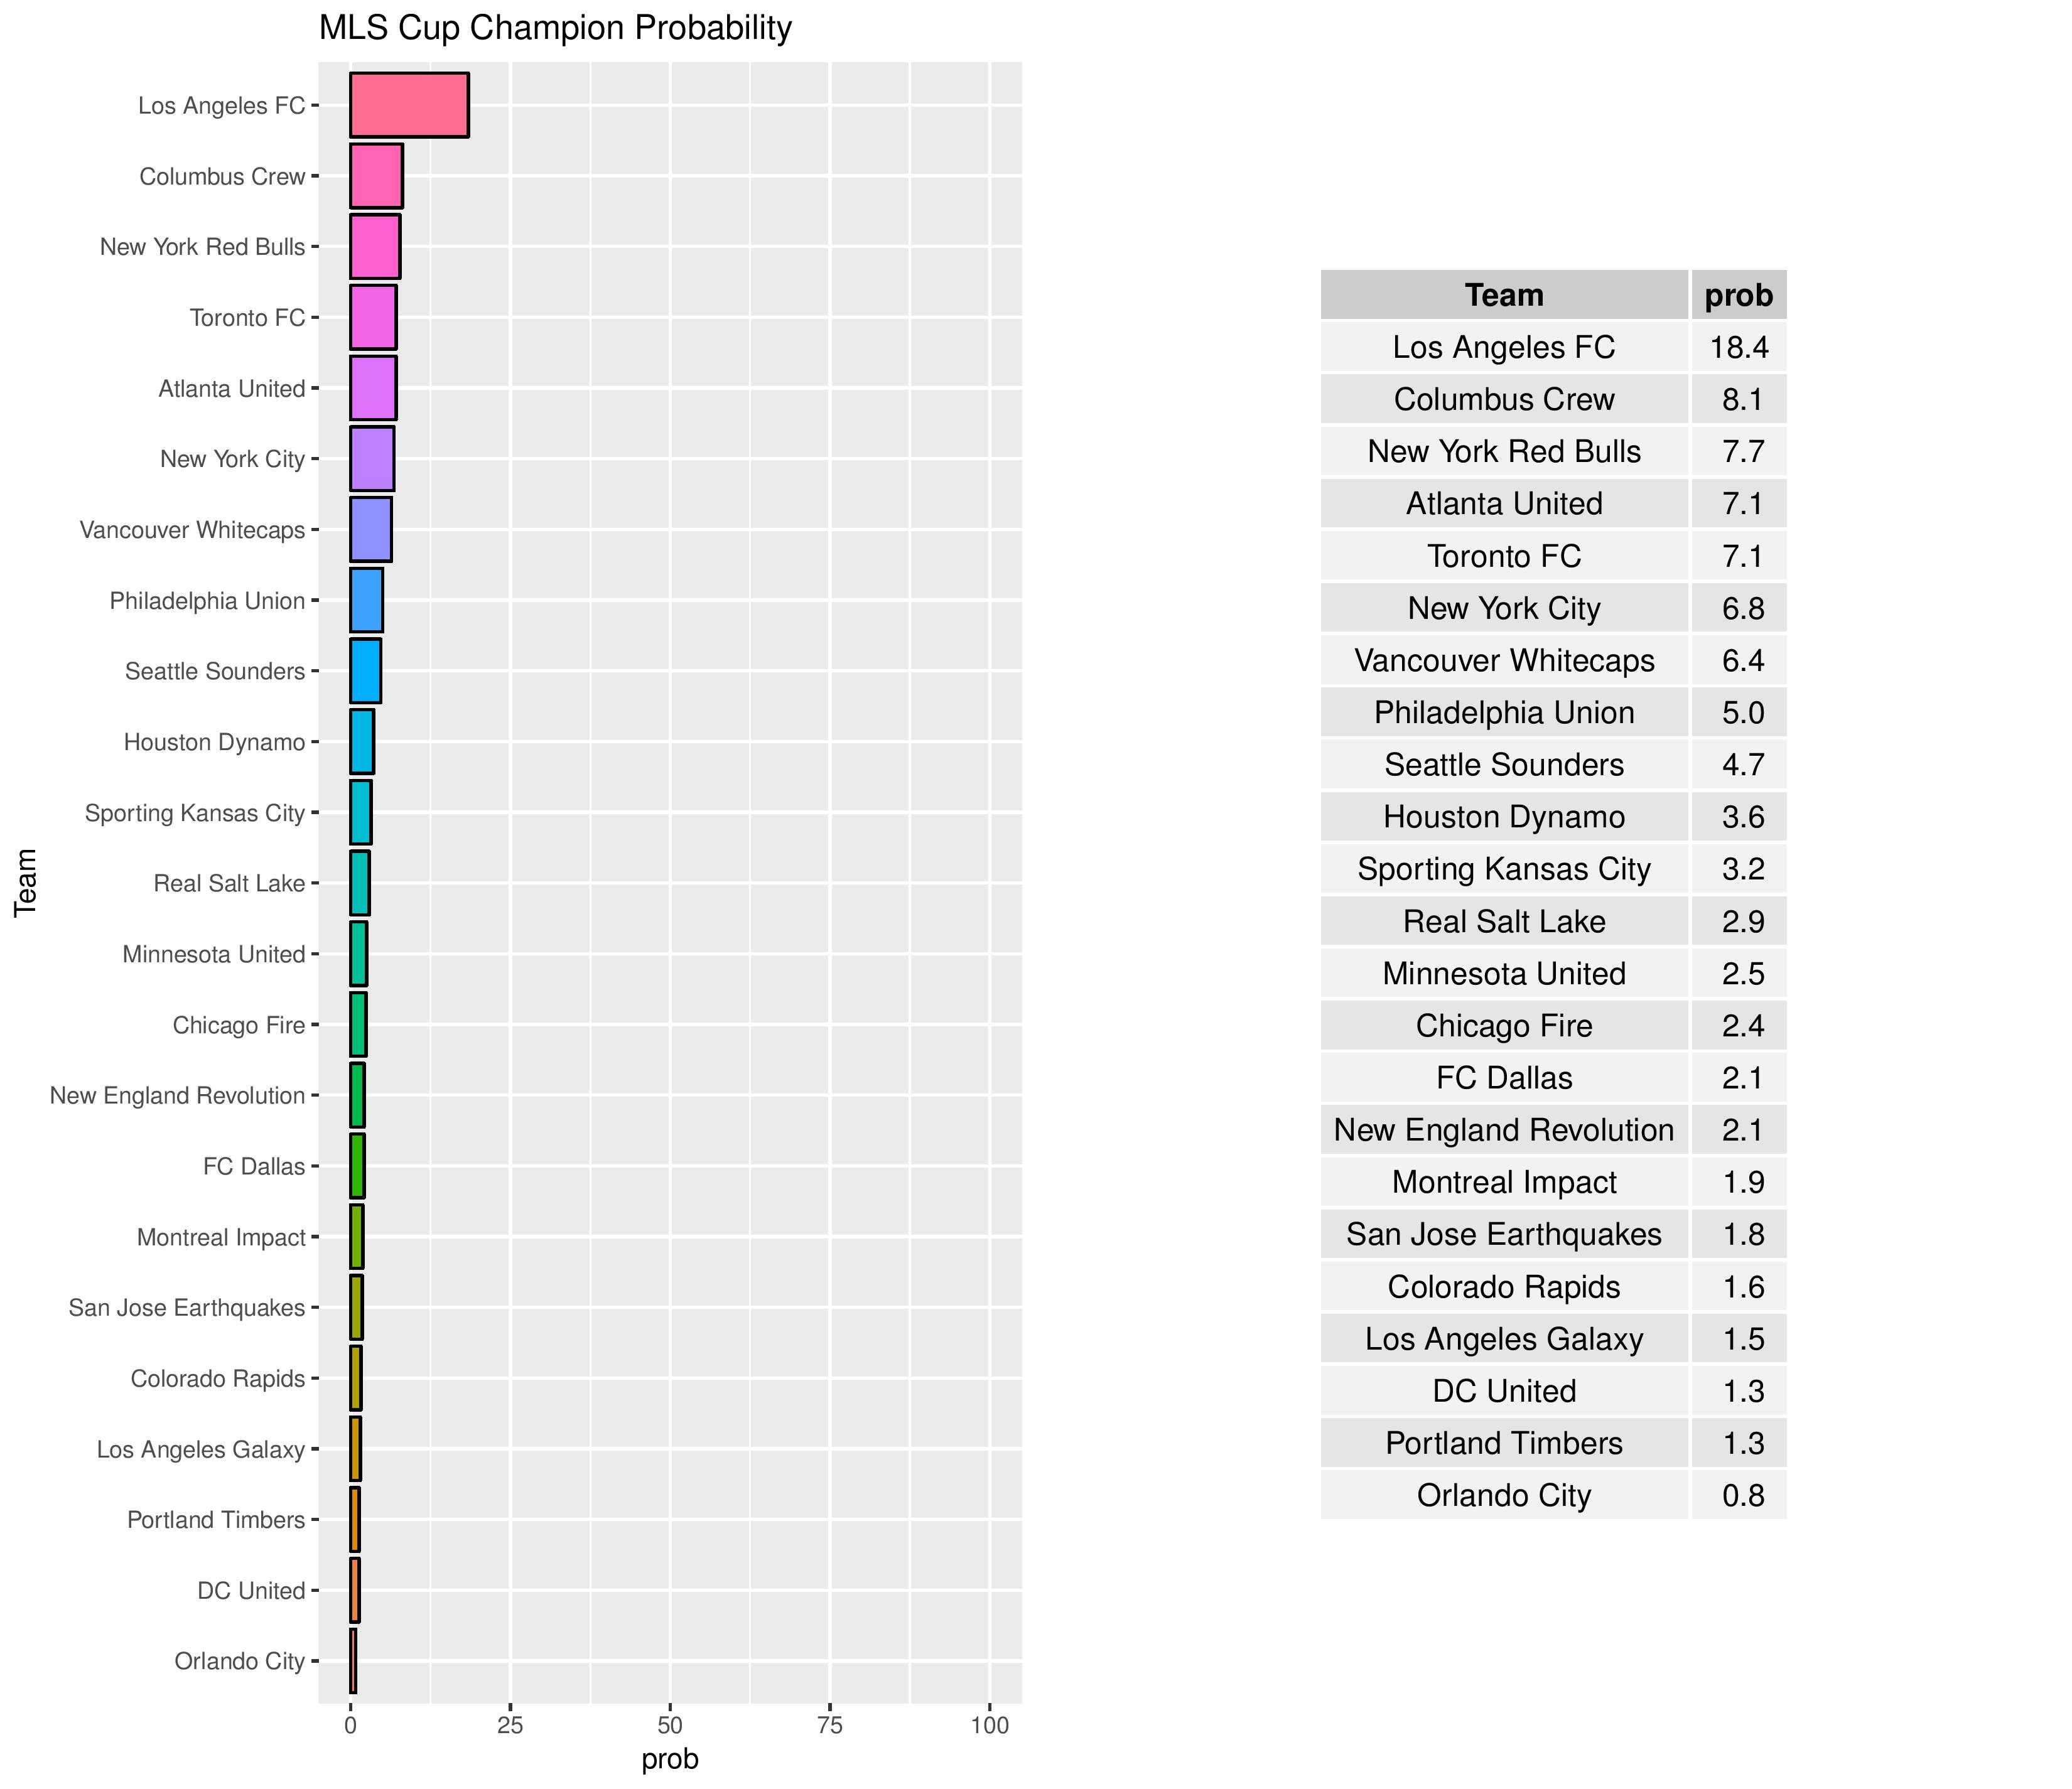
The Union has decreased from a 5.8% to a 5.0% chance of winning the MLS Cup.
* I now have assumed to exclude NASL clubs from USOC as their season was cancelled, and I would guess that those clubs that moved to the NPSL are too late to attempt qualification.
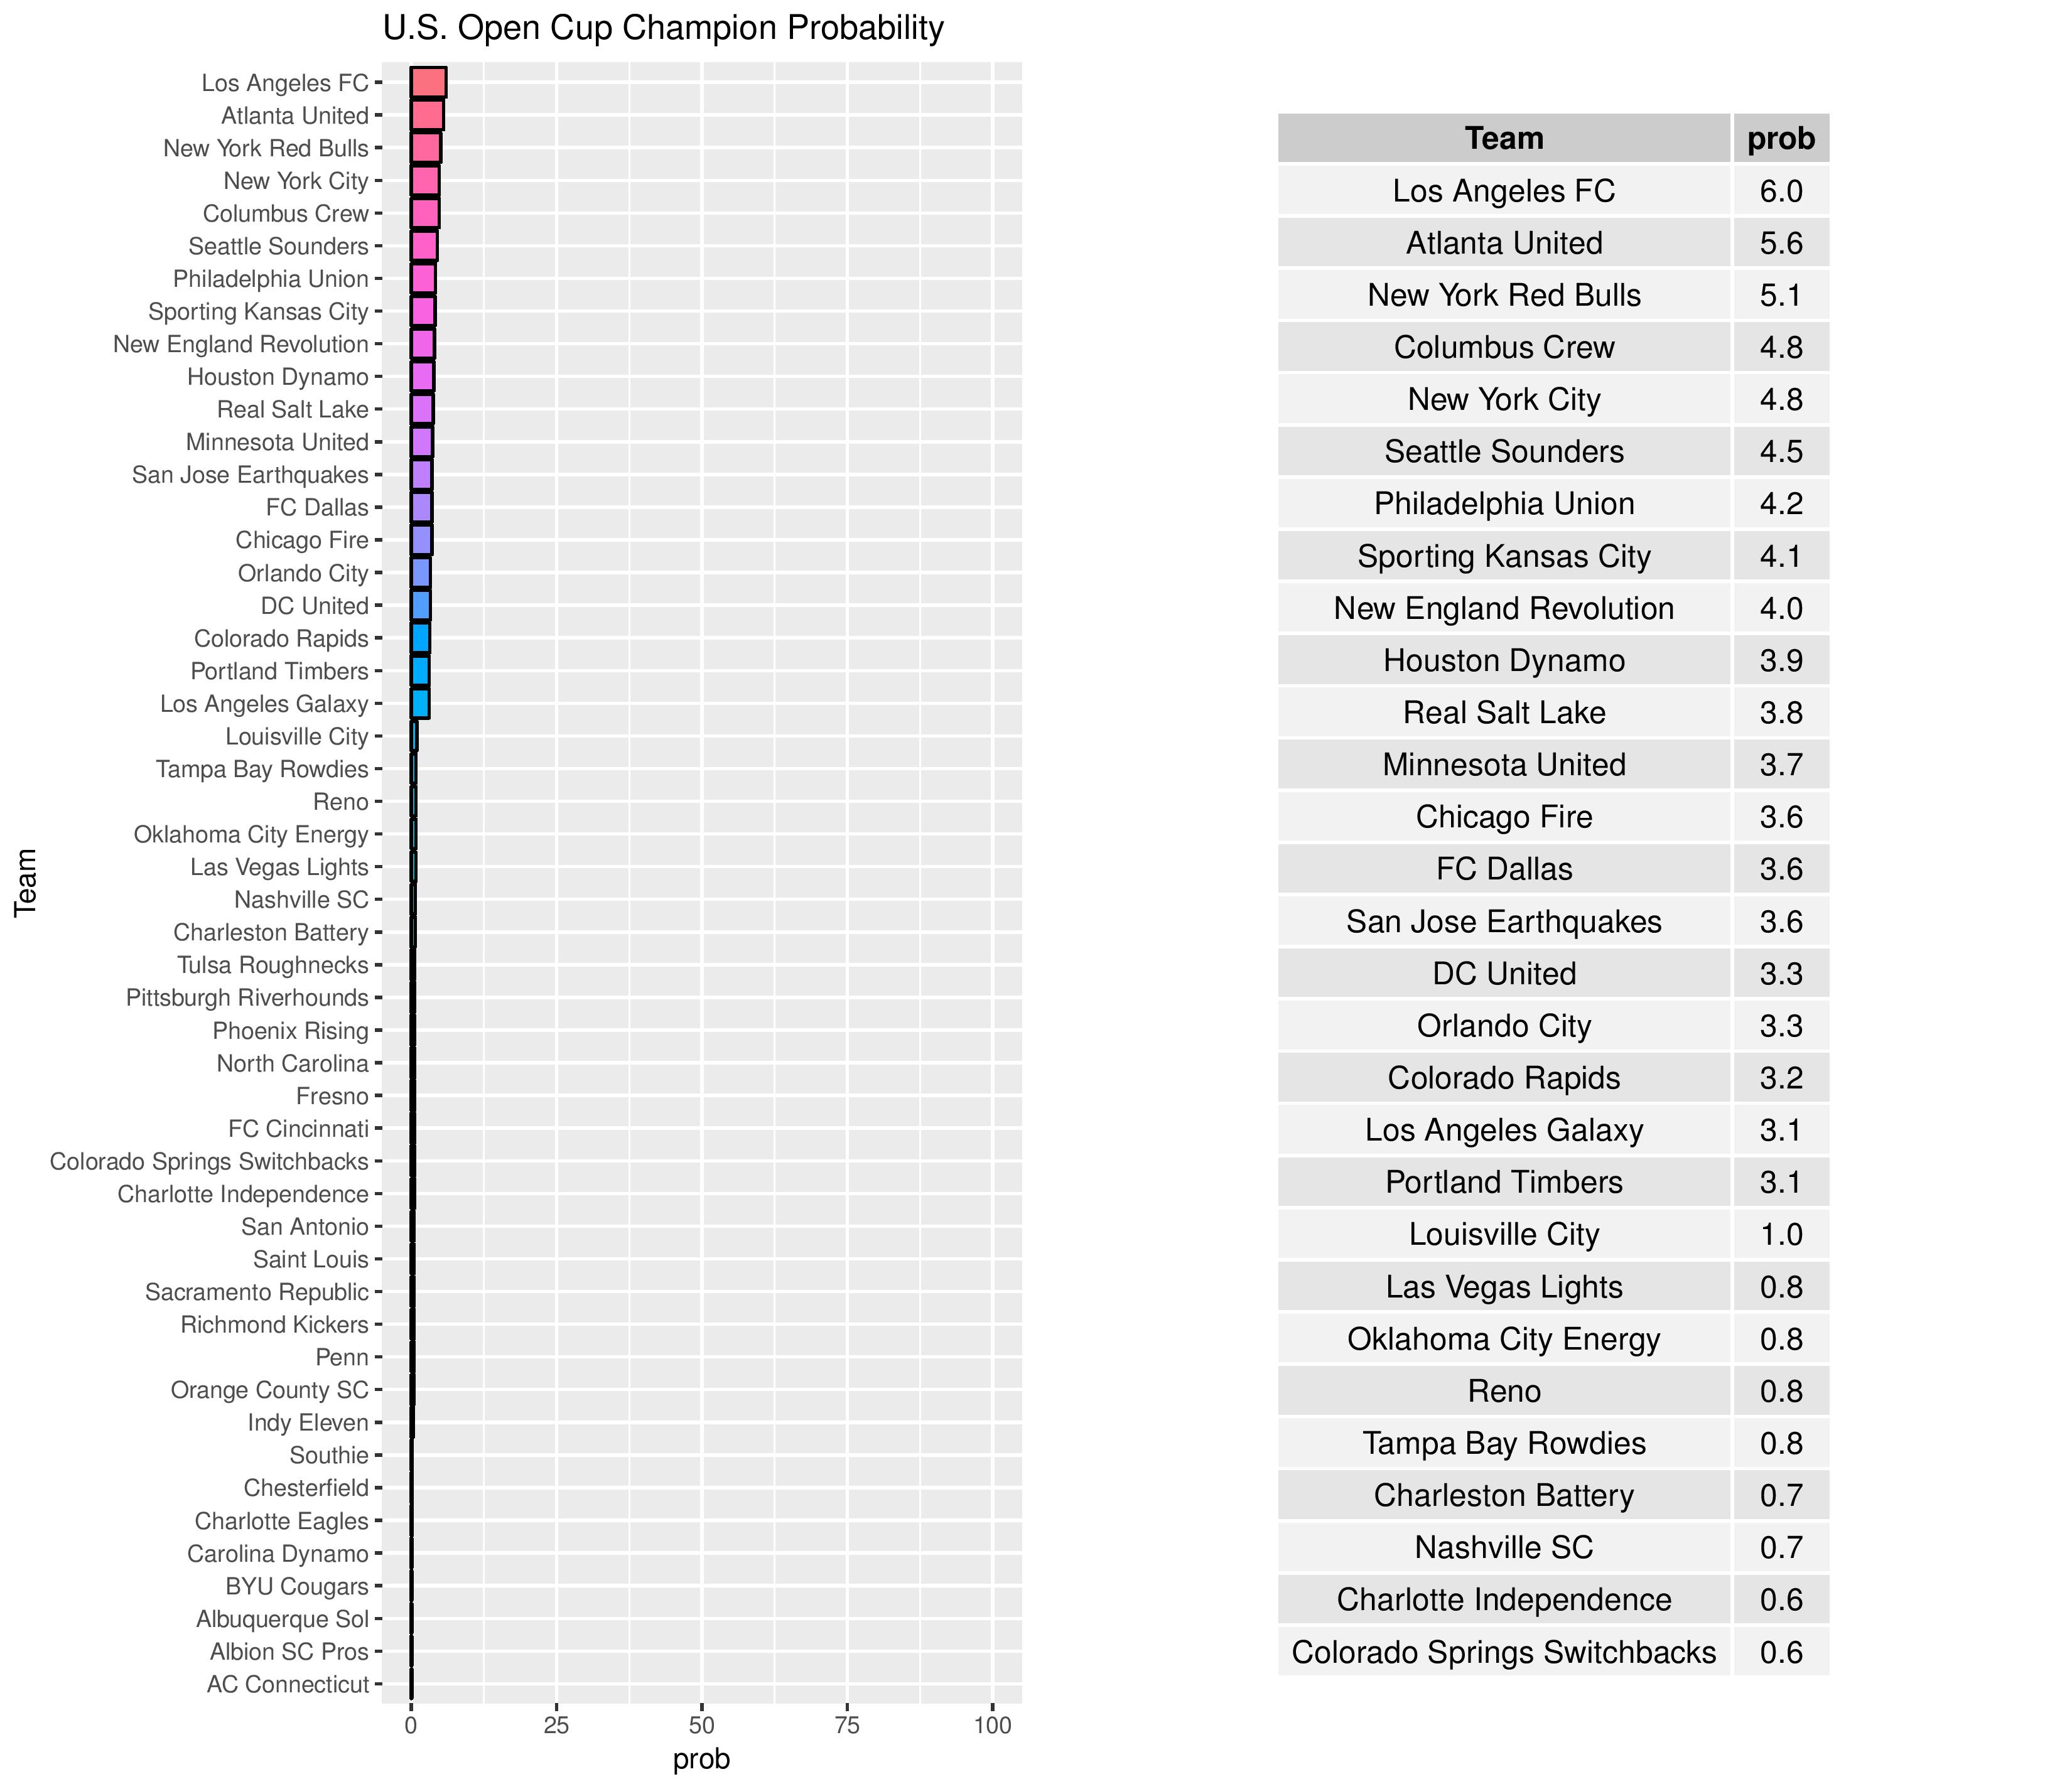
Philadelphia’s chances of having a U.S. Open Cup win decreased from 4.5% to 4.2%.
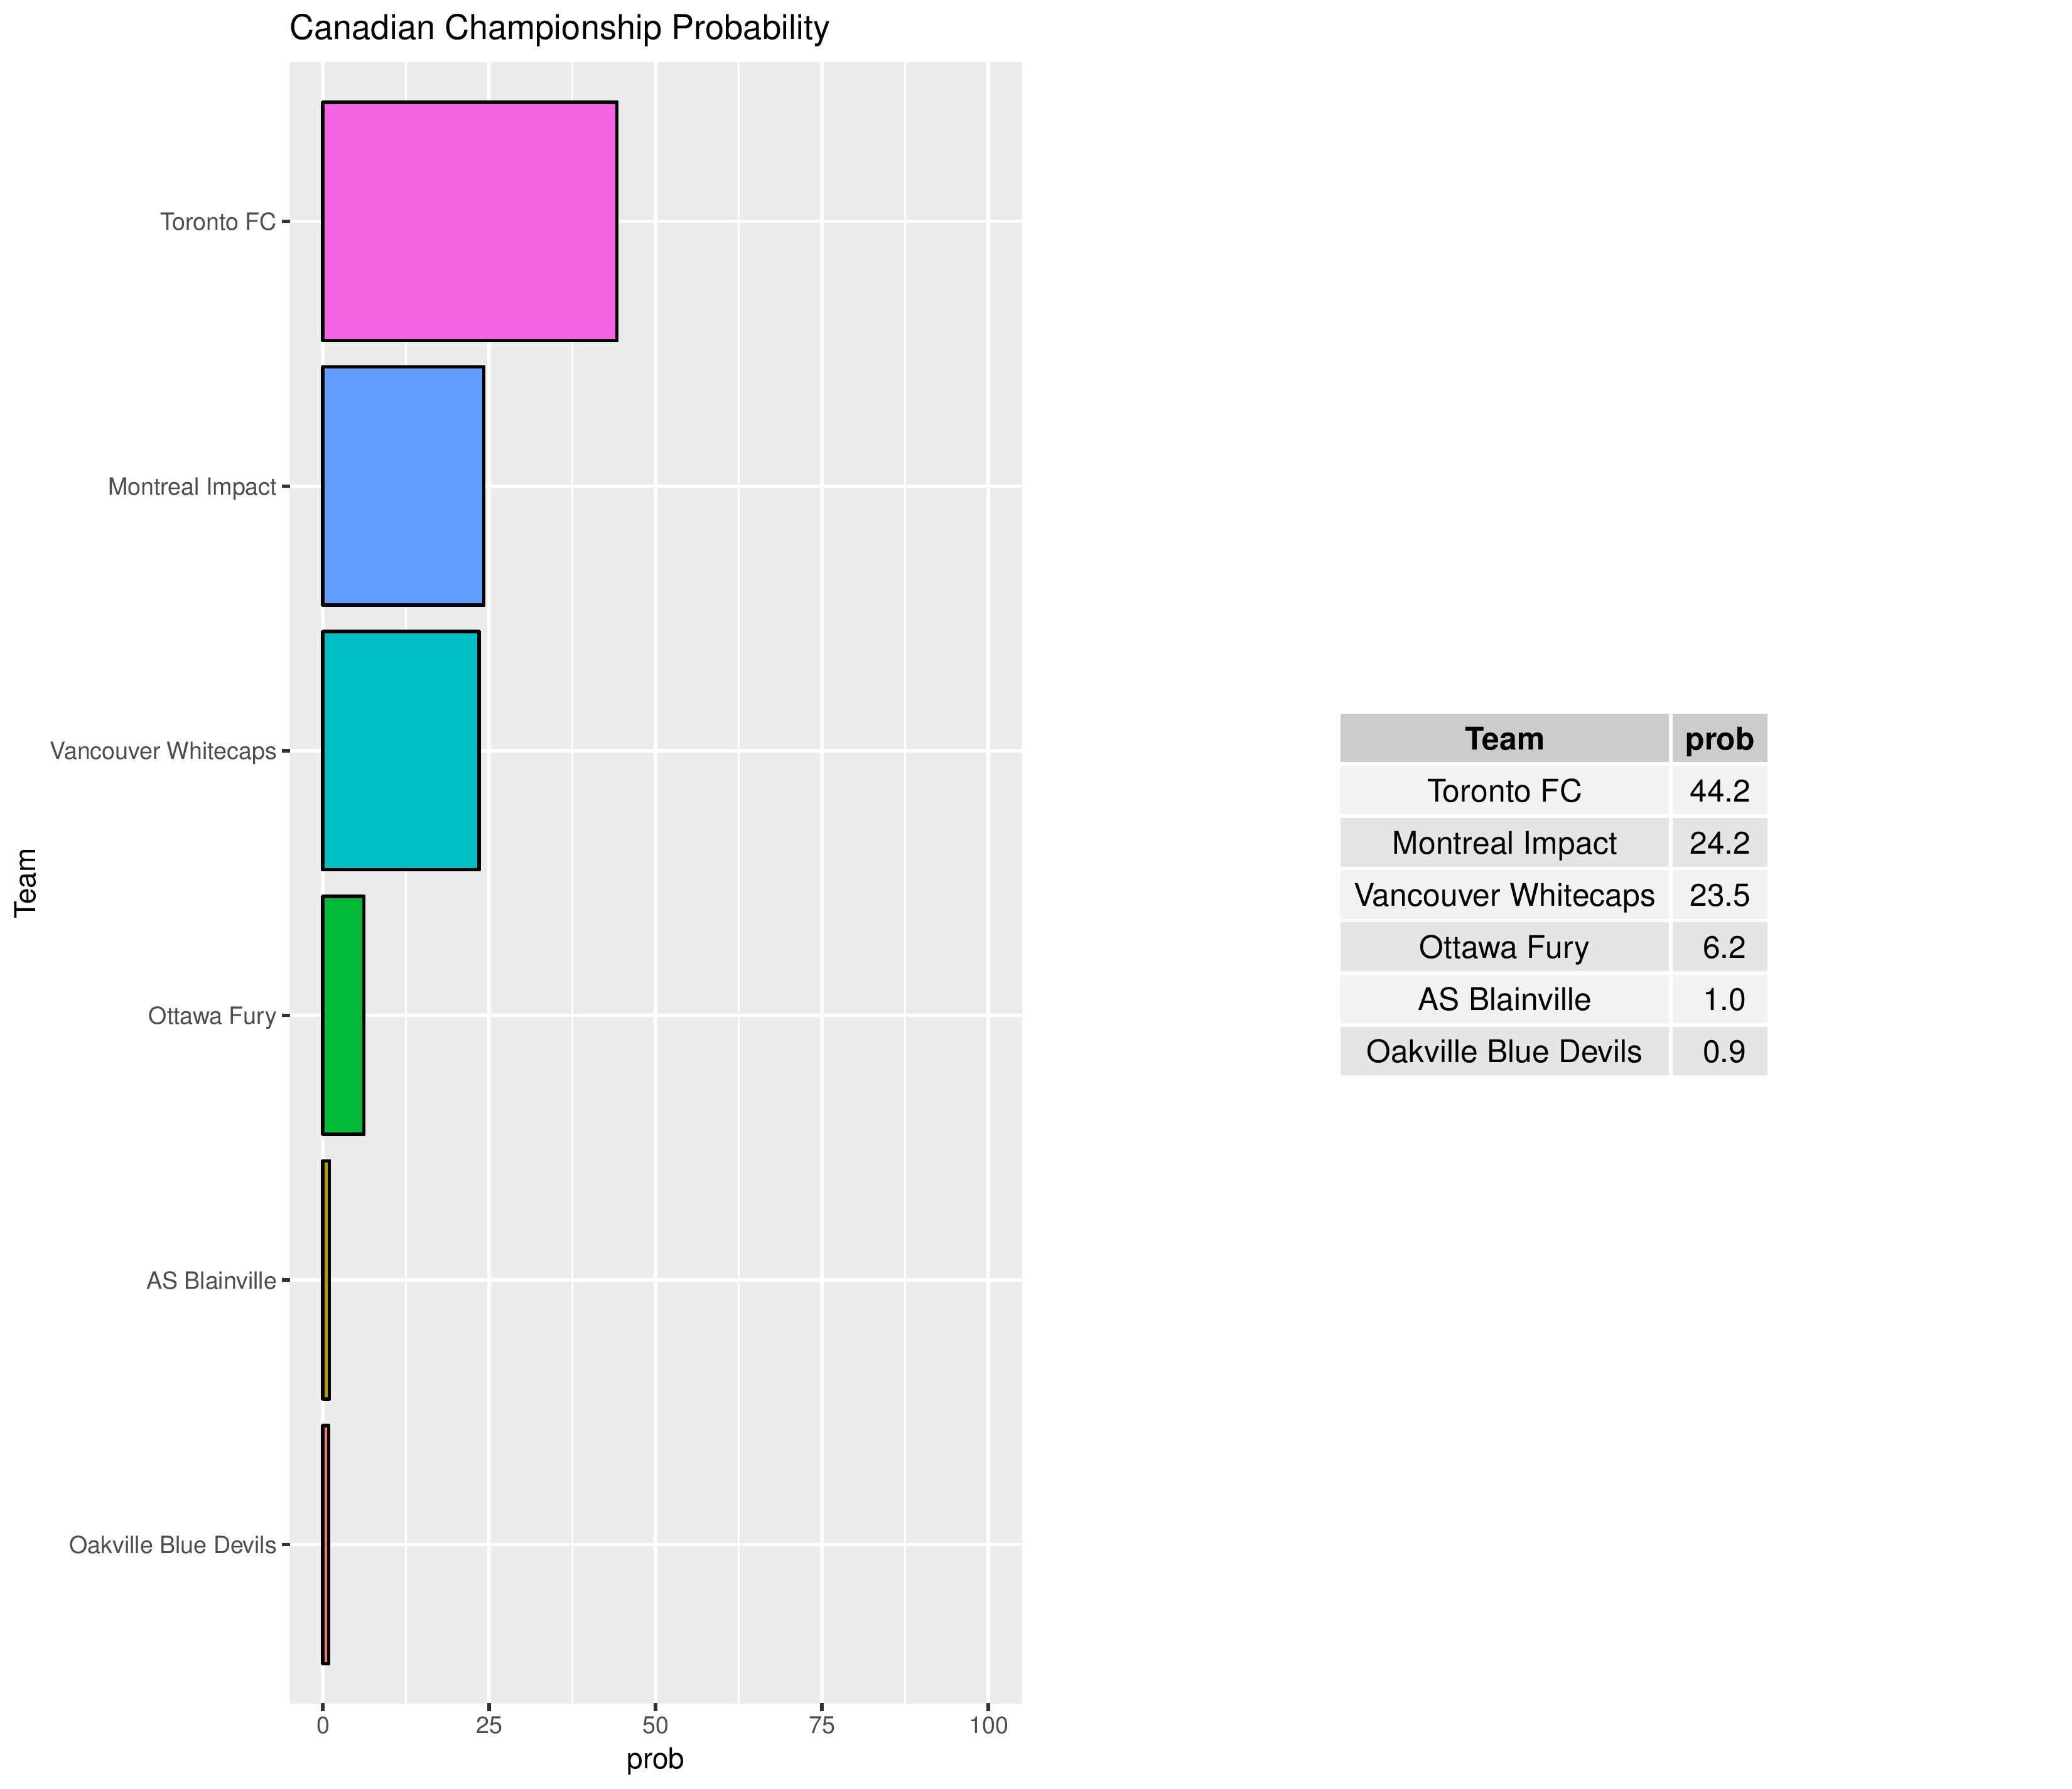
The following 2018 CCL Champion odds do not include Tuesday night’s two matches.
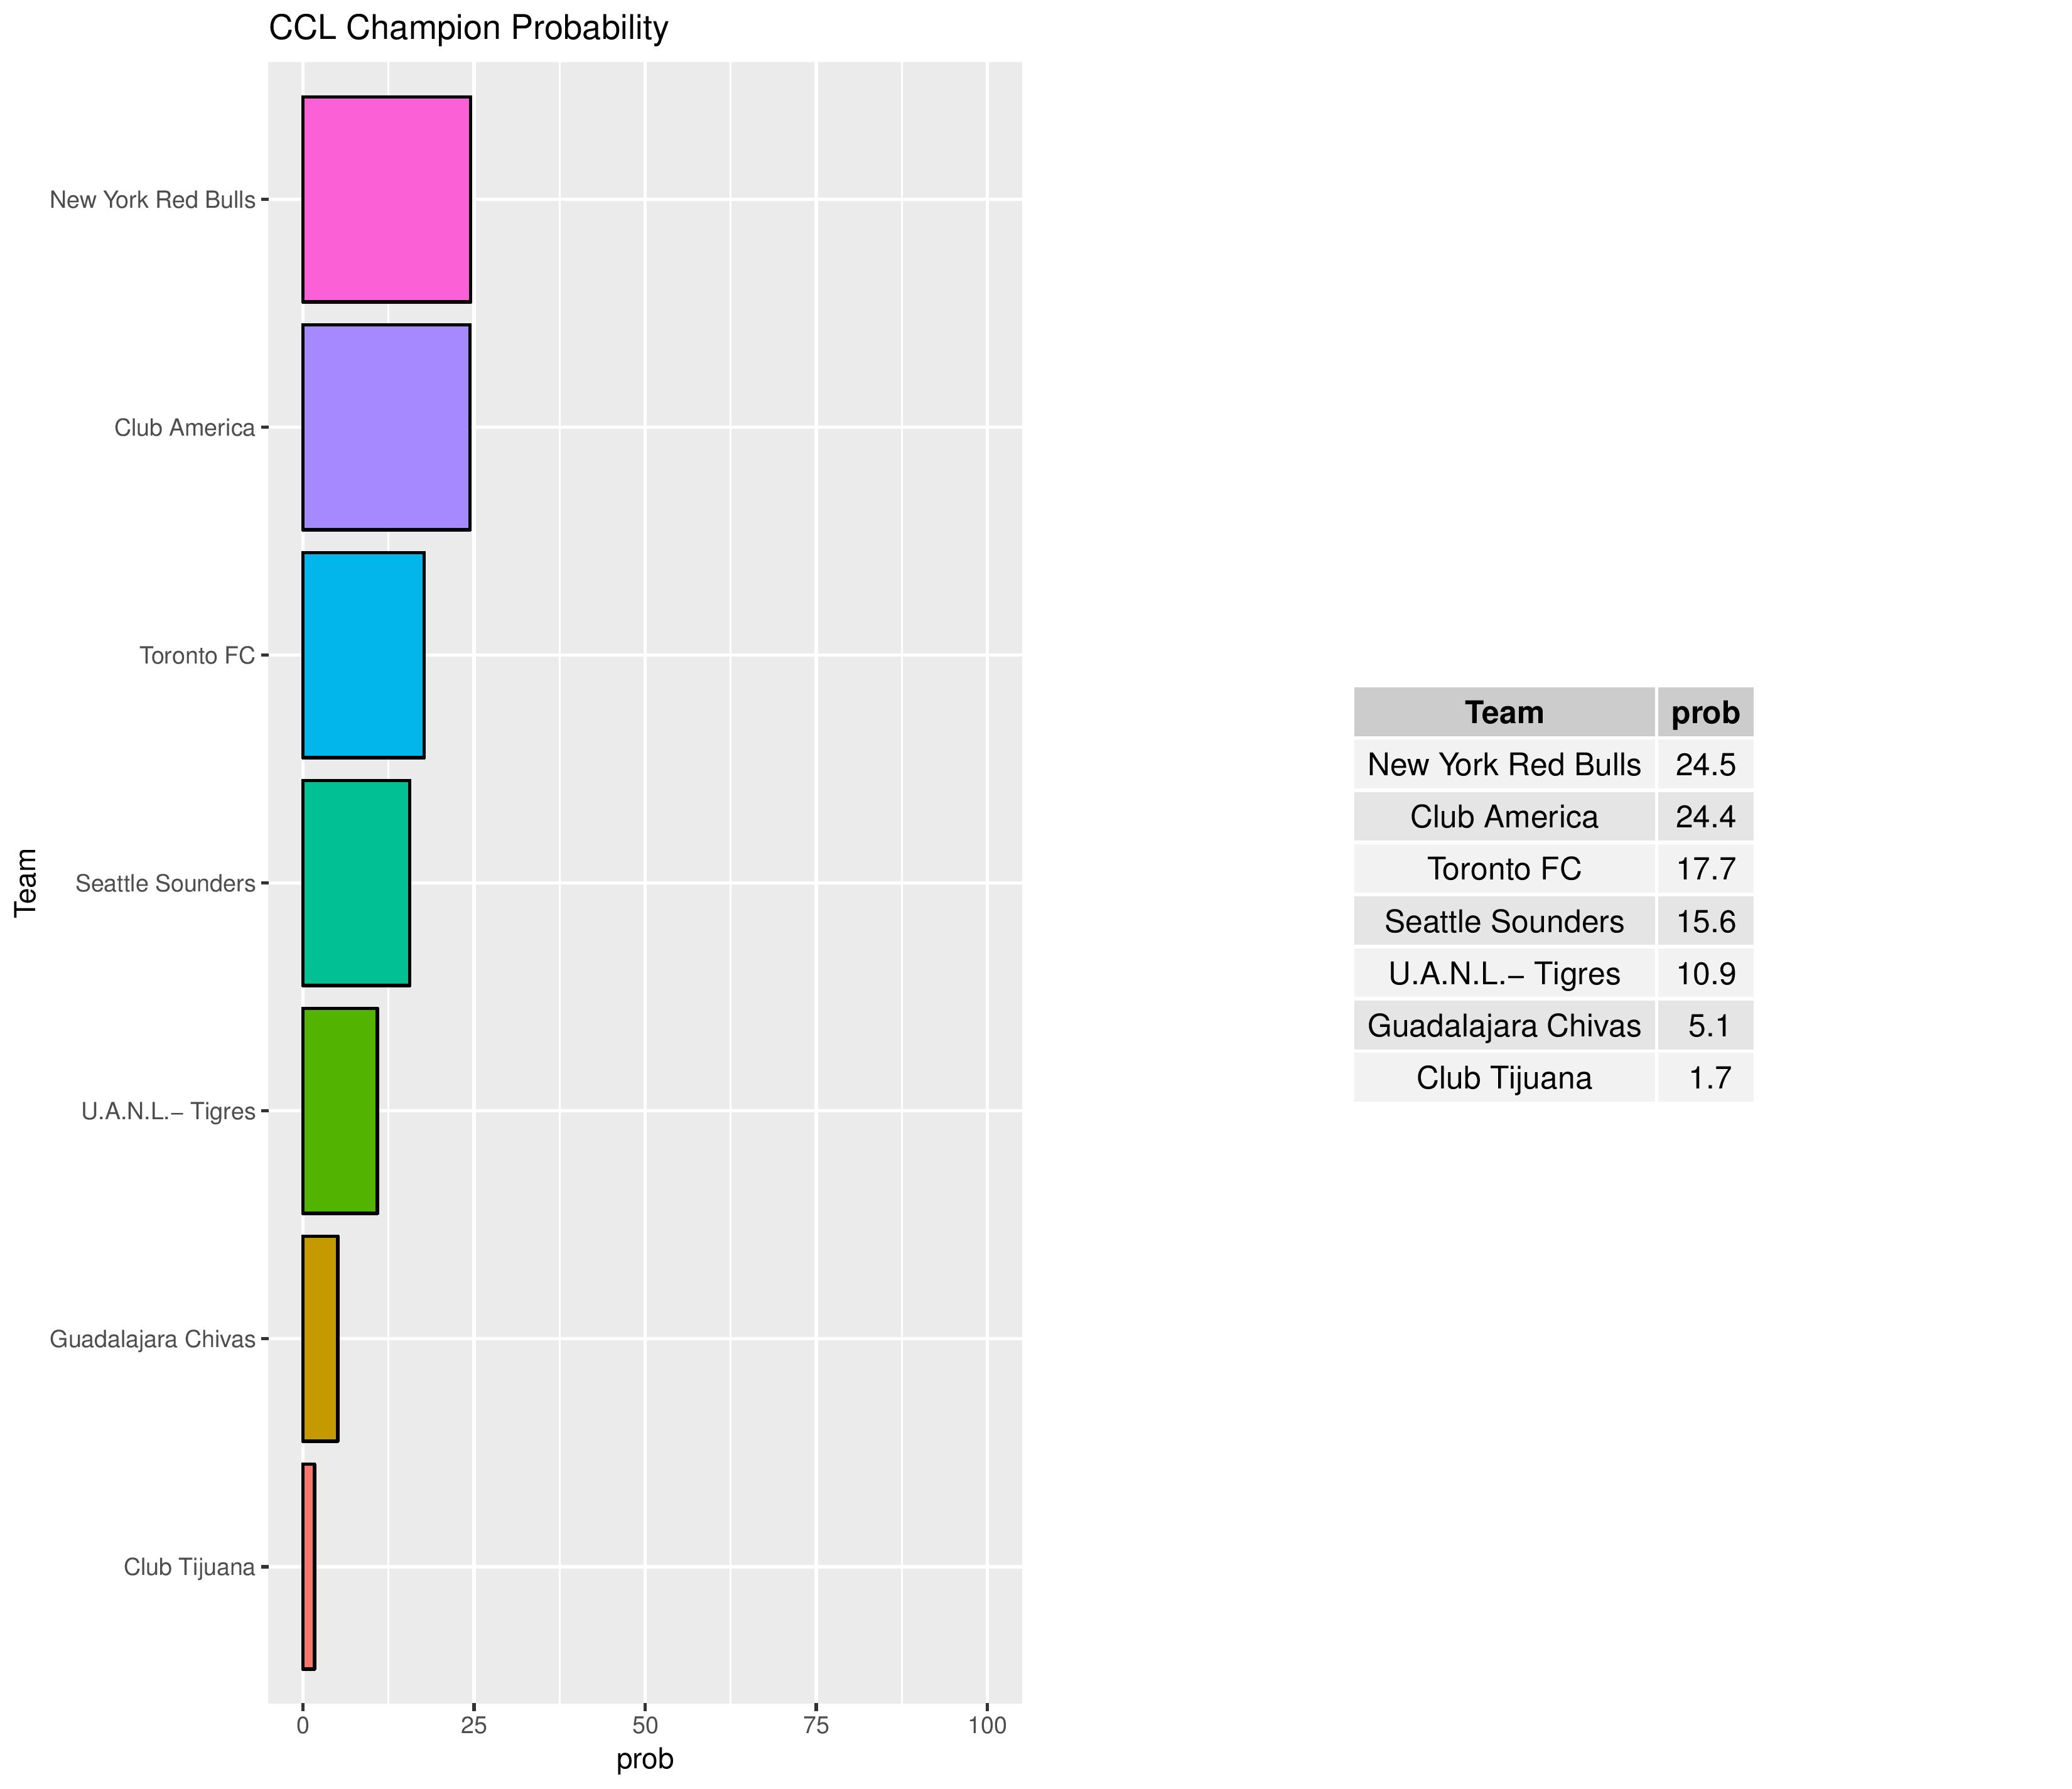
The 2019 CONCACAF Champions League qualification from the U.S. was supposed to be the 2017 & 2018 winners of the U.S. Open Cup and the MLS Cup. This is why Kansas City has already qualified. However, since Toronto (not eligible for a U.S. qualification slot) won the MLS Cup, that slot (and any other future Canadian or Kansas City wins) will be given to the club with the most regular season points over both 2017 and 2018.
Philadelphia has decreased from an 11.8% to a 10.2% chance of qualifying for the 2019 edition of the CONCACAF Champions League.

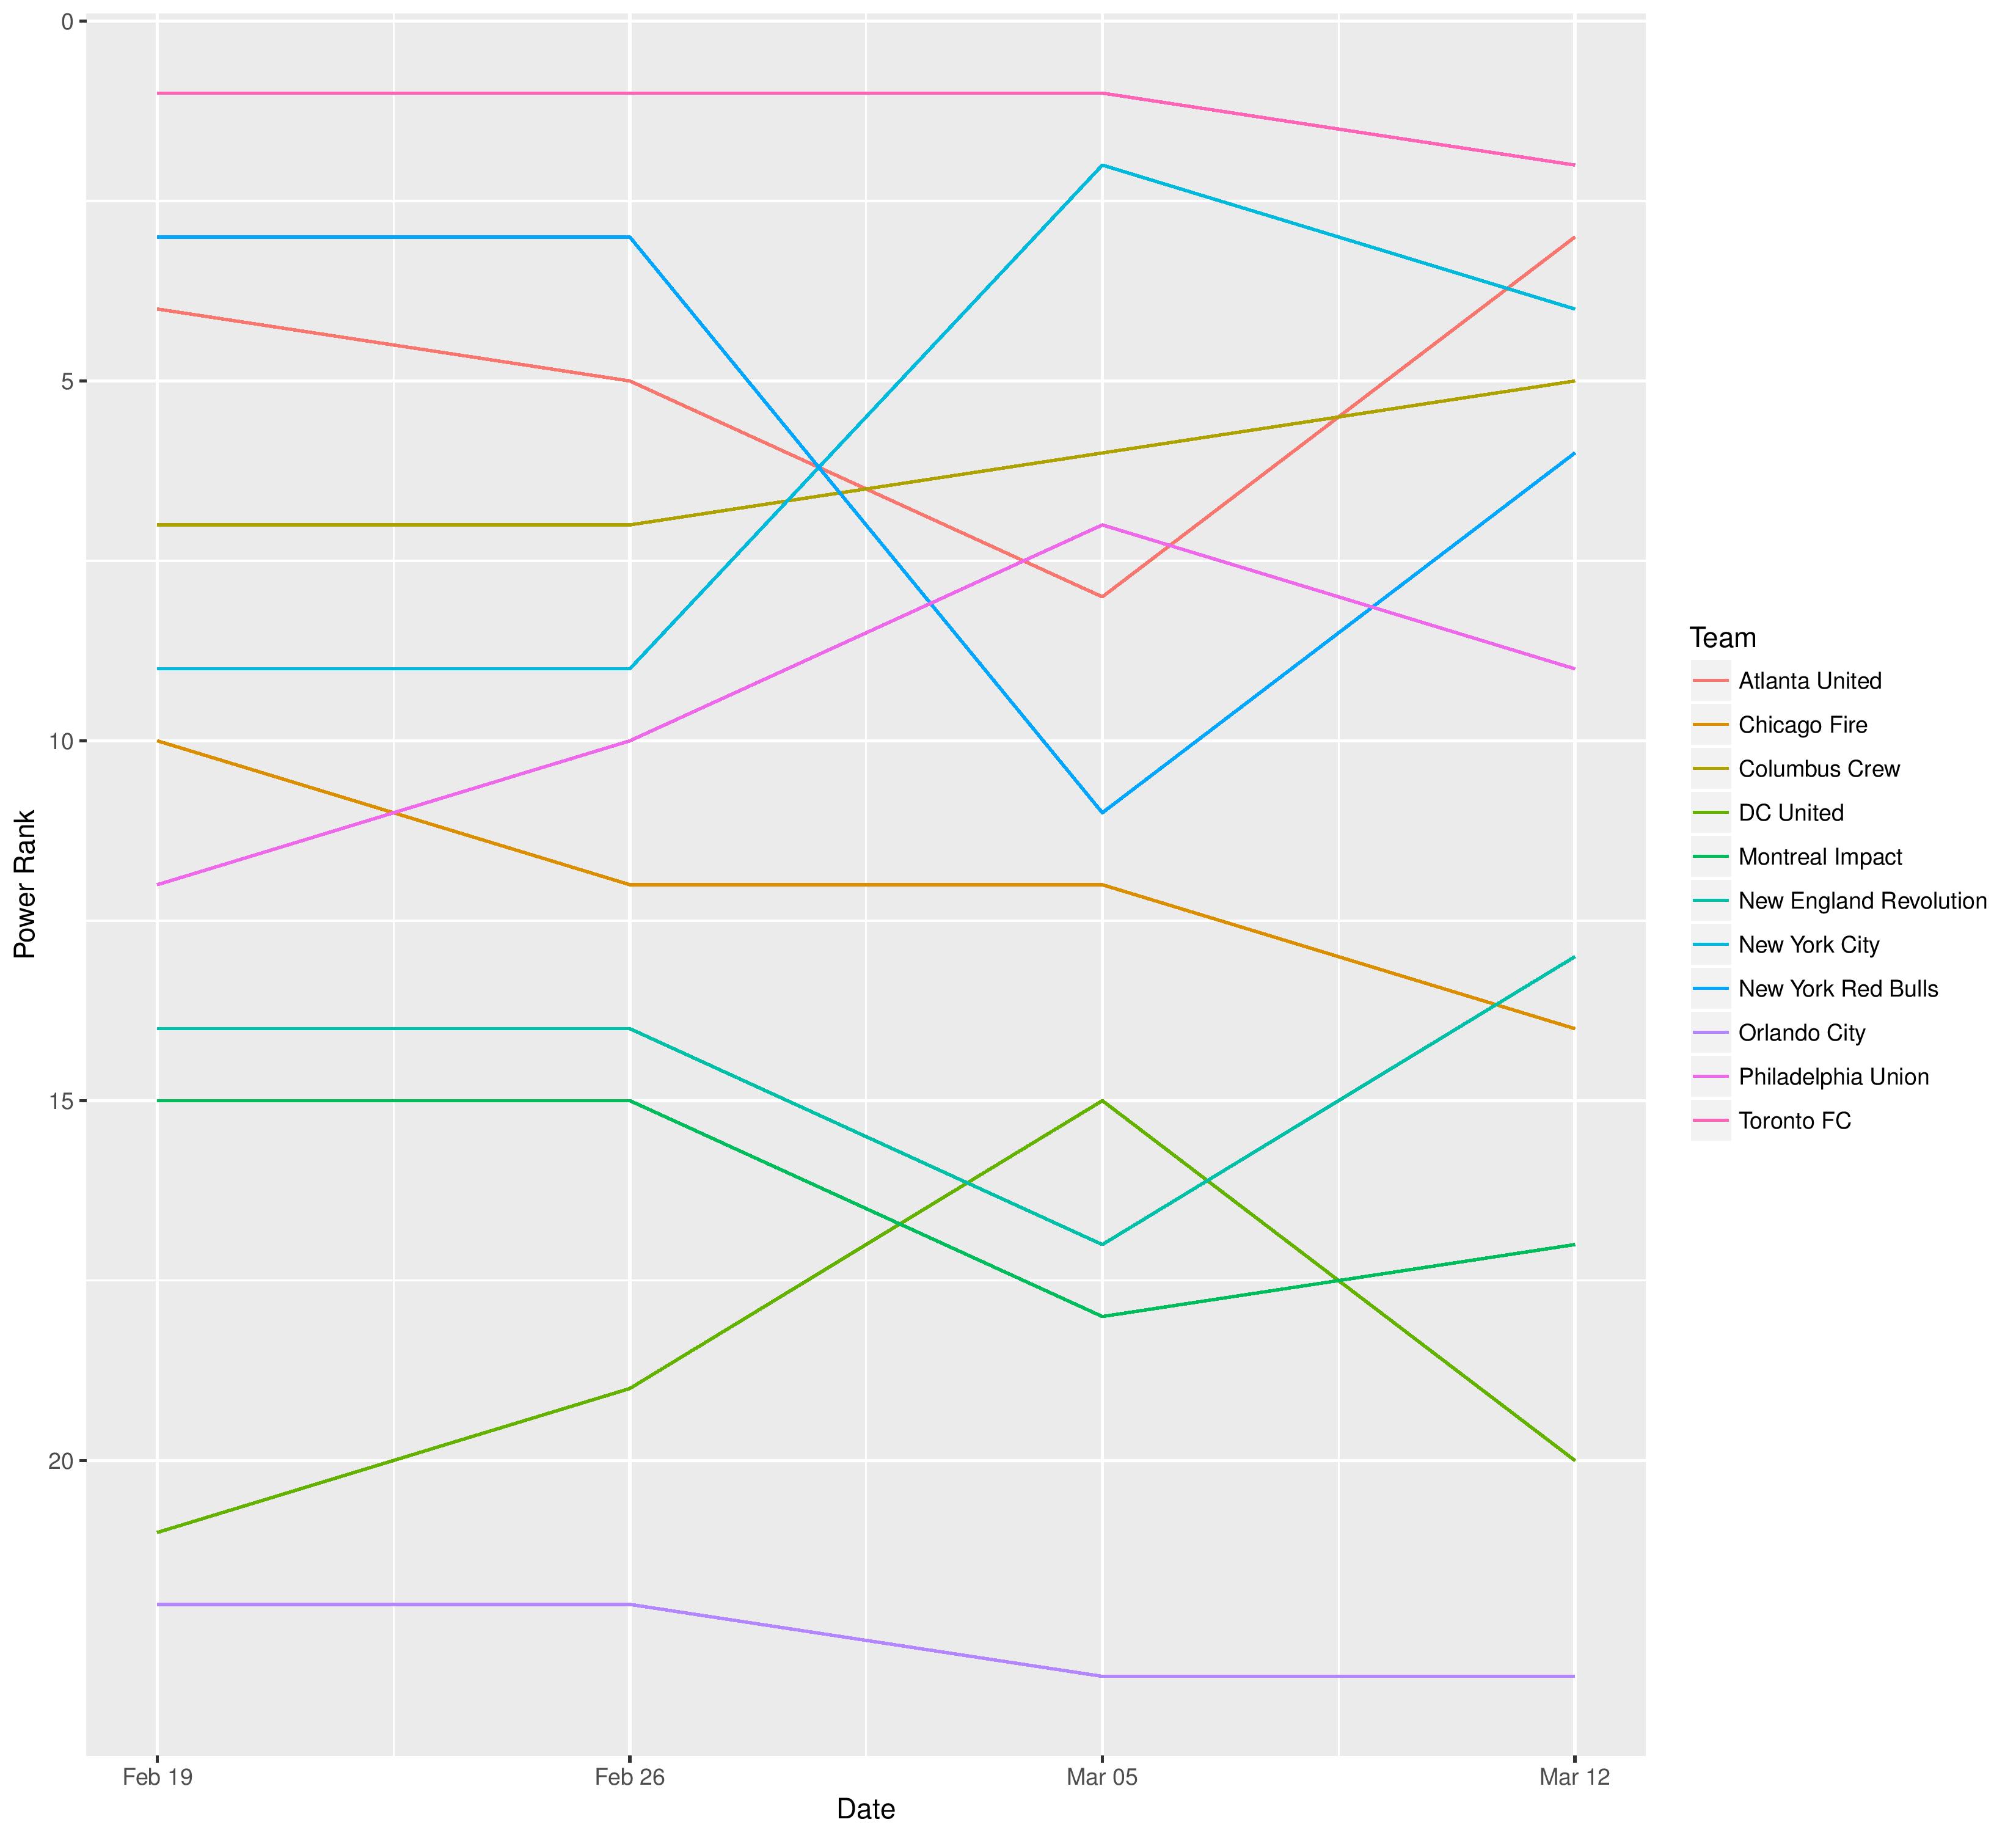
The following are Philadelphia’s odds at different prizes over time.
The following are the probabilities of each final playoffs placement for Philadelphia.

The following shows the summary of the simulations in an easy table format.
| Team | Conf | pts | W | L | T | GF | GA | GD | powerRk | pwrScr | Plyfs | MLSCup | Shld | USOCChmp | CANChmp | CCLQual | CCLChmp | confRegSeasFinish | regSeasFinish | plyfFinish |
|---|---|---|---|---|---|---|---|---|---|---|---|---|---|---|---|---|---|---|---|---|
| New York Red Bulls | East | 71 | 22 | 7 | 5 | 62 | 33 | 29 | 2 | 1.852 | 100 | 30.7 | 100 | 0 | NA | 69.7 | 0 | 1 | 1 | 2.9 |
| Atlanta United | East | 69 | 21 | 7 | 6 | 70 | 44 | 26 | 1 | 1.871 | 100 | 24.1 | 0 | 0 | NA | 100 | NA | 2 | 2 | 3.3 |
| Sporting Kansas City | West | 62 | 18 | 8 | 8 | 65 | 40 | 25 | 3 | 1.736 | 100 | 14.9 | 0 | 0 | NA | 100 | NA | 1 | 3 | 3.6 |
| Seattle Sounders | West | 59 | 18 | 11 | 5 | 52 | 37 | 15 | 5 | 1.613 | 100 | 8.1 | 0 | 0 | NA | 8.1 | 0 | 2 | 4 | 4.4 |
| Los Angeles FC | West | 57 | 16 | 9 | 9 | 68 | 52 | 16 | 4 | 1.65 | 100 | 7.7 | 0 | 0 | NA | 7.7 | NA | 3 | 5 | 5.2 |
| FC Dallas | West | 57 | 16 | 9 | 9 | 52 | 44 | 8 | 6 | 1.571 | 100 | 4.2 | 0 | 0 | NA | 4.2 | 0 | 4 | 6 | 6.4 |
| New York City | East | 56 | 16 | 10 | 8 | 59 | 45 | 14 | 8 | 1.547 | 100 | 3.3 | 0 | 0 | NA | 3.3 | NA | 3 | 7 | 6.7 |
| Portland Timbers | West | 54 | 15 | 10 | 9 | 54 | 48 | 6 | 7 | 1.554 | 100 | 1.8 | 0 | 0 | NA | 1.8 | NA | 5 | 8 | 8.2 |
| DC United | East | 51 | 14 | 11 | 9 | 60 | 50 | 10 | 9 | 1.521 | 100 | 3.5 | 0 | 0 | NA | 3.5 | NA | 4 | 9 | 7.3 |
| Columbus Crew | East | 51 | 14 | 11 | 9 | 43 | 45 | -2 | 11 | 1.4 | 100 | 0.7 | 0 | 0 | NA | 0.7 | NA | 5 | 10 | 9.3 |
| Philadelphia Union | East | 50 | 15 | 14 | 5 | 49 | 50 | -1 | 10 | 1.416 | 100 | 0.6 | 0 | 0 | NA | 0.6 | NA | 6 | 11 | 9.9 |
| Real Salt Lake | West | 49 | 14 | 13 | 7 | 55 | 58 | -3 | 15 | 1.319 | 100 | 0.3 | 0 | 0 | NA | 0.3 | NA | 6 | 12 | 10.9 |
| Los Angeles Galaxy | West | 48 | 13 | 12 | 9 | 66 | 64 | 2 | 14 | 1.322 | 0 | 0 | 0 | 0 | NA | 0 | NA | 7 | 13 | 13 |
| Vancouver Whitecaps | West | 47 | 13 | 13 | 8 | 54 | 67 | -13 | 16 | 1.227 | 0 | 0 | 0 | NA | 0 | 0 | NA | 8 | 14 | 14 |
| Montreal Impact | East | 46 | 14 | 16 | 4 | 47 | 53 | -6 | 12 | 1.388 | 0 | 0 | 0 | NA | 0 | 0 | NA | 7 | 15 | 15 |
| New England Revolution | East | 41 | 10 | 13 | 11 | 49 | 55 | -6 | 18 | 1.189 | 0 | 0 | 0 | 0 | NA | 0 | NA | 8 | 16 | 16 |
| Houston Dynamo | West | 38 | 10 | 16 | 8 | 58 | 58 | 0 | 17 | 1.199 | 0 | 0 | 0 | 100 | NA | 100 | NA | 9 | 17 | 17 |
| Minnesota United | West | 36 | 11 | 20 | 3 | 49 | 71 | -22 | 21 | 0.963 | 0 | 0 | 0 | 0 | NA | 0 | NA | 10 | 18 | 18 |
| Toronto FC | East | 36 | 10 | 18 | 6 | 59 | 64 | -5 | 13 | 1.342 | 0 | 0 | 0 | NA | 100 | 100 | 0 | 9 | 19 | 19 |
| Chicago Fire | East | 32 | 8 | 18 | 8 | 48 | 61 | -13 | 19 | 1.068 | 0 | 0 | 0 | 0 | NA | 0 | NA | 10 | 20 | 20 |
| Colorado Rapids | West | 31 | 8 | 19 | 7 | 36 | 63 | -27 | 22 | 0.926 | 0 | 0 | 0 | 0 | NA | 0 | 0 | 11 | 21 | 21 |
| Orlando City | East | 28 | 8 | 22 | 4 | 43 | 74 | -31 | 20 | 0.975 | 0 | 0 | 0 | 0 | NA | 0 | NA | 11 | 22 | 22 |
| San Jose Earthquakes | West | 21 | 4 | 21 | 9 | 49 | 71 | -22 | 23 | 0.806 | 0 | 0 | 0 | 0 | NA | 0 | NA | 12 | 23 | 23 |
Next is a table showing the difference between this forecast and the last forecast.
| Team | Conf | pts | W | L | T | GF | GA | GD | powerRk | pwrScr | Plyfs | MLSCup | Shld | USOCChmp | CANChmp | CCLQual | CCLChmp | confRegSeasFinish | regSeasFinish | plyfFinish |
|---|---|---|---|---|---|---|---|---|---|---|---|---|---|---|---|---|---|---|---|---|
| New York Red Bulls | East | 0.3 | 0.1 | -0.1 | -0.1 | -1.7 | -0.7 | -1 | 0 | 0.017 | 0 | 1.4 | 55.6 | 0 | NA | 0.4 | 0 | -0.6 | -0.6 | -0.1 |
| Atlanta United | East | -1.6 | -0.5 | 0.6 | -0.1 | -1 | 2.1 | -3.1 | 0 | -0.047 | 0 | -3.4 | -55.6 | 0 | NA | 0 | NA | 0.6 | 0.6 | 0.3 |
| Sporting Kansas City | West | 1 | 0.4 | -0.2 | -0.2 | 0 | -0.2 | 0.2 | 0 | 0.03 | 0 | 2.4 | 0 | 0 | NA | 0 | NA | -0.5 | -0.5 | -0.4 |
| Seattle Sounders | West | 0.4 | 0.2 | -0.1 | -0.1 | -0.1 | 0.2 | -0.4 | -1 | 0.017 | 0 | 1.5 | 0 | 0 | NA | 1.5 | 0 | -0.7 | -0.7 | -0.7 |
| Los Angeles FC | West | -0.8 | -0.2 | 0.4 | -0.2 | -0.2 | 0 | -0.2 | 0 | -0.009 | 0 | -0.3 | 0 | 0 | NA | -0.3 | NA | 0 | 0 | -0.1 |
| FC Dallas | West | -1.7 | -0.5 | 0.7 | -0.2 | -0.7 | 0.7 | -1.4 | -1 | -0.02 | 0 | -1.7 | 0 | 0 | NA | -1.7 | 0 | 1.1 | 1.1 | 0.9 |
| New York City | East | 1.1 | 0.4 | -0.3 | -0.1 | 1.1 | -0.1 | 1.2 | -1 | 0.048 | 0 | 1.3 | 0 | 0 | NA | 1.3 | NA | -0.4 | -1 | -0.8 |
| Portland Timbers | West | -1.4 | -0.4 | 0.6 | -0.2 | -0.7 | 0.3 | -1 | 2 | -0.045 | 0 | -1.1 | 0 | 0 | NA | -1.1 | NA | 0.2 | 0.7 | 0.5 |
| DC United | East | -0.4 | -0.4 | -0.4 | 0.8 | -1.7 | -1.7 | 0 | 1 | -0.025 | 0 | 0.7 | 0 | 0 | NA | 0.7 | NA | -0.8 | -1.1 | -1 |
| Columbus Crew | East | 0.6 | 0.2 | -0.1 | -0.1 | 0.9 | 1.2 | -0.3 | -1 | -0.001 | 7.9 | 0 | 0 | 0 | NA | 0 | NA | -0.3 | -1.3 | -0.6 |
| Philadelphia Union | East | -1 | -0.3 | 0.4 | -0.1 | -0.1 | 1.1 | -1.2 | 0 | -0.009 | 0 | -0.4 | 0 | 0 | NA | -0.4 | NA | 1.4 | 1 | 1 |
| Real Salt Lake | West | 0 | 0 | 0 | 0 | 0 | 0 | 0 | 1 | 0.013 | 70 | 0.2 | 0 | 0 | NA | 0.2 | NA | -0.7 | -0.8 | -1.6 |
| Los Angeles Galaxy | West | -2.2 | -0.7 | 0.8 | -0.1 | -0.6 | 1.2 | -1.8 | 1 | -0.059 | -70 | -0.7 | 0 | 0 | NA | -0.7 | NA | 0.7 | 2.1 | 2.4 |
| Vancouver Whitecaps | West | 1.5 | 0.6 | -0.4 | -0.2 | 0.3 | -0.7 | 1 | 0 | 0.023 | 0 | 0 | 0 | NA | 0 | 0 | NA | 0 | -0.8 | -0.8 |
| Montreal Impact | East | -1.1 | -0.3 | 0.5 | -0.1 | -1.3 | -0.9 | -0.5 | 1 | -0.024 | -7.9 | 0 | 0 | NA | 0 | 0 | NA | 0.1 | 1.3 | 1.3 |
| New England Revolution | East | 1.2 | 0.5 | -0.3 | -0.1 | -0.9 | -1.3 | 0.5 | 1 | 0.018 | 0 | 0 | 0 | 0 | NA | 0 | NA | 0 | -0.1 | -0.1 |
| Houston Dynamo | West | 2.4 | 0.8 | -0.7 | -0.1 | 1.2 | -0.6 | 1.8 | -1 | 0.048 | 0 | 0 | 0 | 0 | NA | 0 | NA | -0.9 | -1.1 | -1.1 |
| Minnesota United | West | -0.5 | -0.1 | 0.2 | -0.1 | 1.2 | 0.9 | 0.3 | 1 | -0.023 | 0 | 0 | 0 | 0 | NA | 0 | NA | 0.9 | 0.9 | 0.9 |
| Toronto FC | East | 1.7 | 0.6 | -0.5 | -0.1 | 2.1 | -1 | 3.1 | -2 | 0.055 | 0 | 0 | 0 | NA | 0 | 0 | 0 | -0.2 | 0.1 | 0.1 |
| Chicago Fire | East | -0.4 | -0.4 | -0.4 | 0.8 | -1.7 | -1.7 | 0 | 0 | -0.028 | 0 | 0 | 0 | 0 | NA | 0 | NA | 0.2 | 0.2 | 0.2 |
| Colorado Rapids | West | 1.9 | 0.7 | -0.5 | -0.2 | 0.7 | -0.7 | 1.4 | 0 | 0.035 | 0 | 0 | 0 | 0 | NA | 0 | 0 | 0 | -0.6 | -0.6 |
| Orlando City | East | -0.2 | -0.1 | 0.1 | -0.1 | -0.7 | -1.7 | 1 | -1 | -0.006 | 0 | 0 | 0 | 0 | NA | 0 | NA | 0 | 0.6 | 0.6 |
| San Jose Earthquakes | West | -0.3 | -0.1 | 0.2 | -0.1 | 0.2 | -0.1 | 0.4 | 0 | -0.006 | 0 | 0 | 0 | 0 | NA | 0 | NA | 0 | 0 | 0 |
The following shows the difficulty for each team’s remaining schedule. Higher values means an easier remaining schedule.

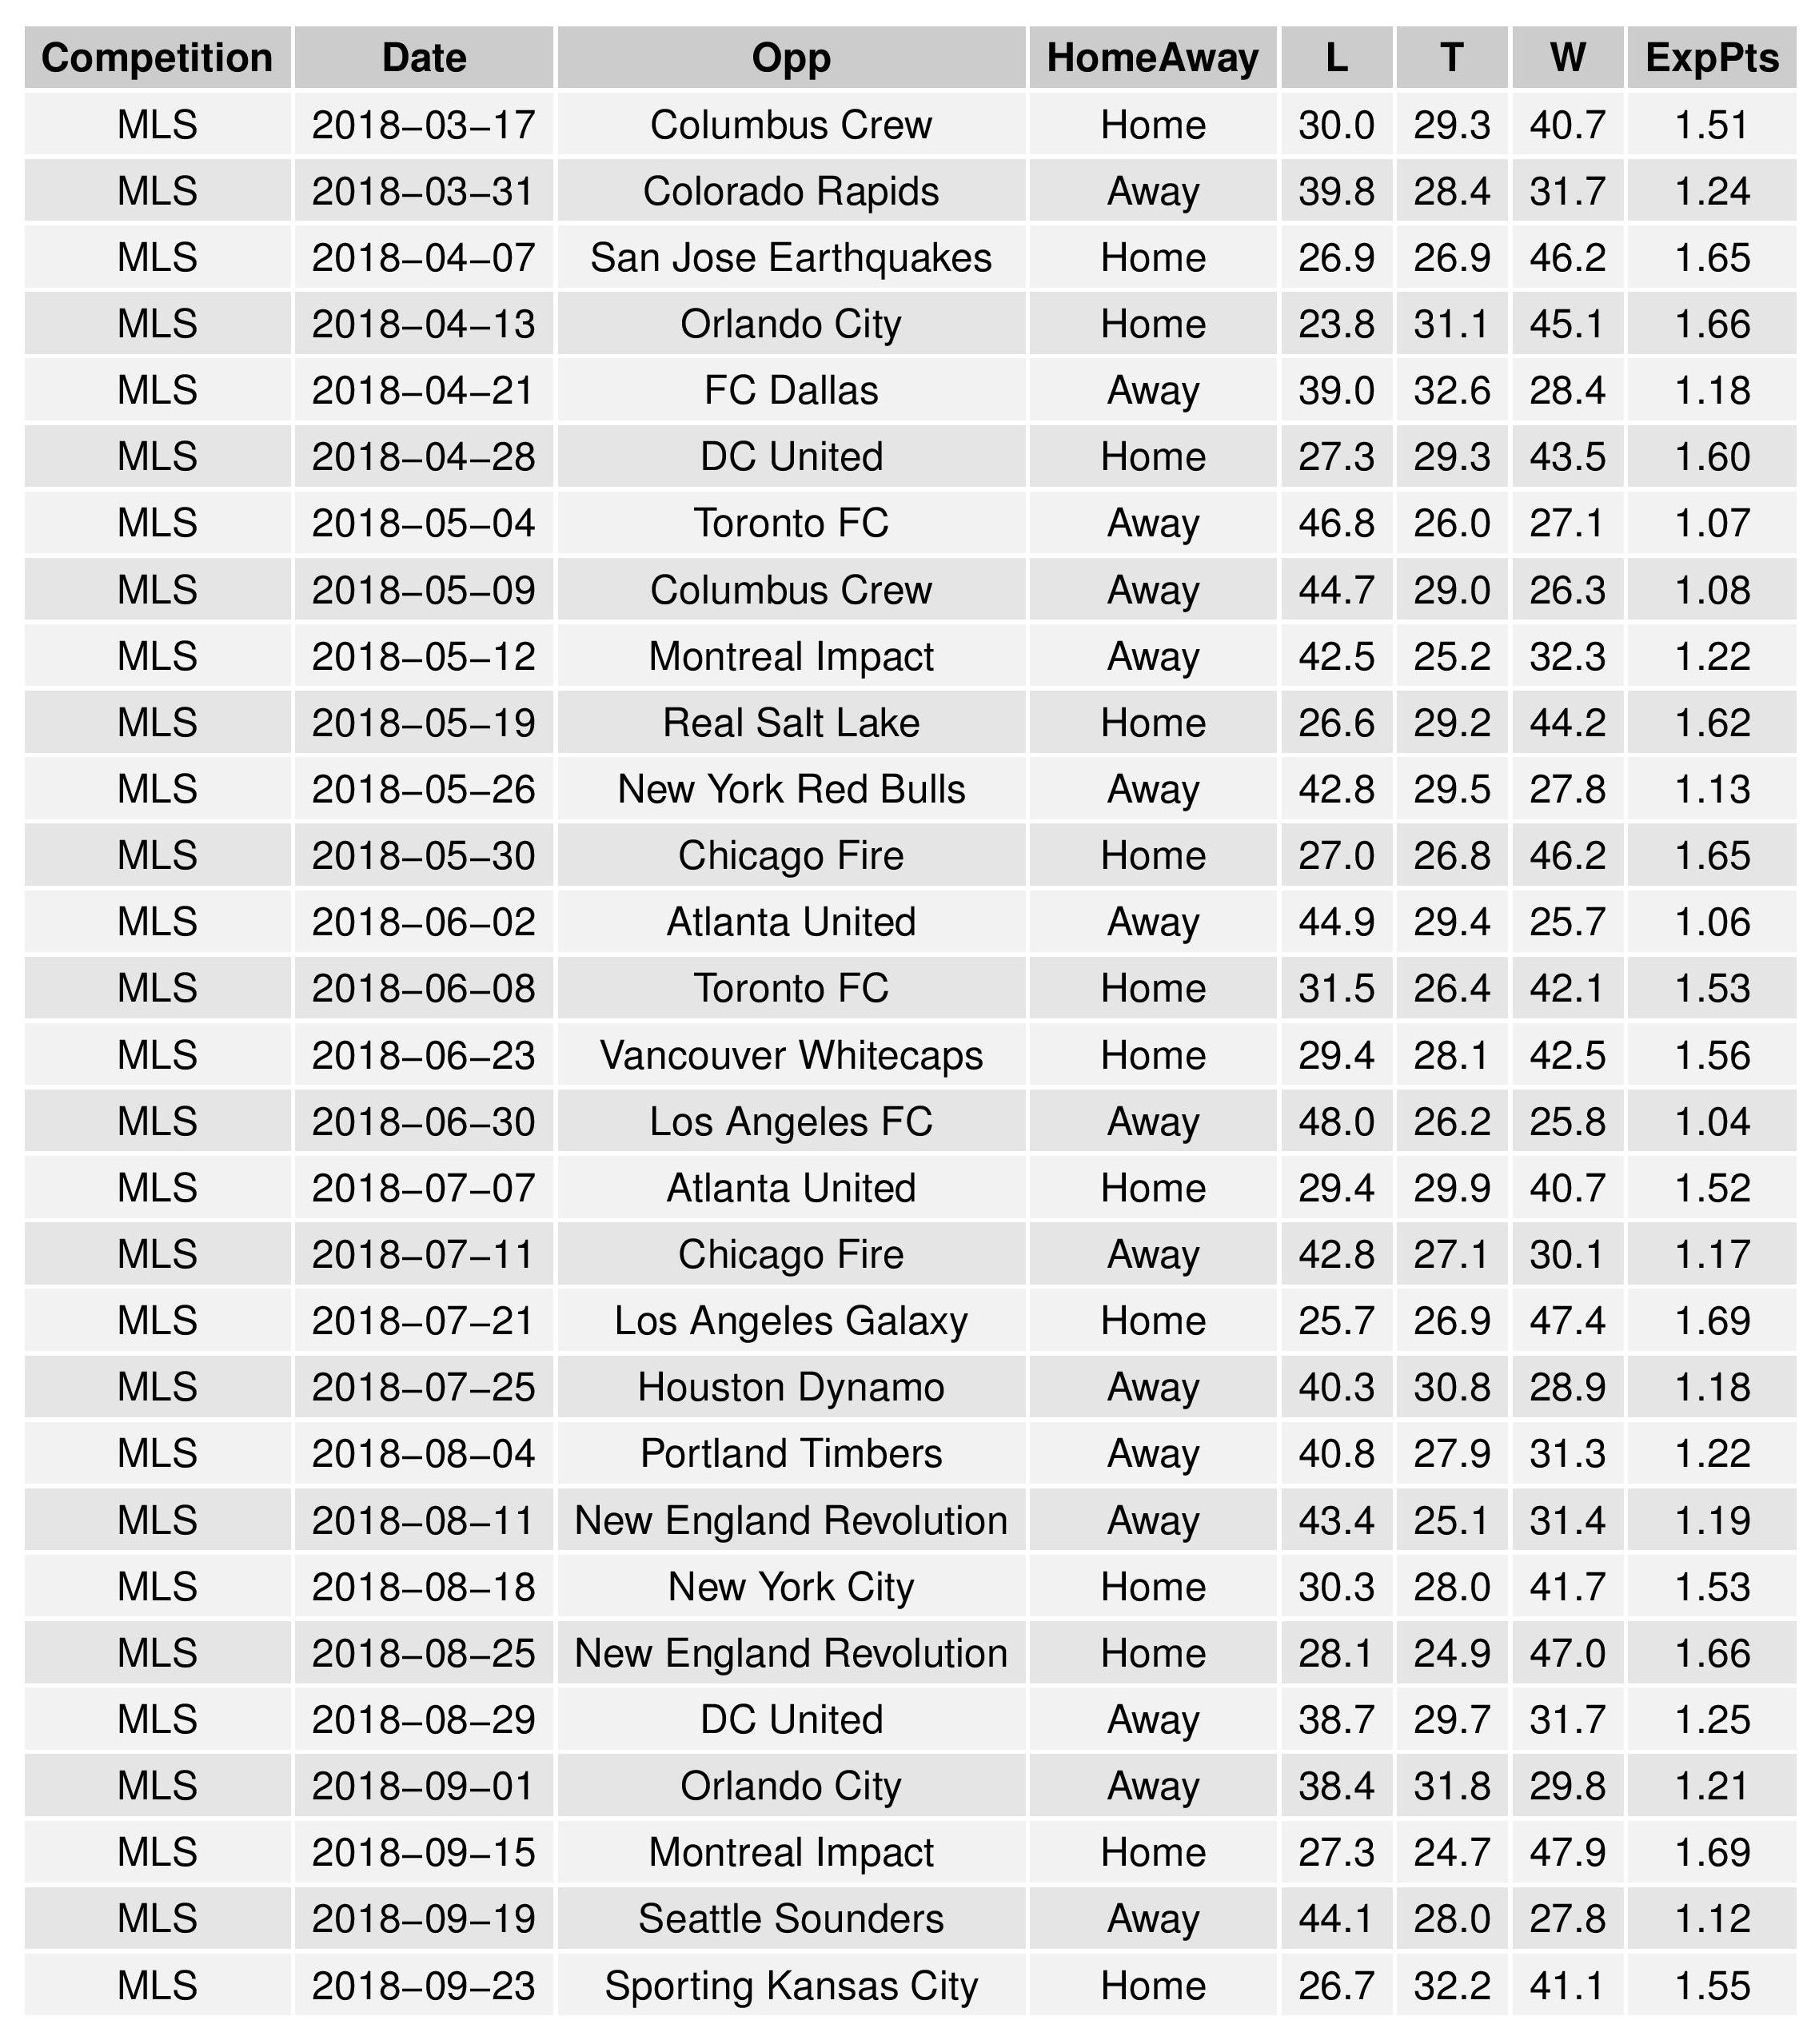
The following shows the expectations for upcoming Philadelphia matches:
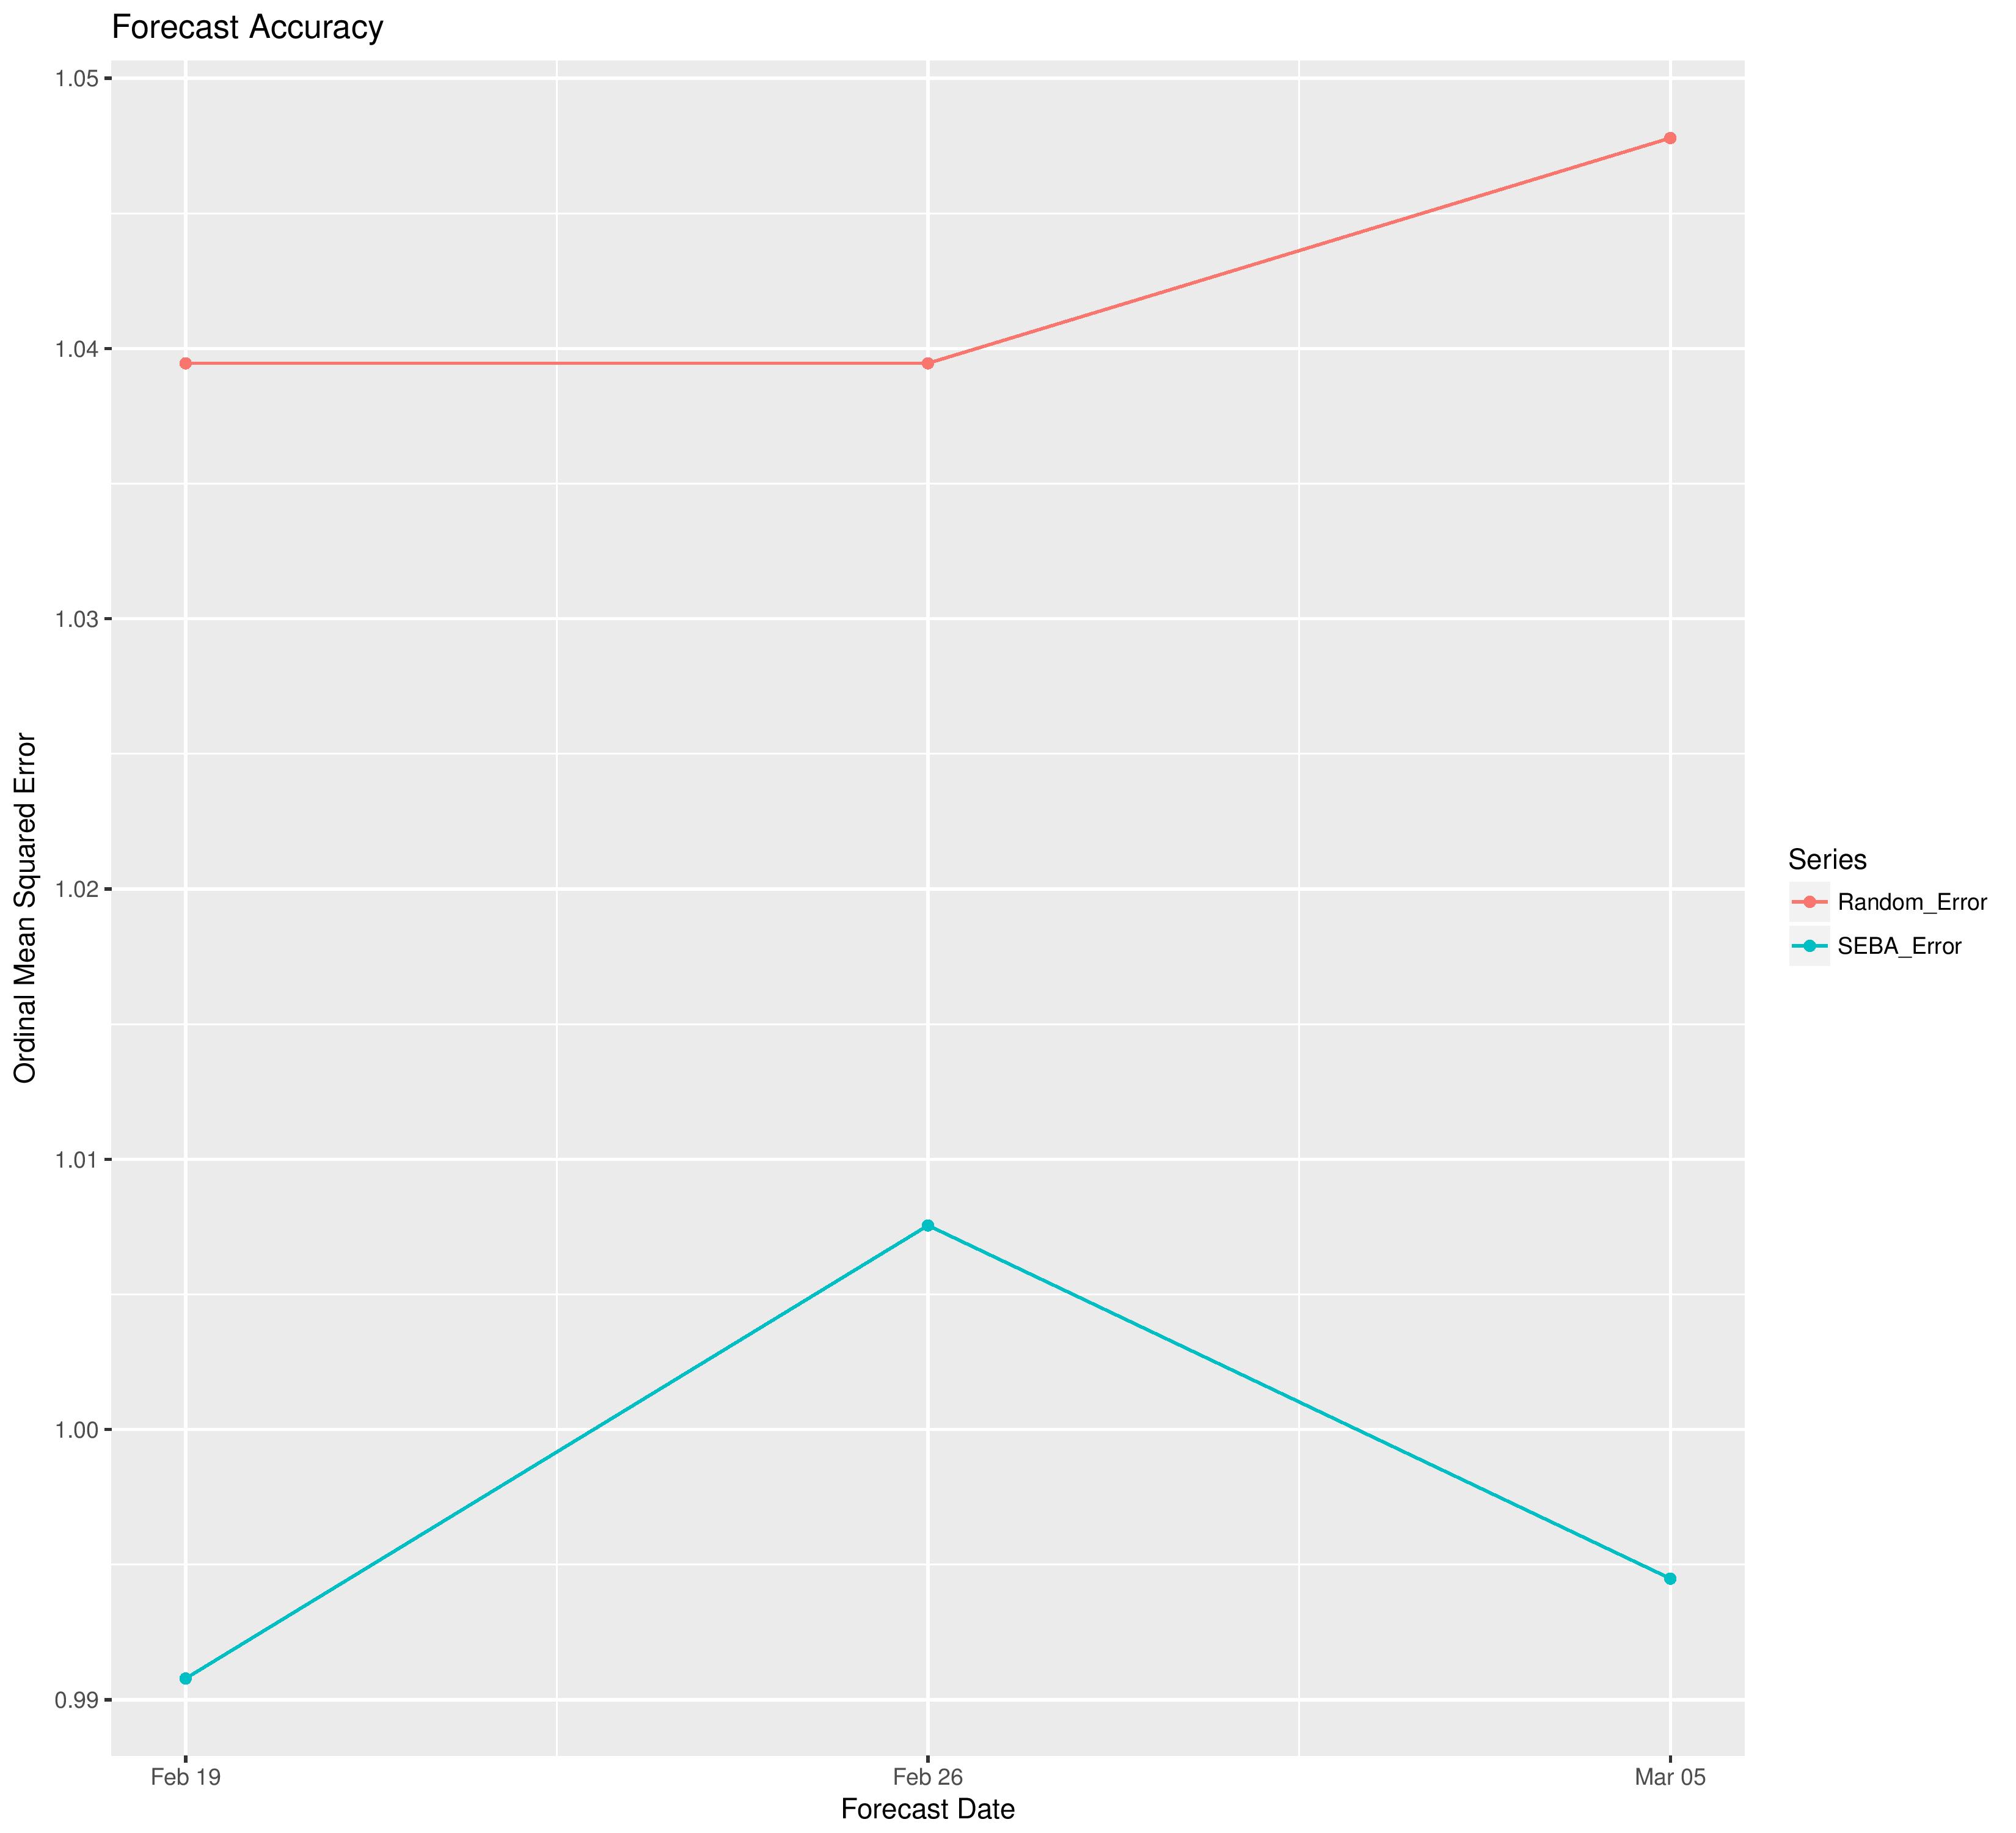
Model Validation
The following shows SEBA’s model error compared with random guessing. To do this, we save forecasts for the entire season’s games for every forecast’s data, and update the error charts all the way through the season.
Lower error is better.
USL
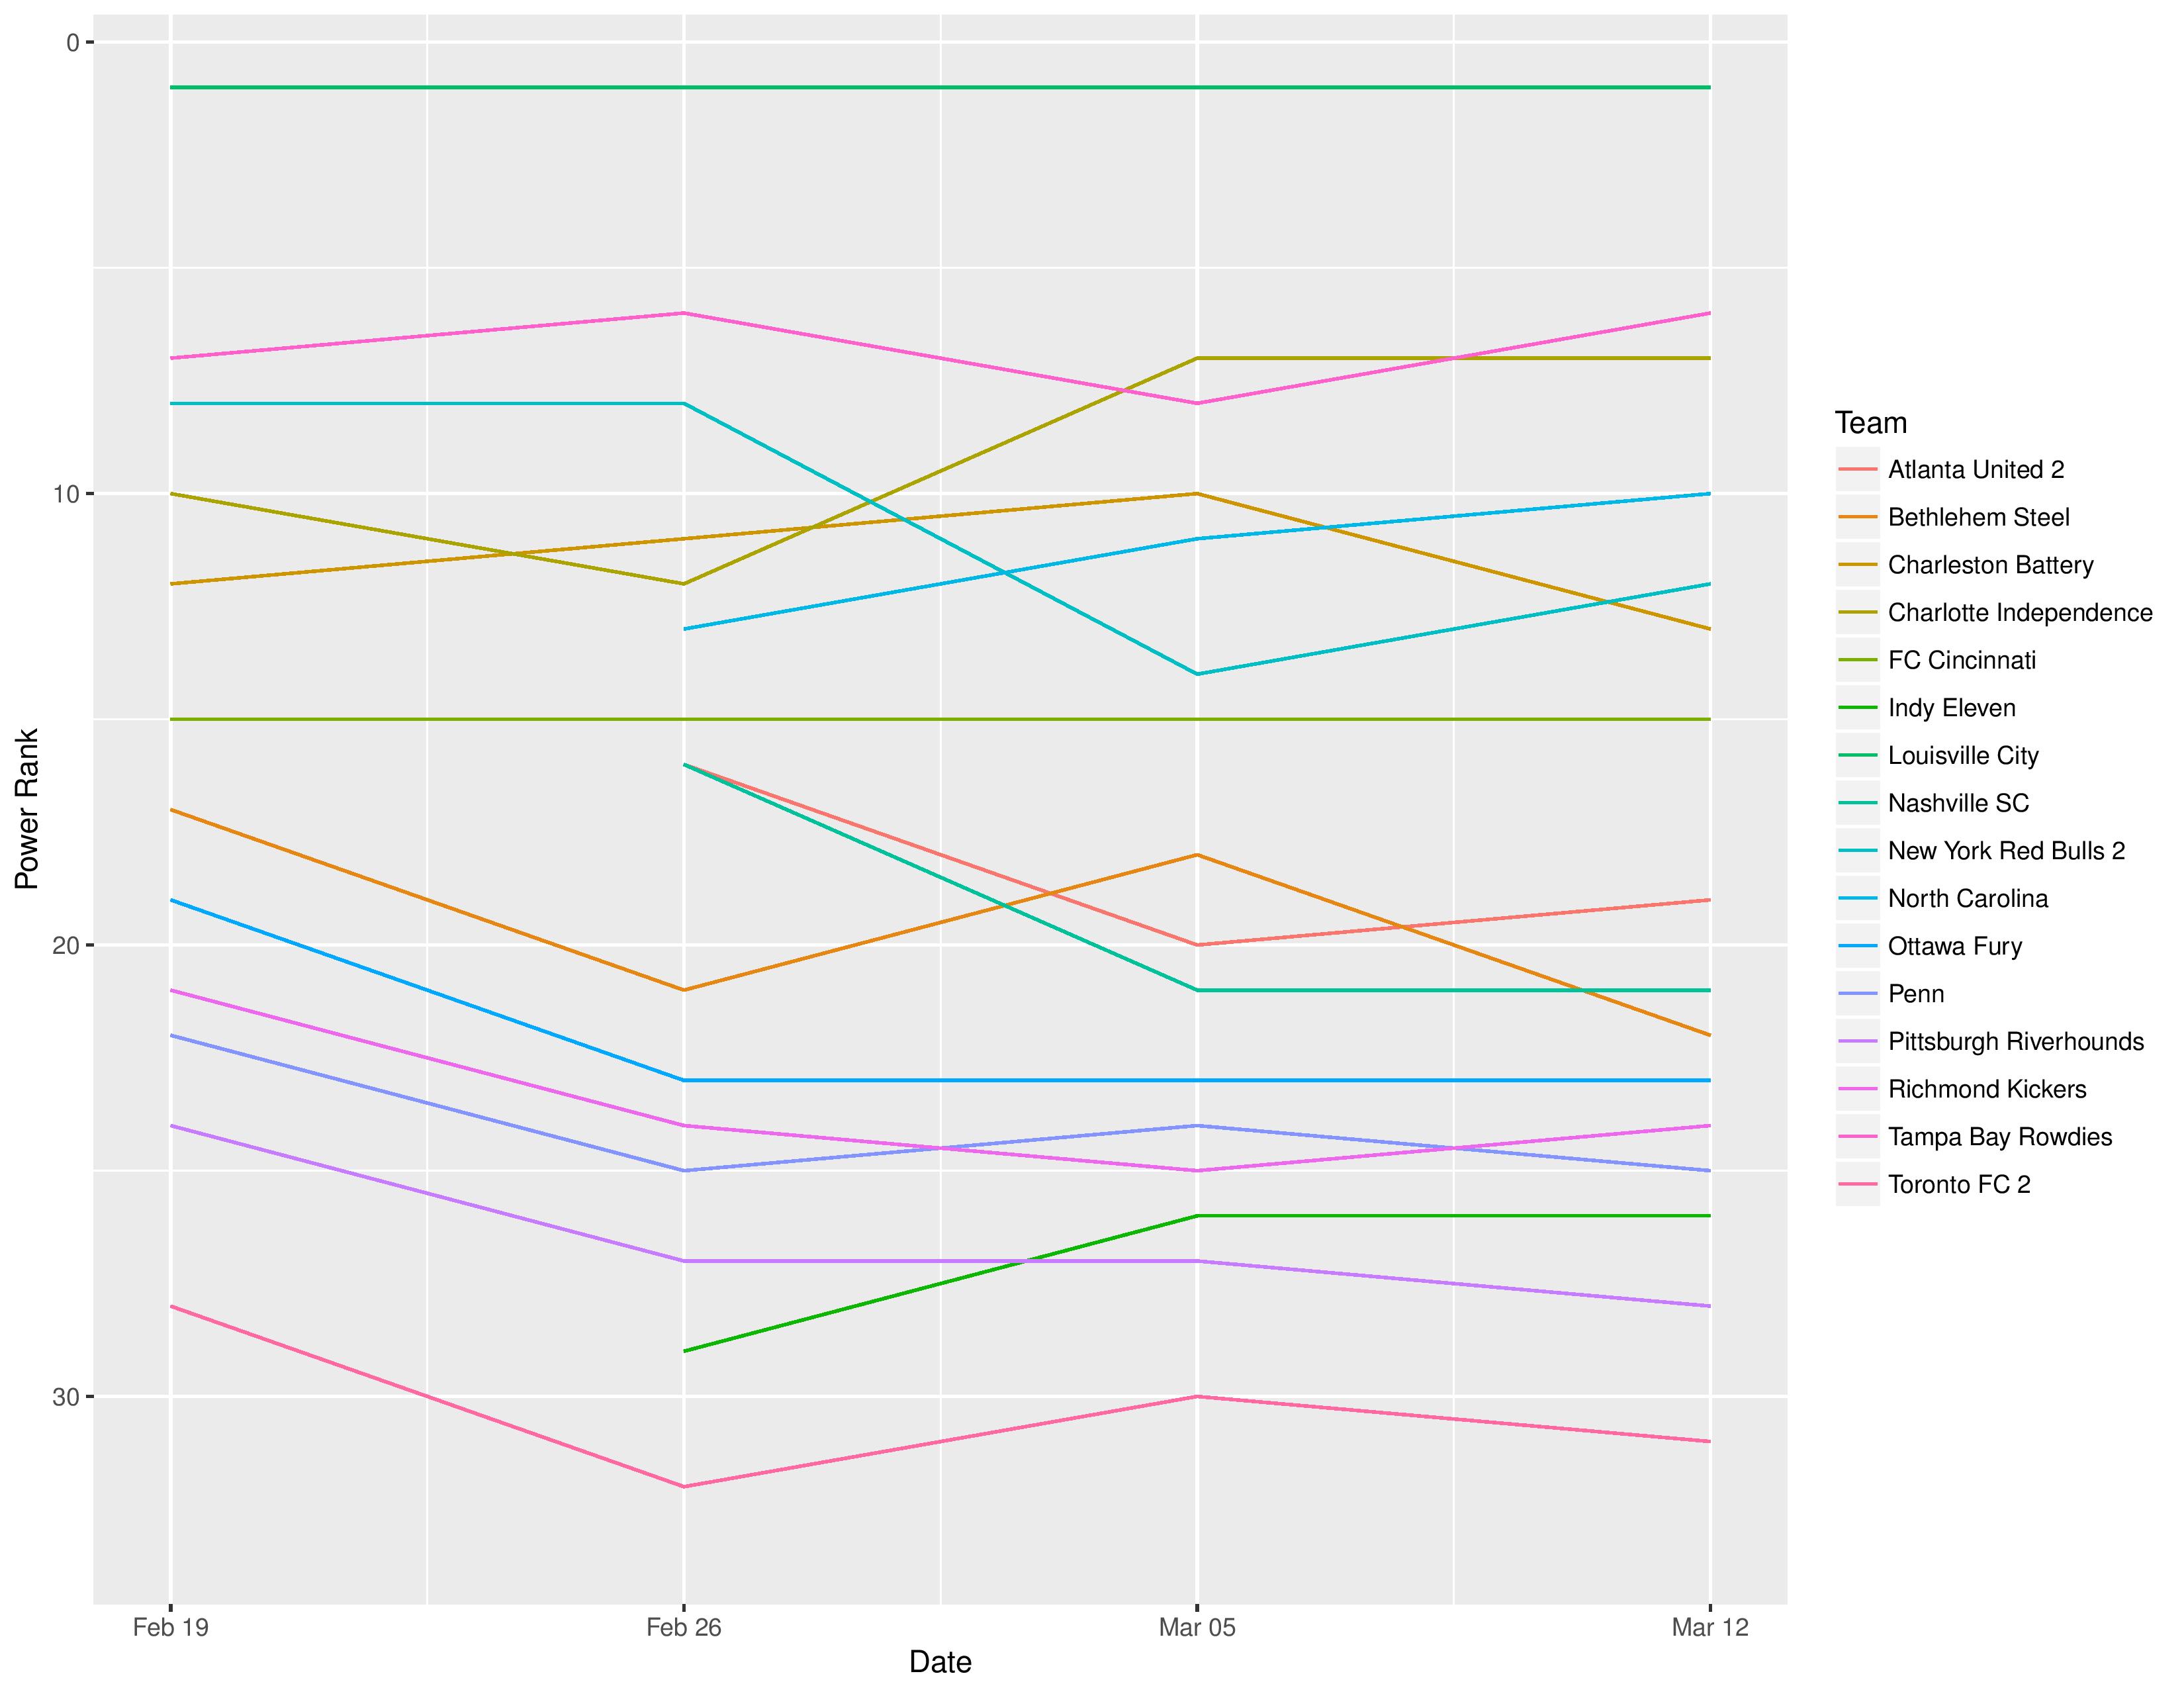
Power Rankings
SEBA has Bethlehem decreased from 18th to 20th. However, the model has no data on changes to squads, so this is largely reflective of last season’s finish (and model changes such as distance traveled).

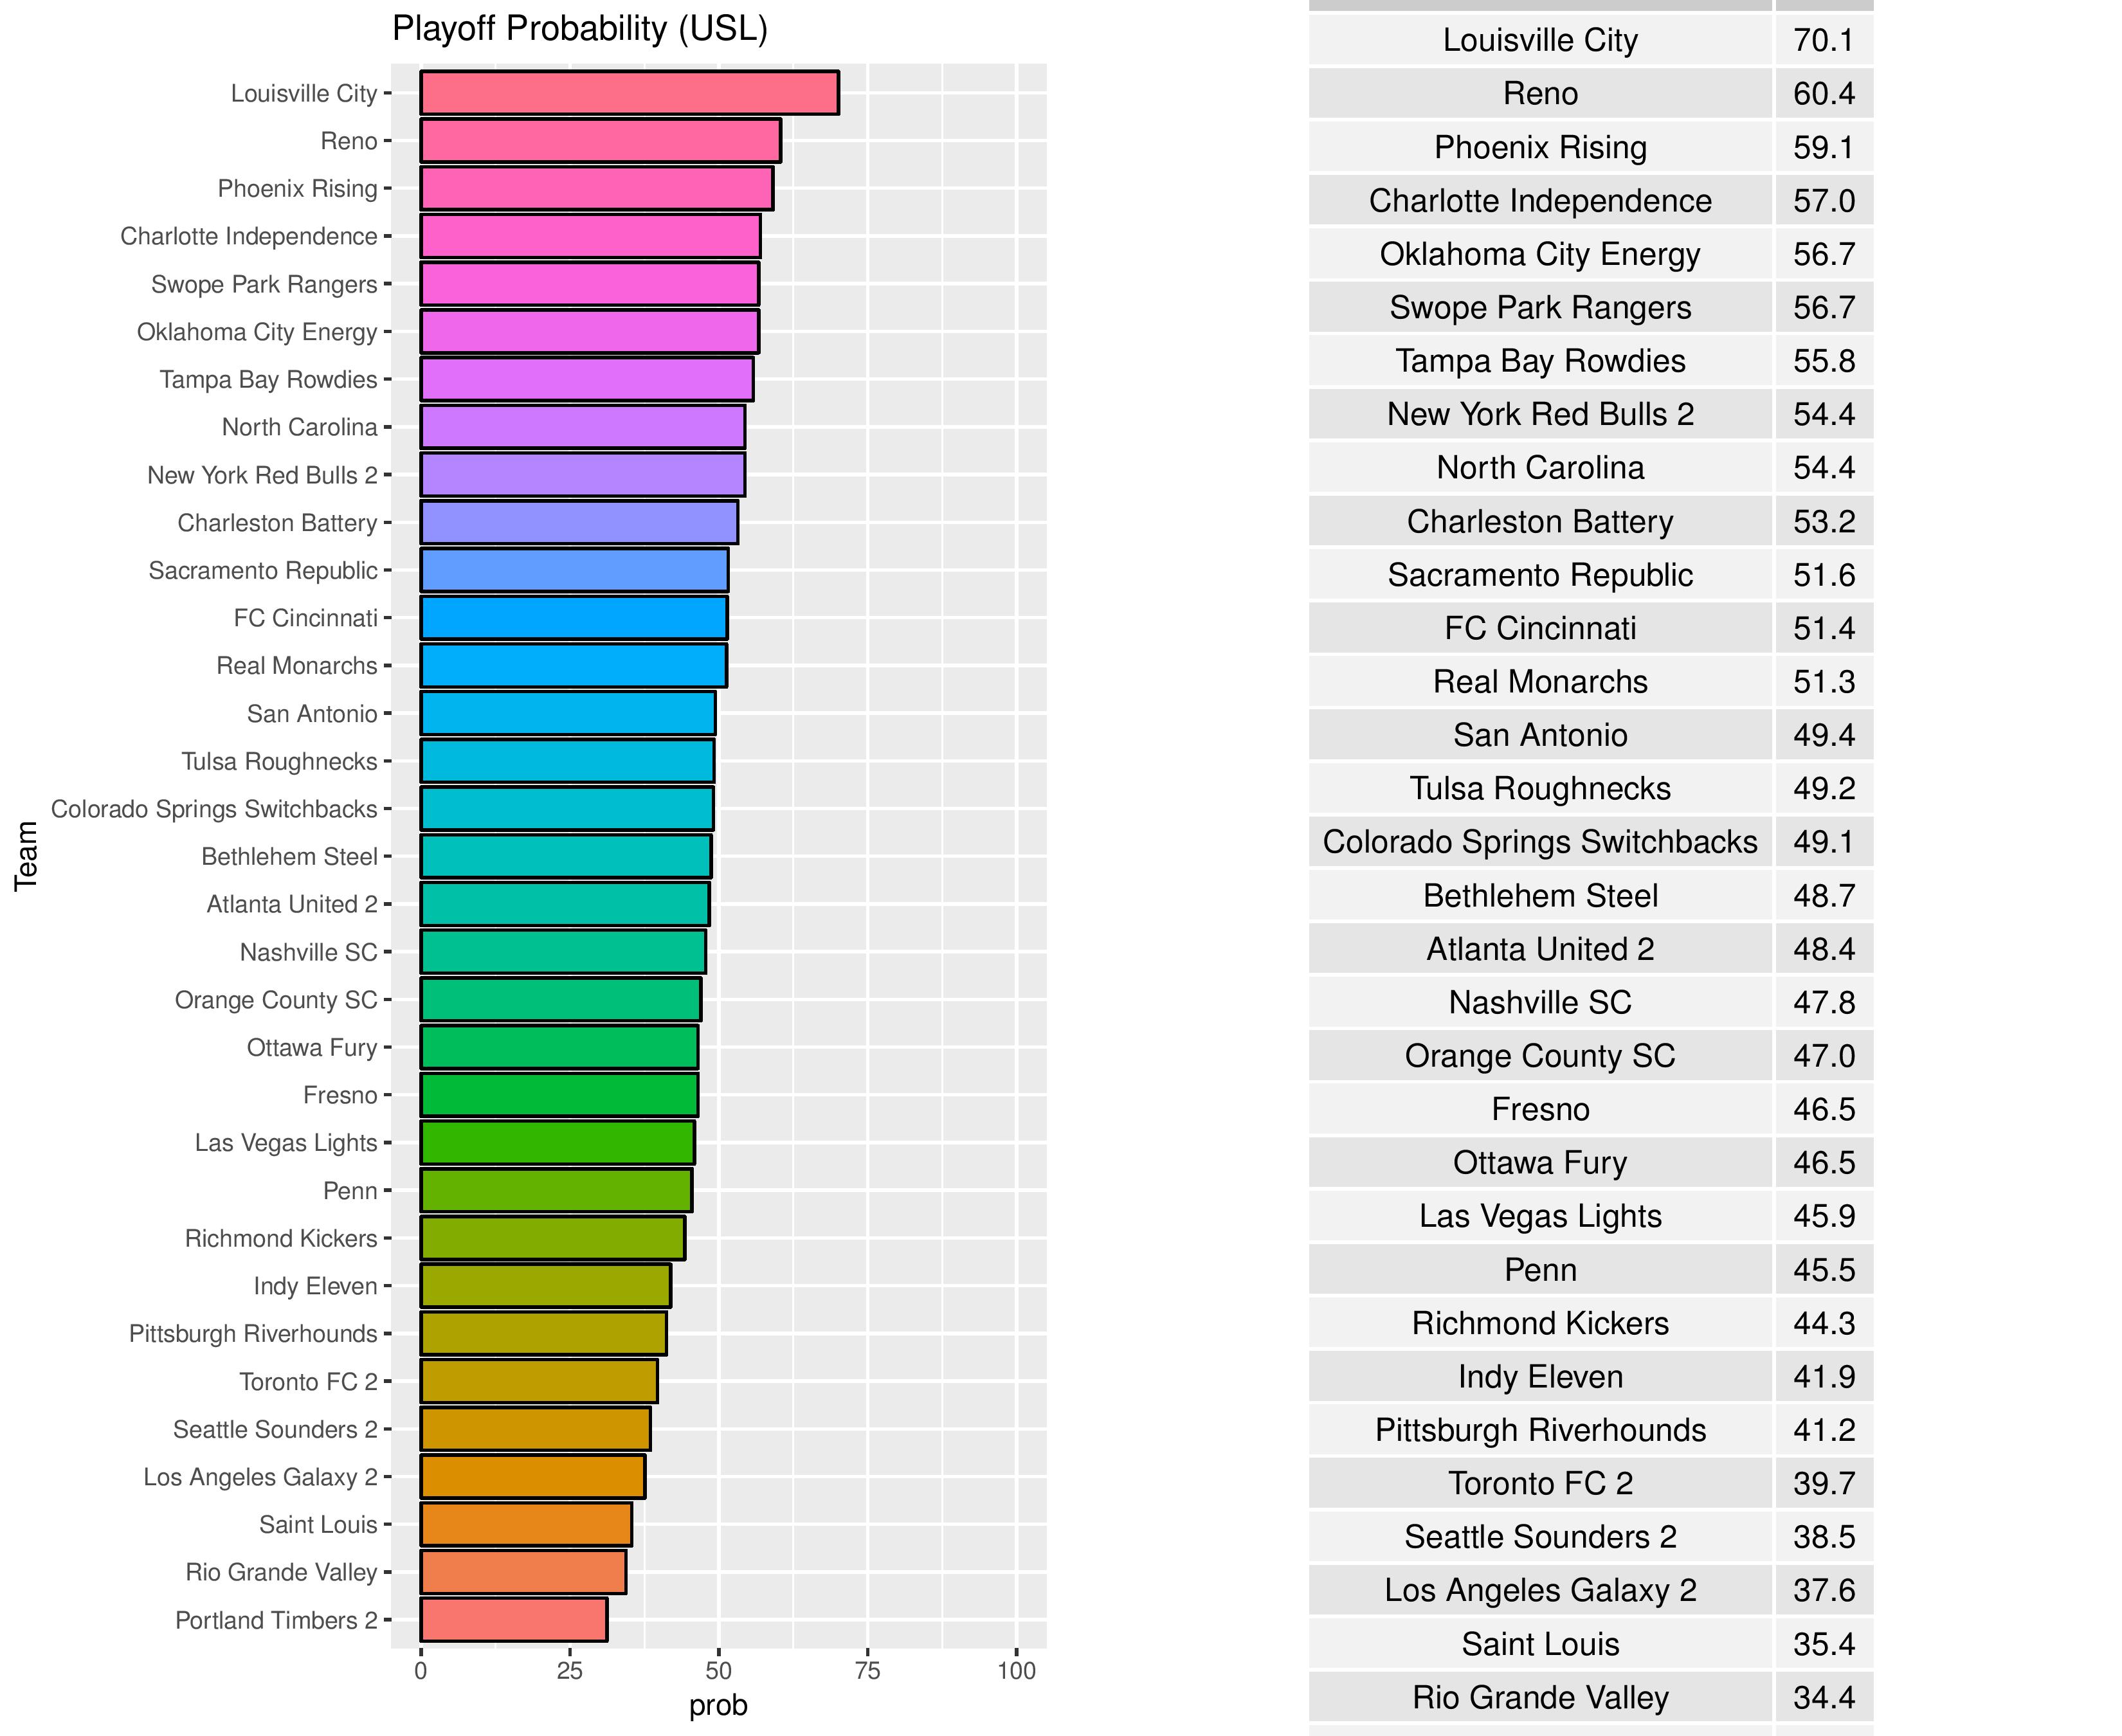
Playoffs probability and more
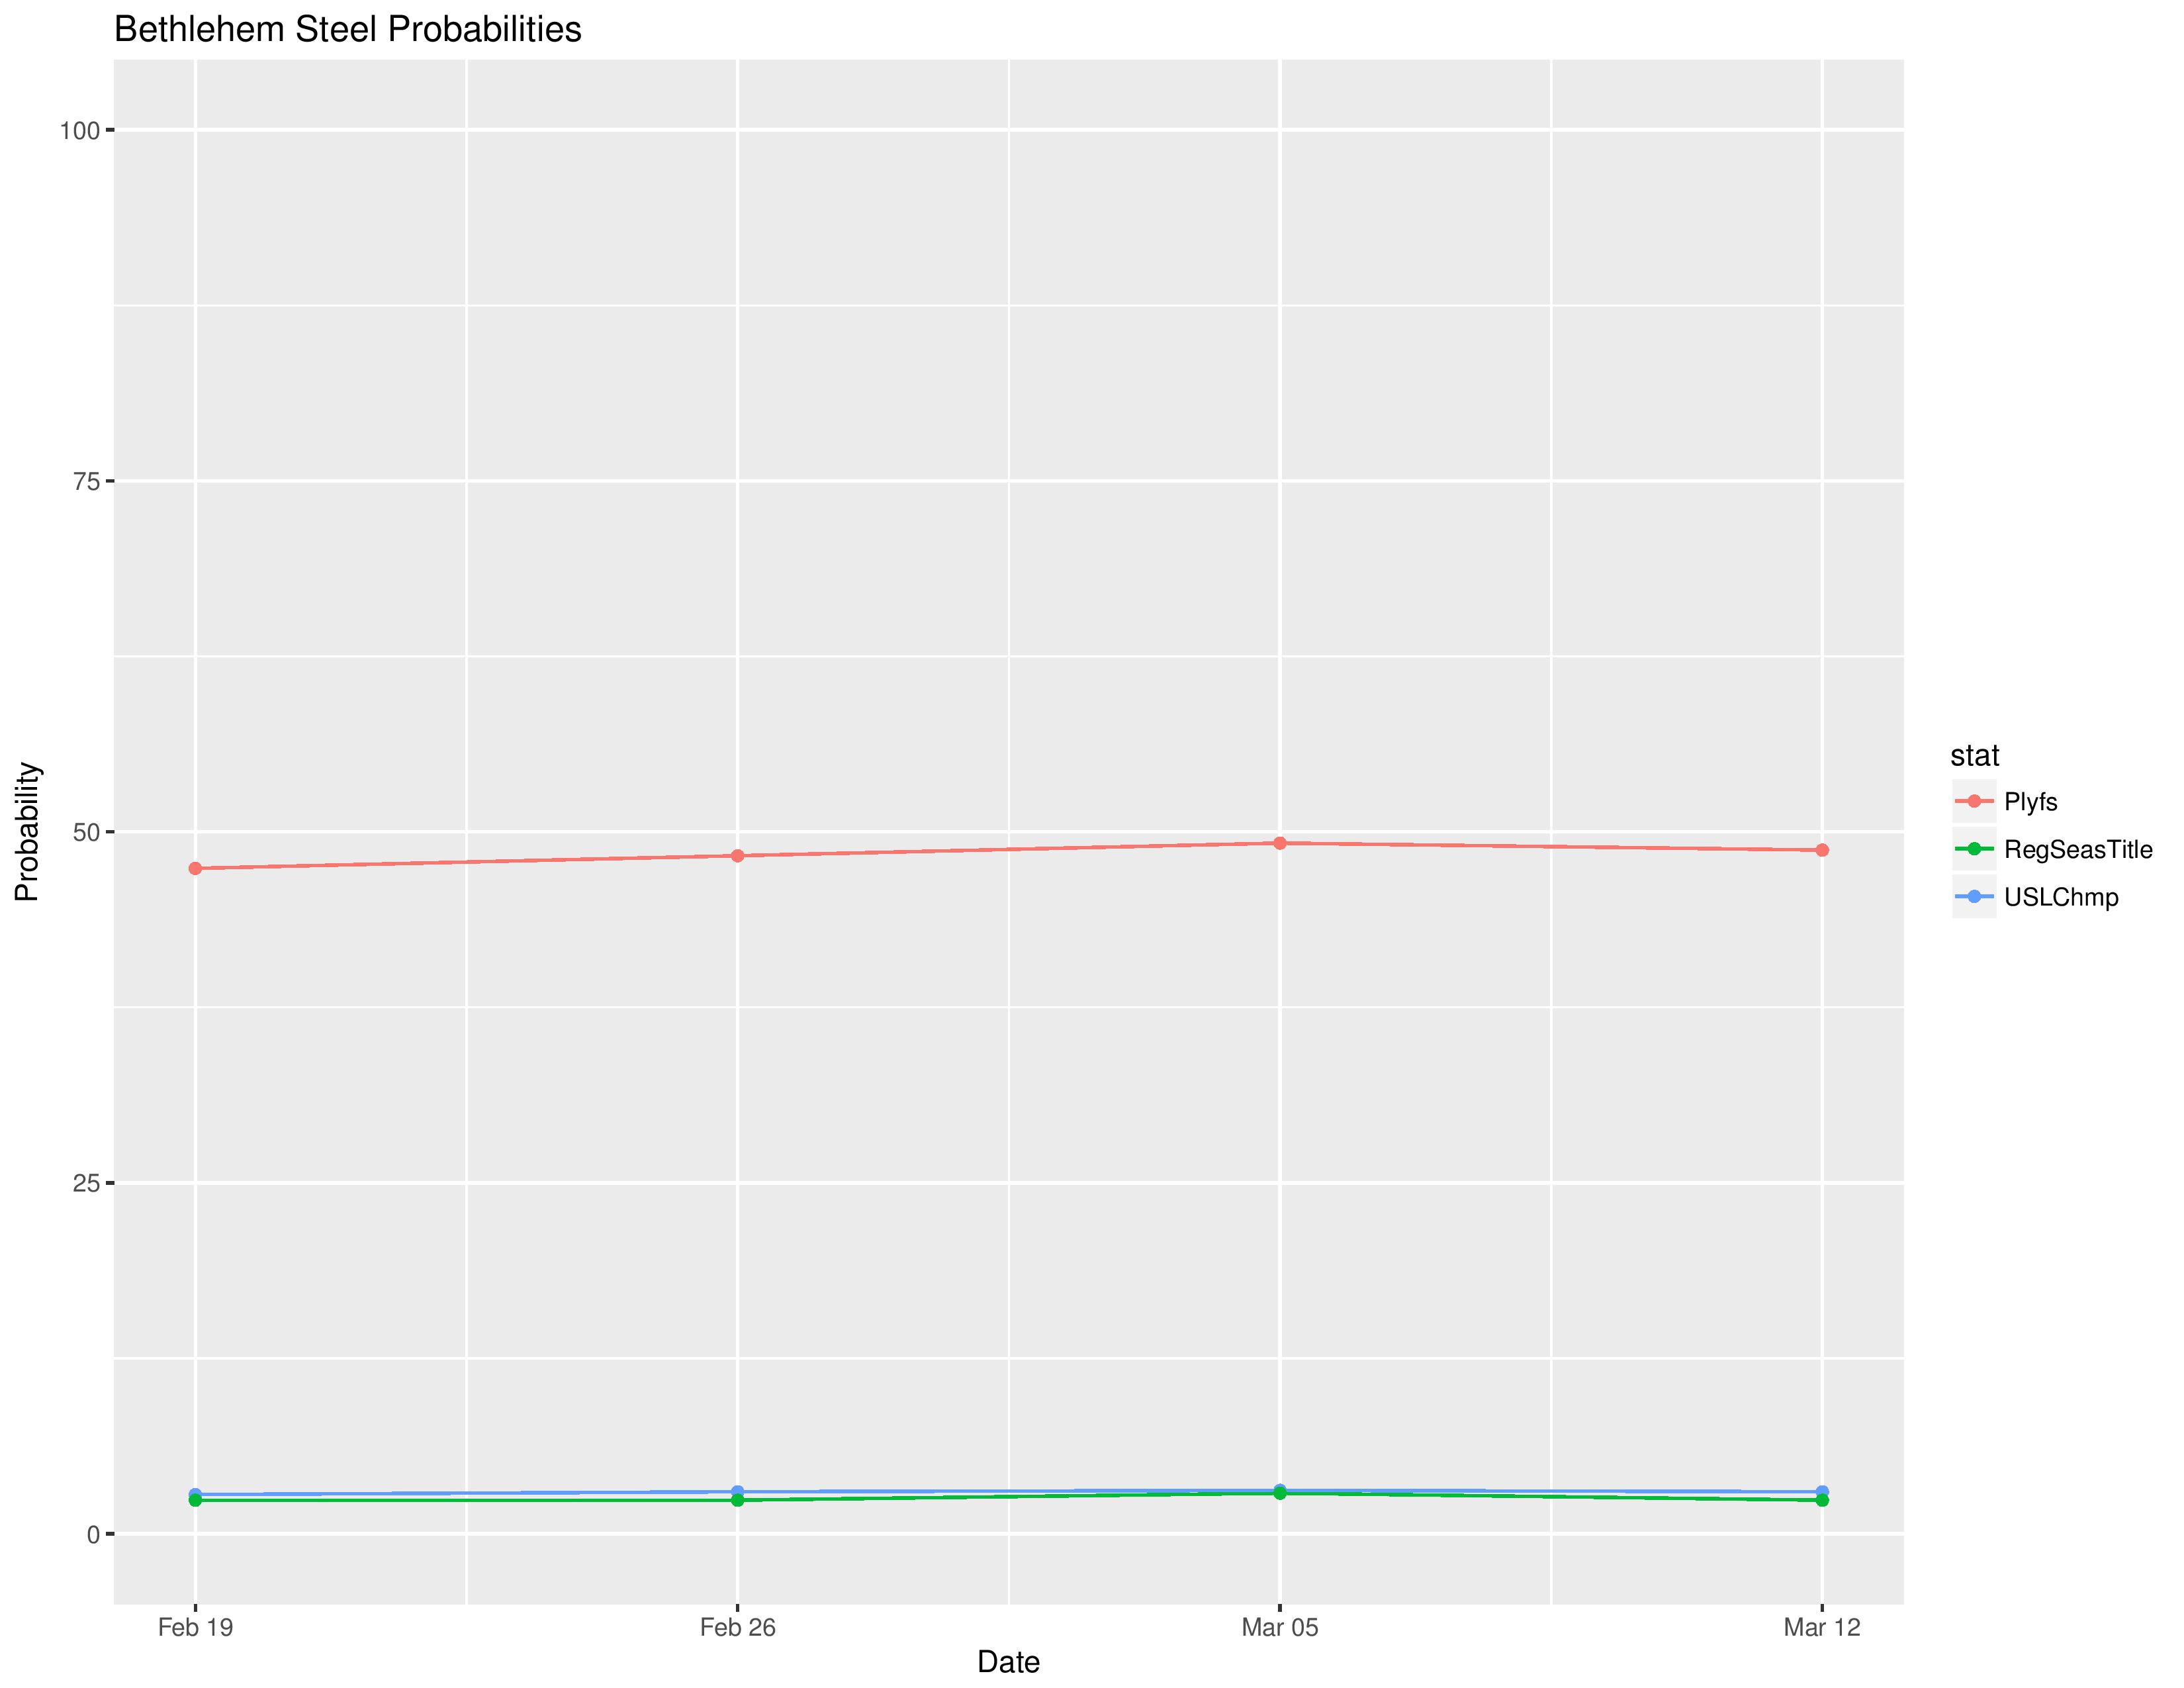
Bethlehem decreased from 49.2% to 48.7% chance of making the playoffs. (Sorry for the cutoff table, I’m working on it, but the interactive charts linked above should be easier to read)
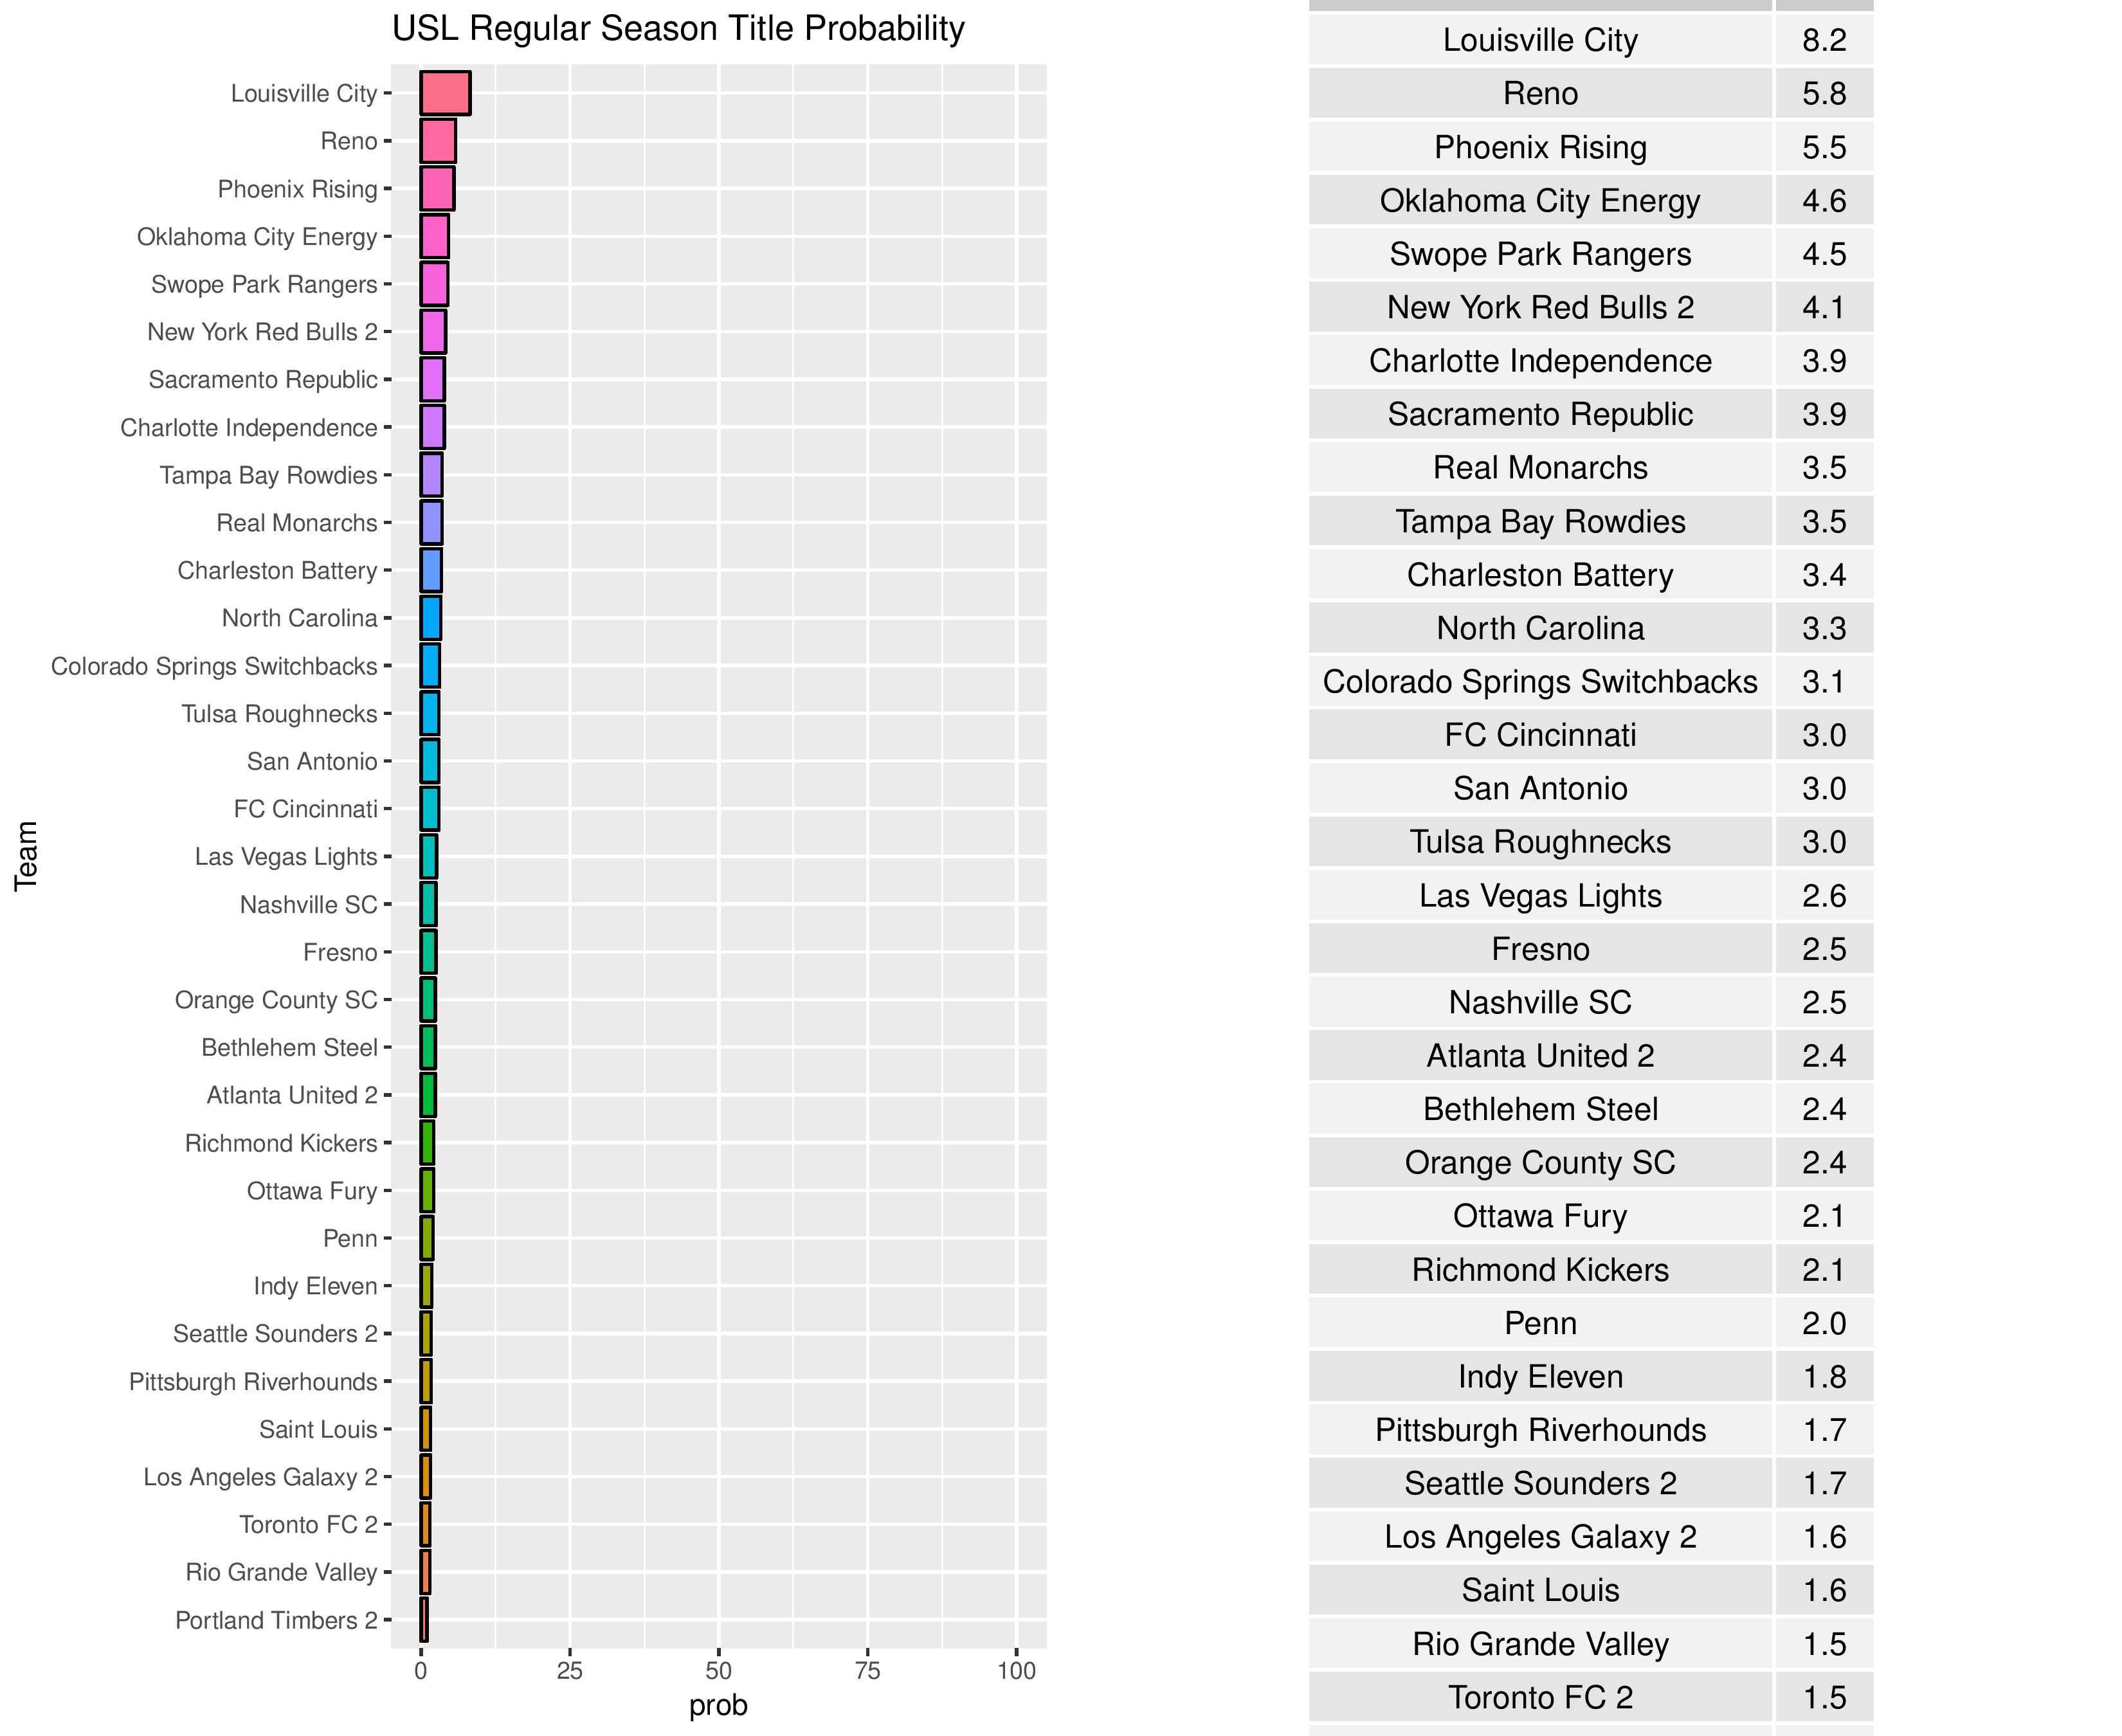
Bethlehem decreased from 2.9% to 2.4% chance of claiming the USL regular season title.
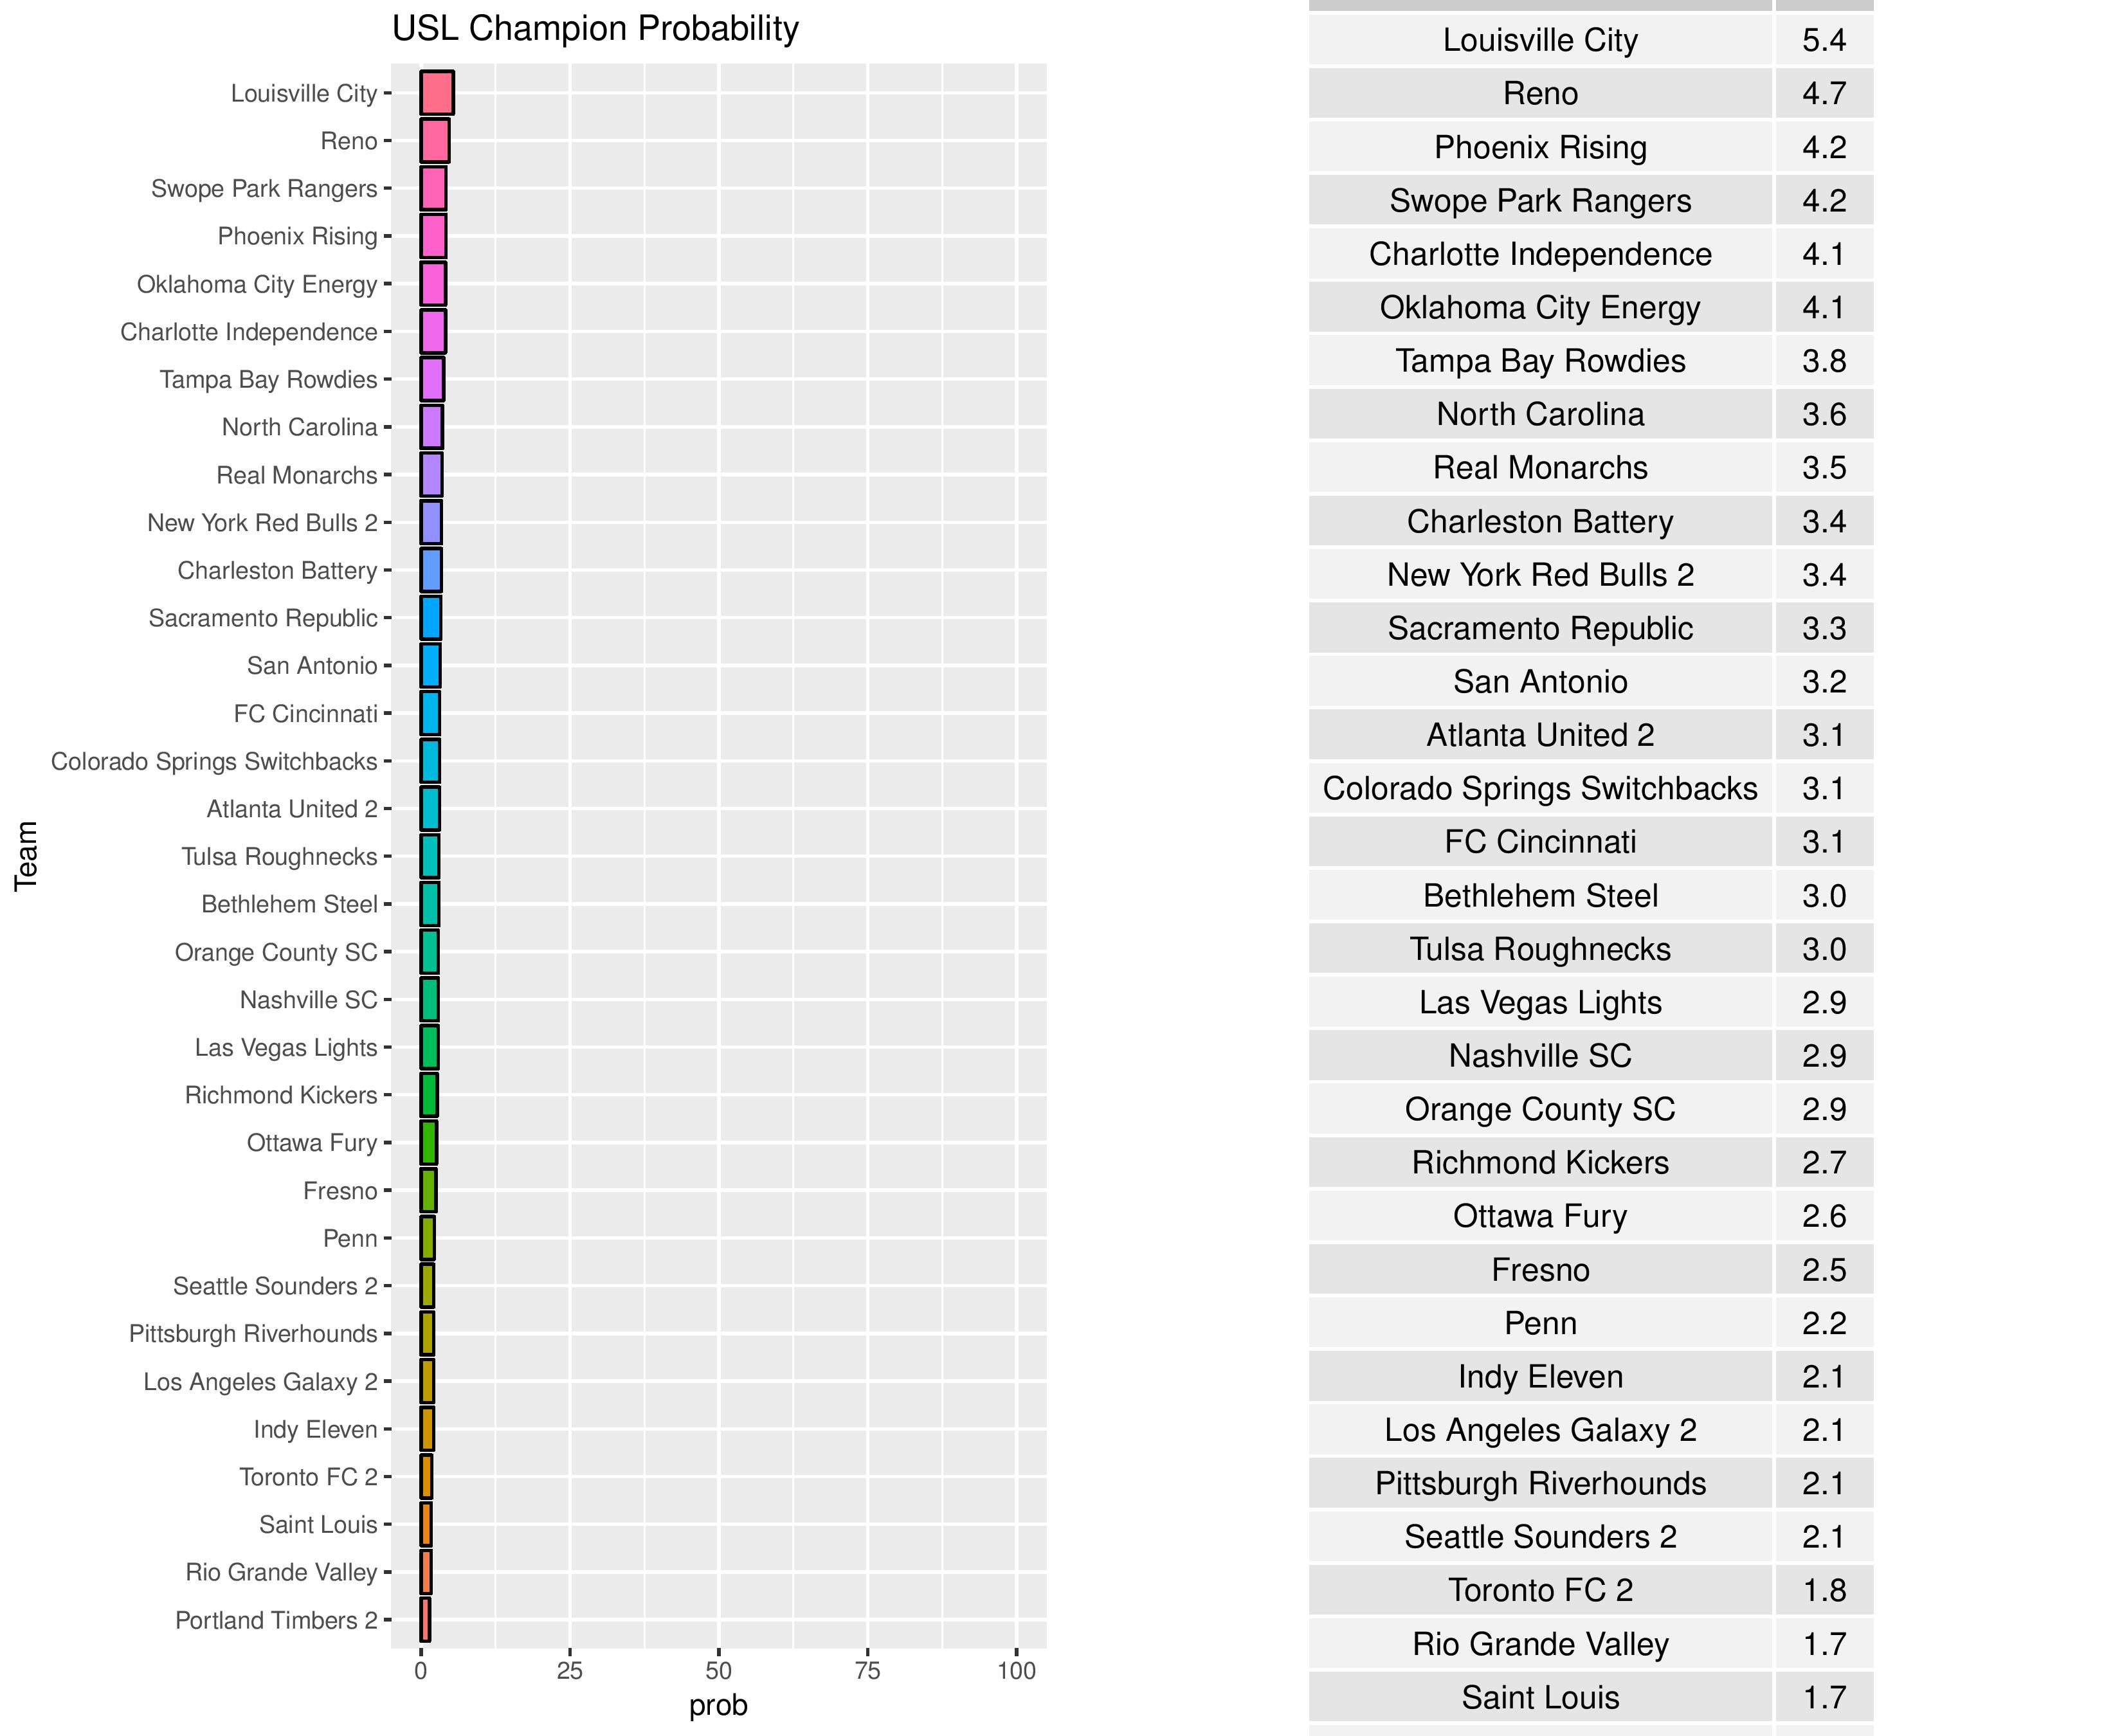
Bethlehem’s odds of winning the USL championship decreased from 3.1% to 3.0%.
The following is Bethlehem’s odds at different prizes over time.
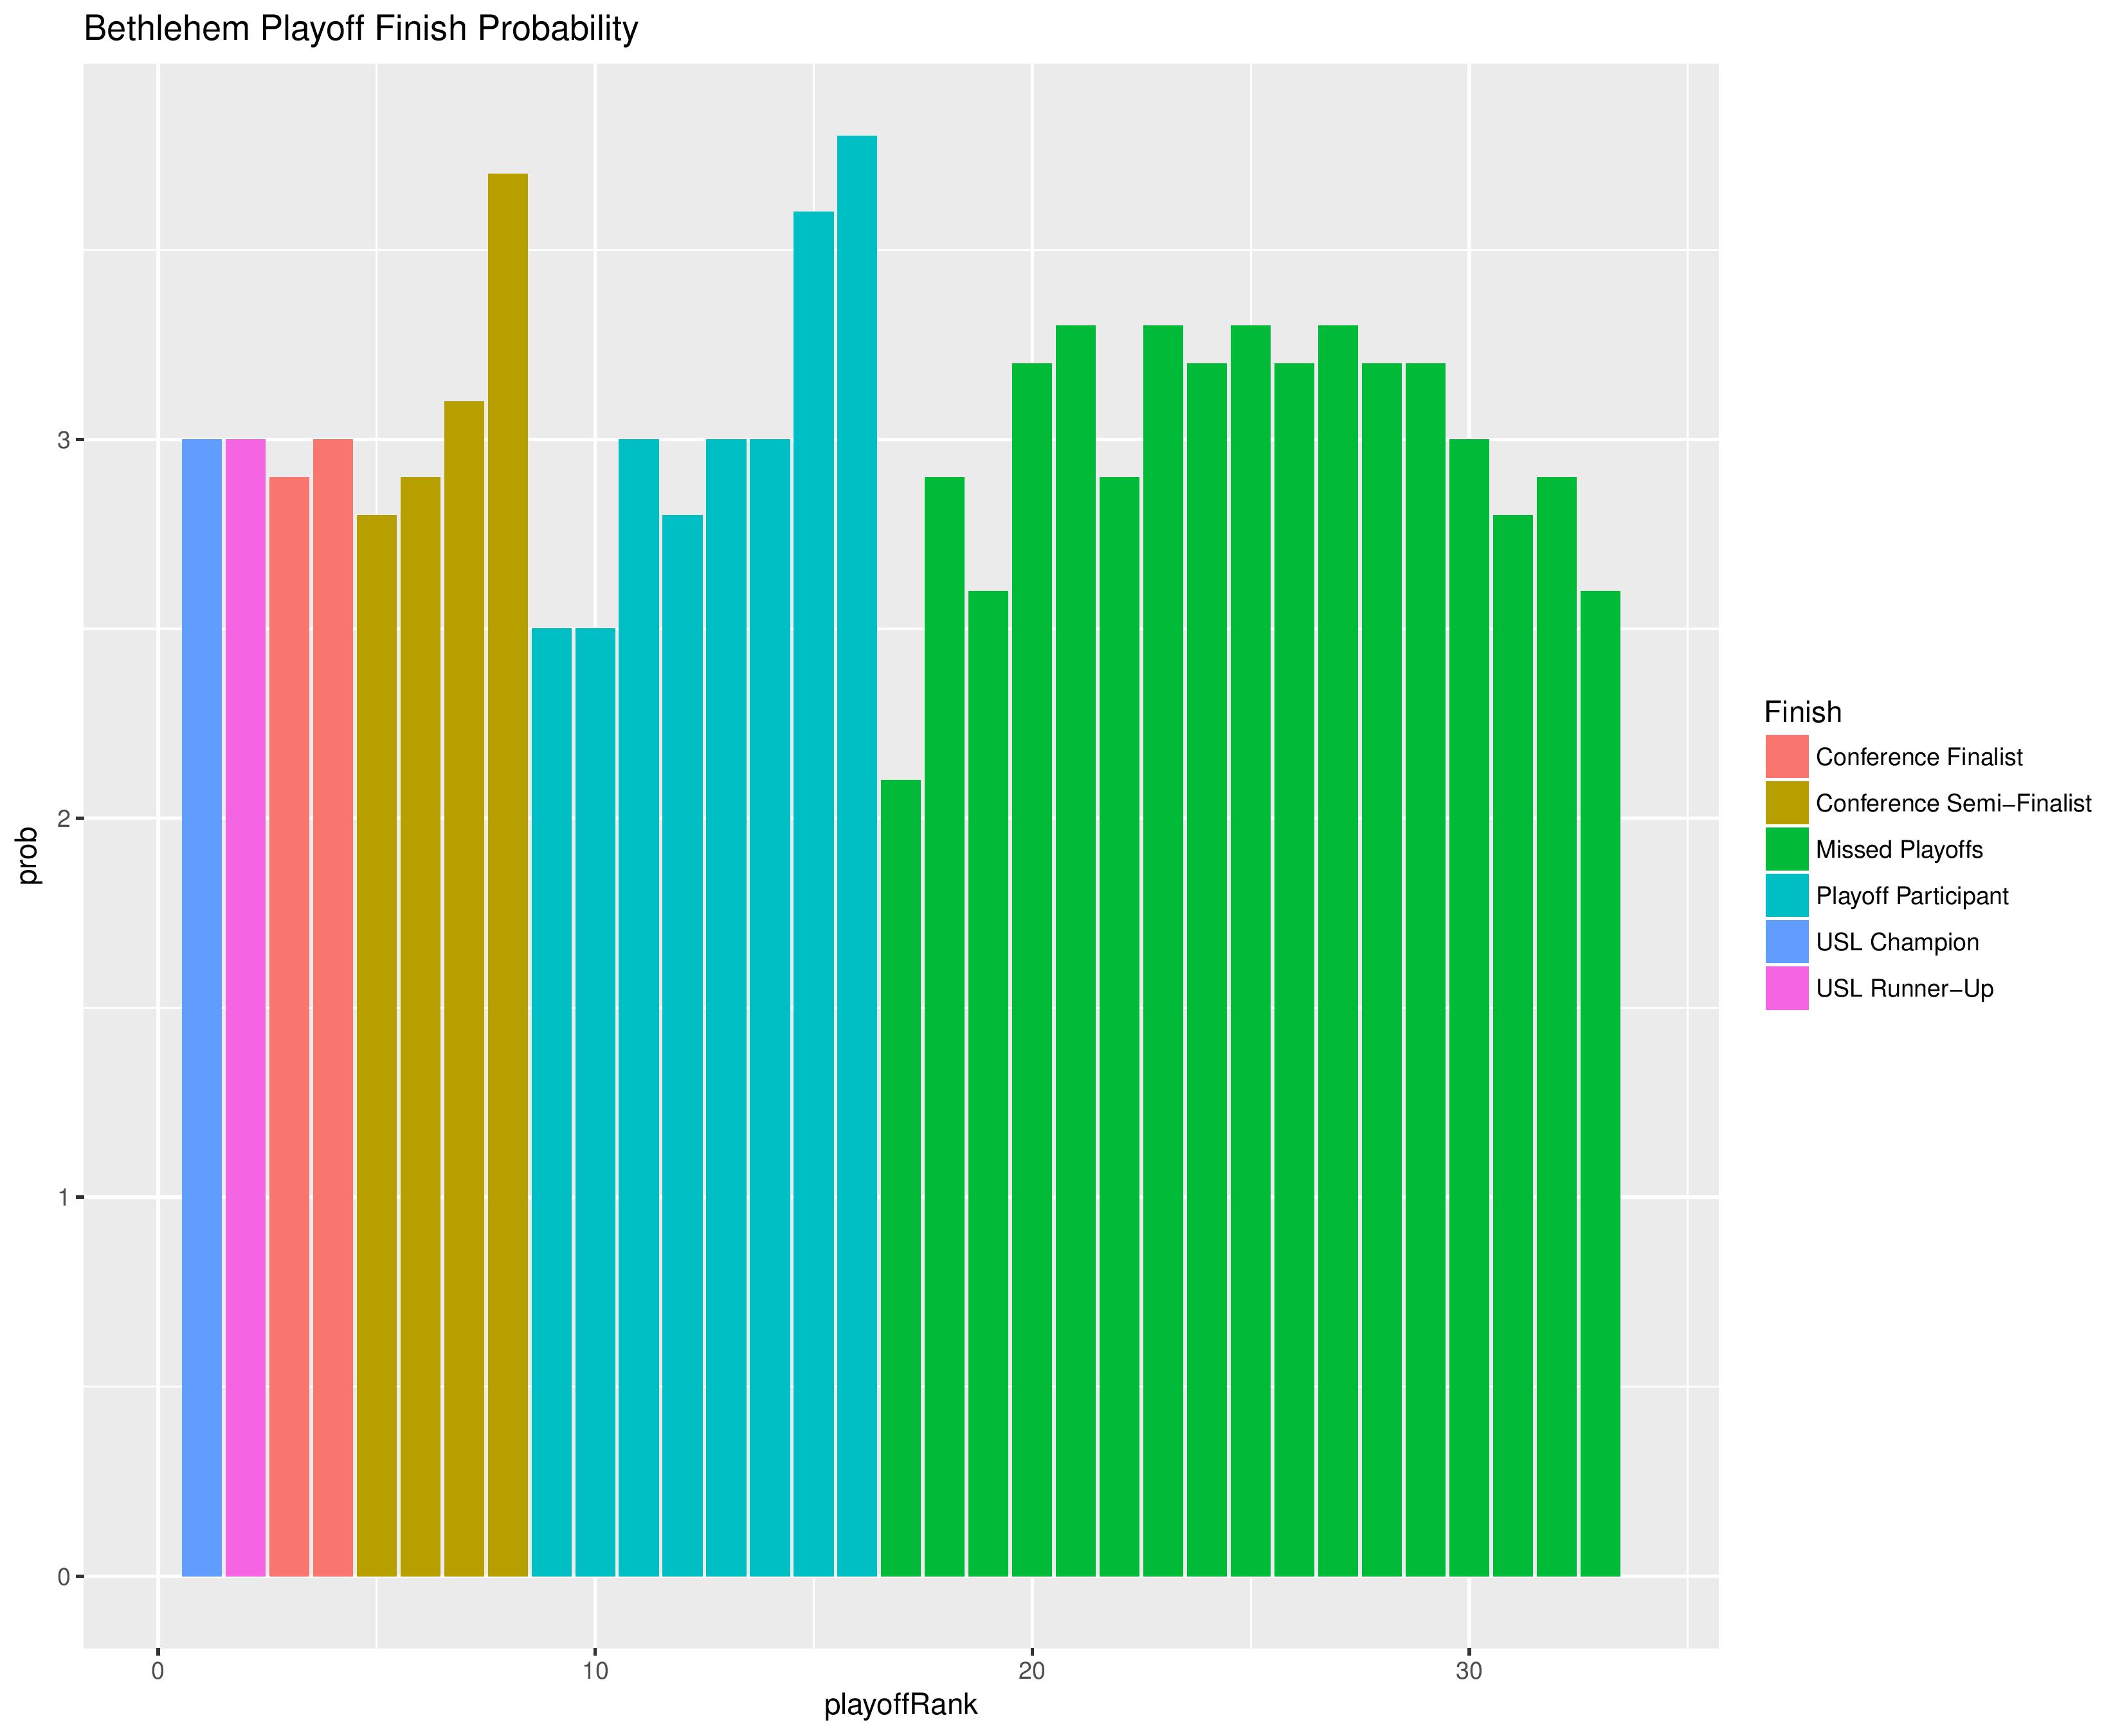
The following shows the probability of each post-playoff ranking finish:
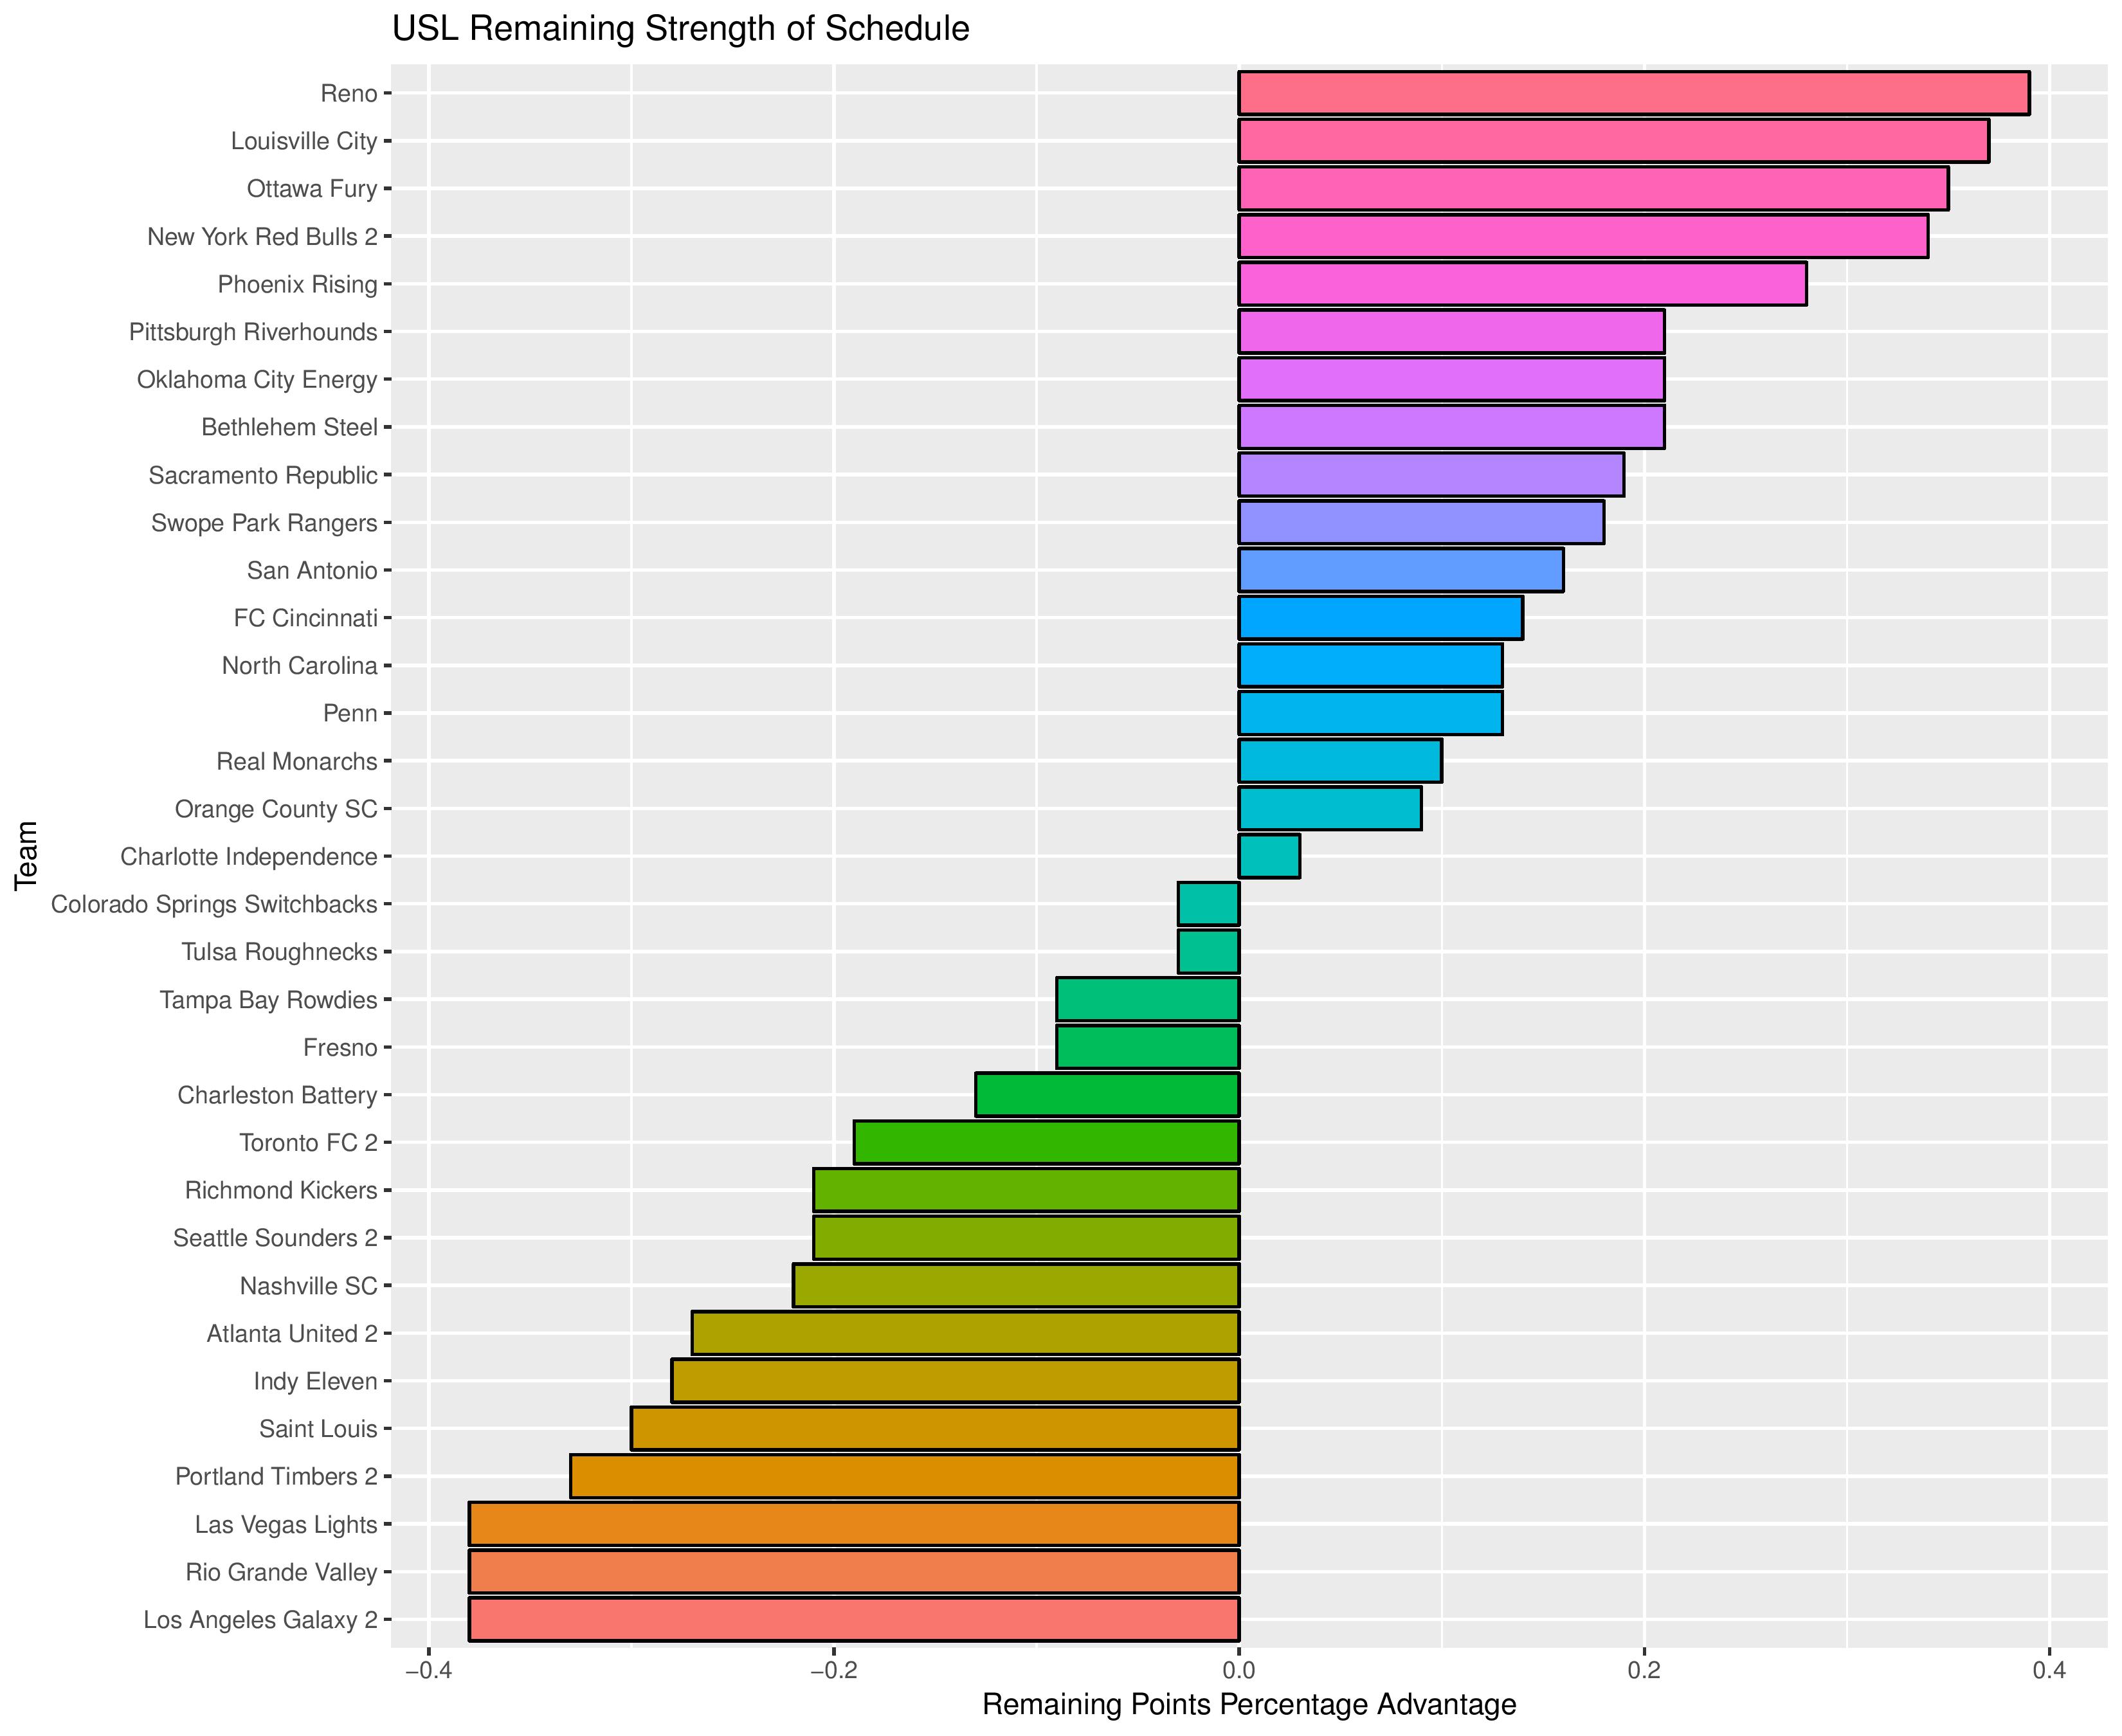
The following is the strength of remaining schedules for each team. Higher values mean an easier remaining schedule.
The following are the upcoming expectations for Bethlehem matches.

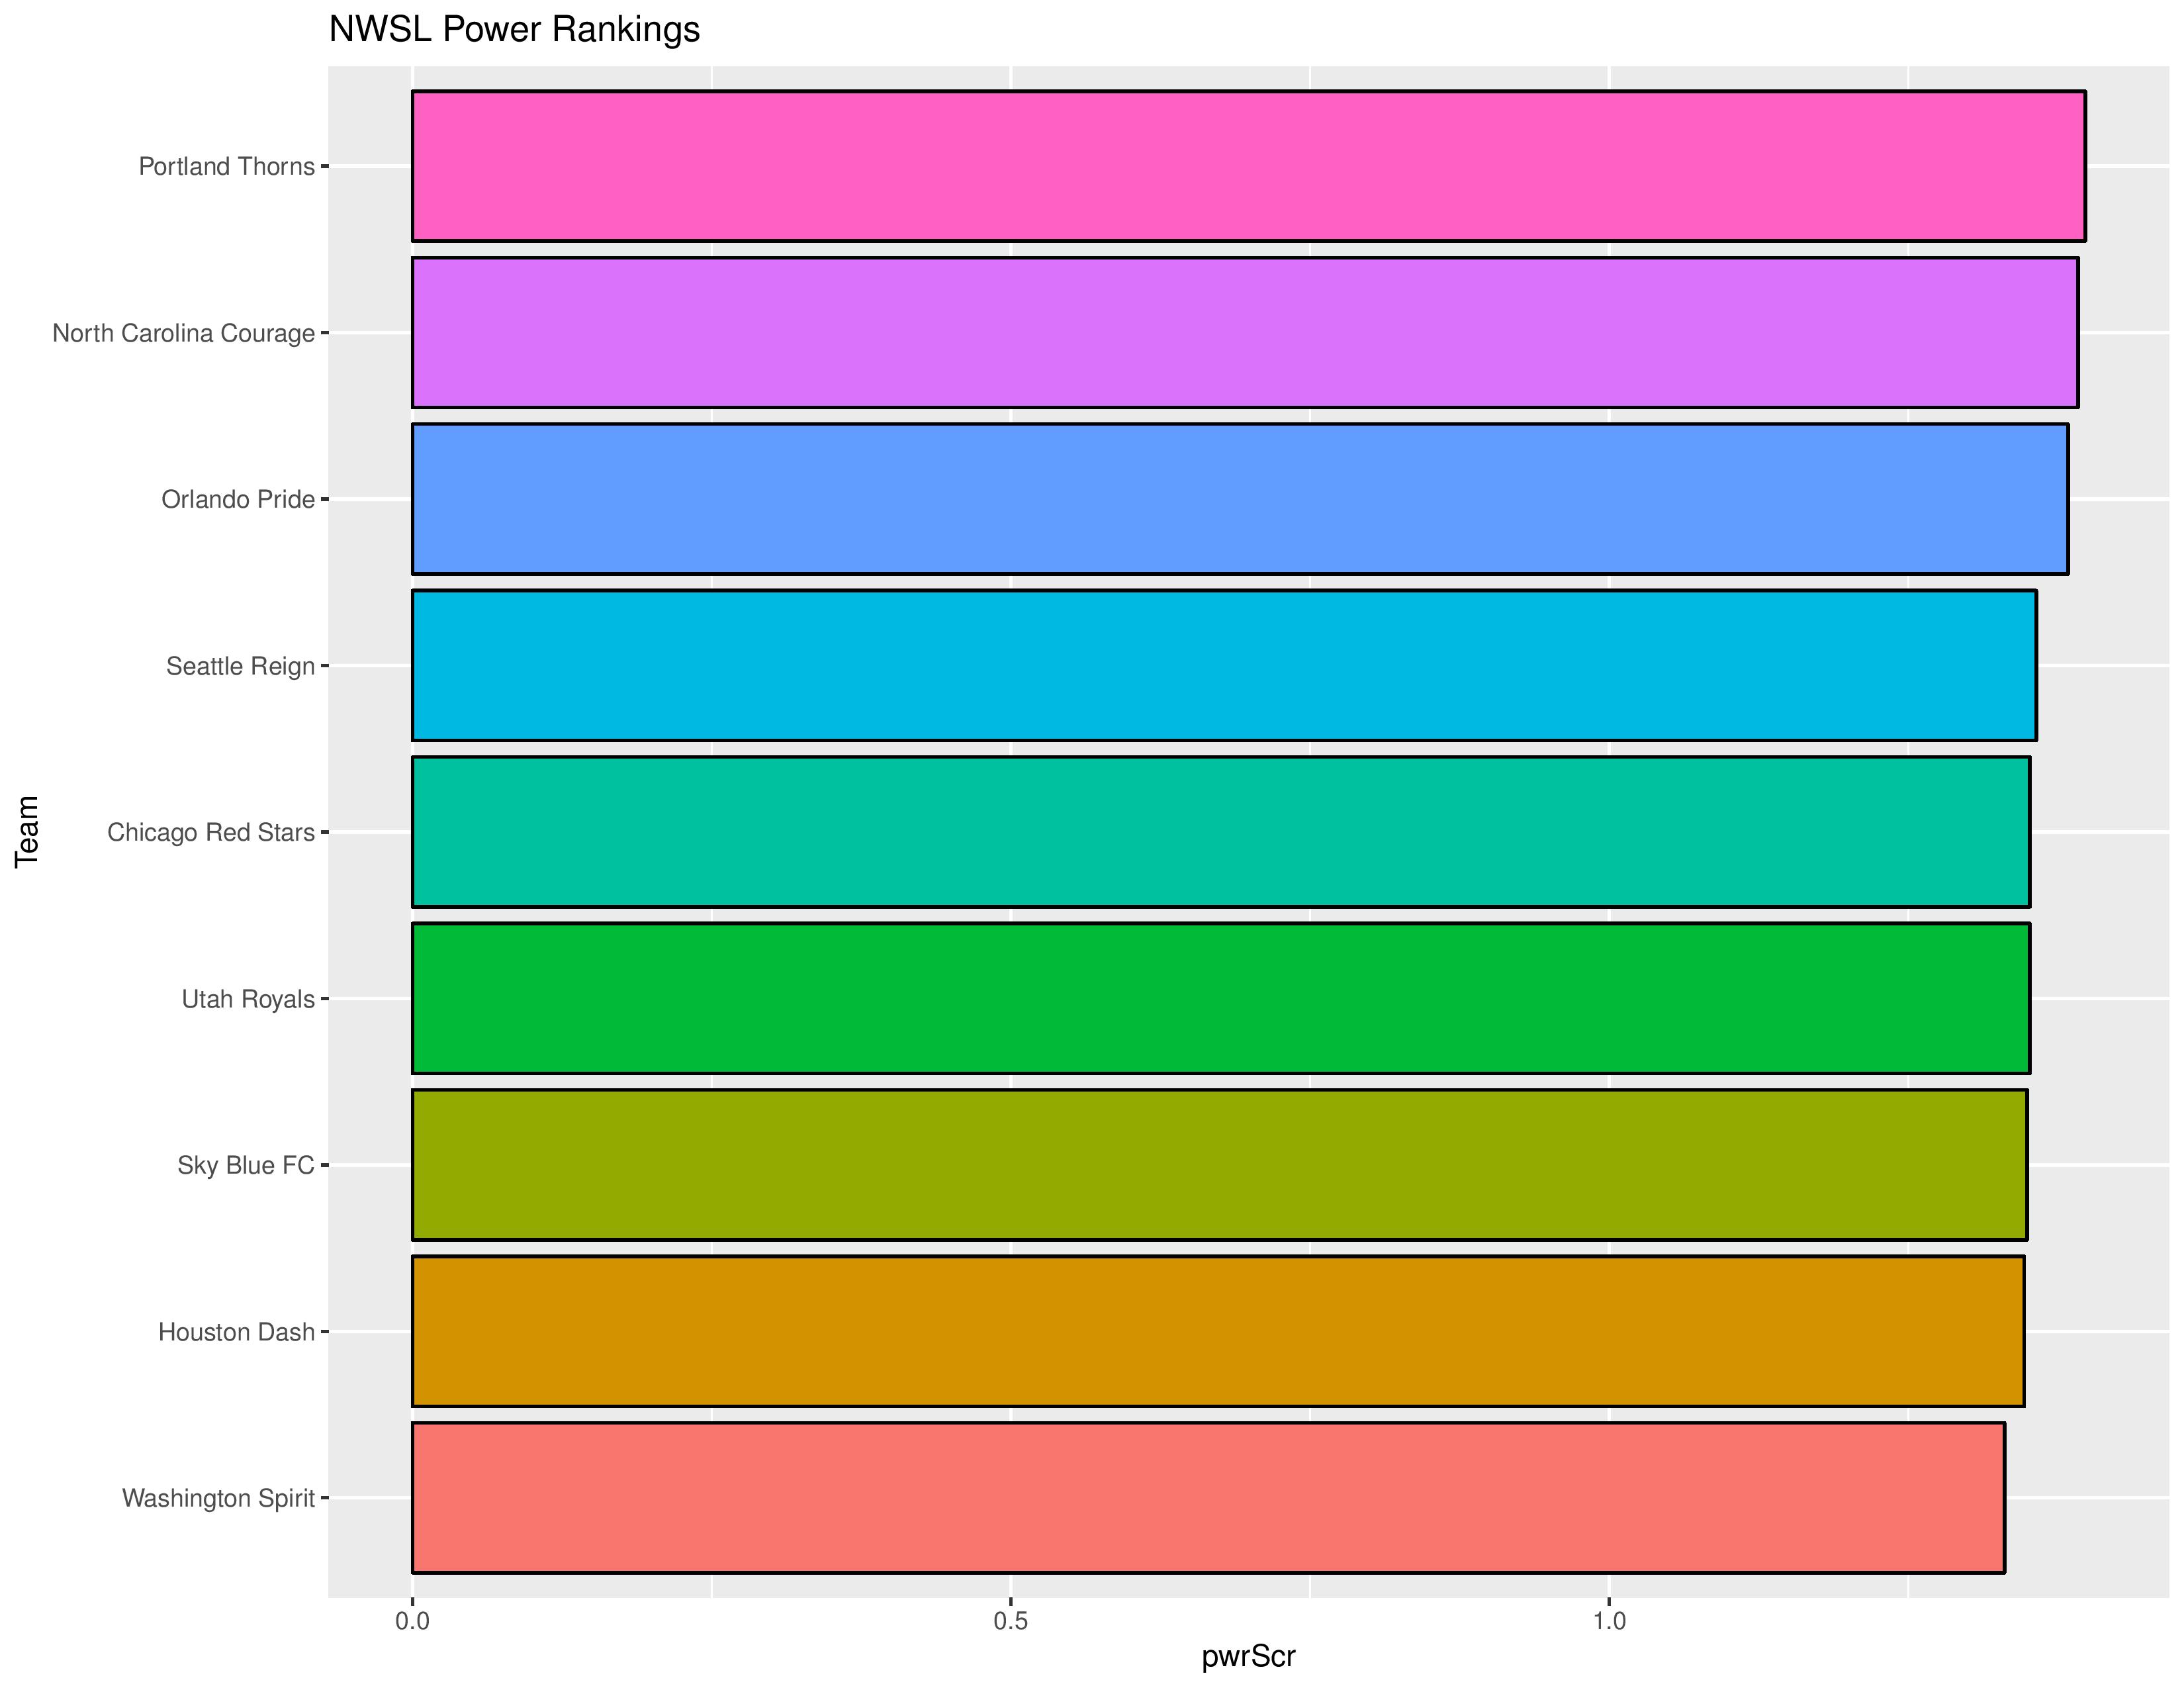
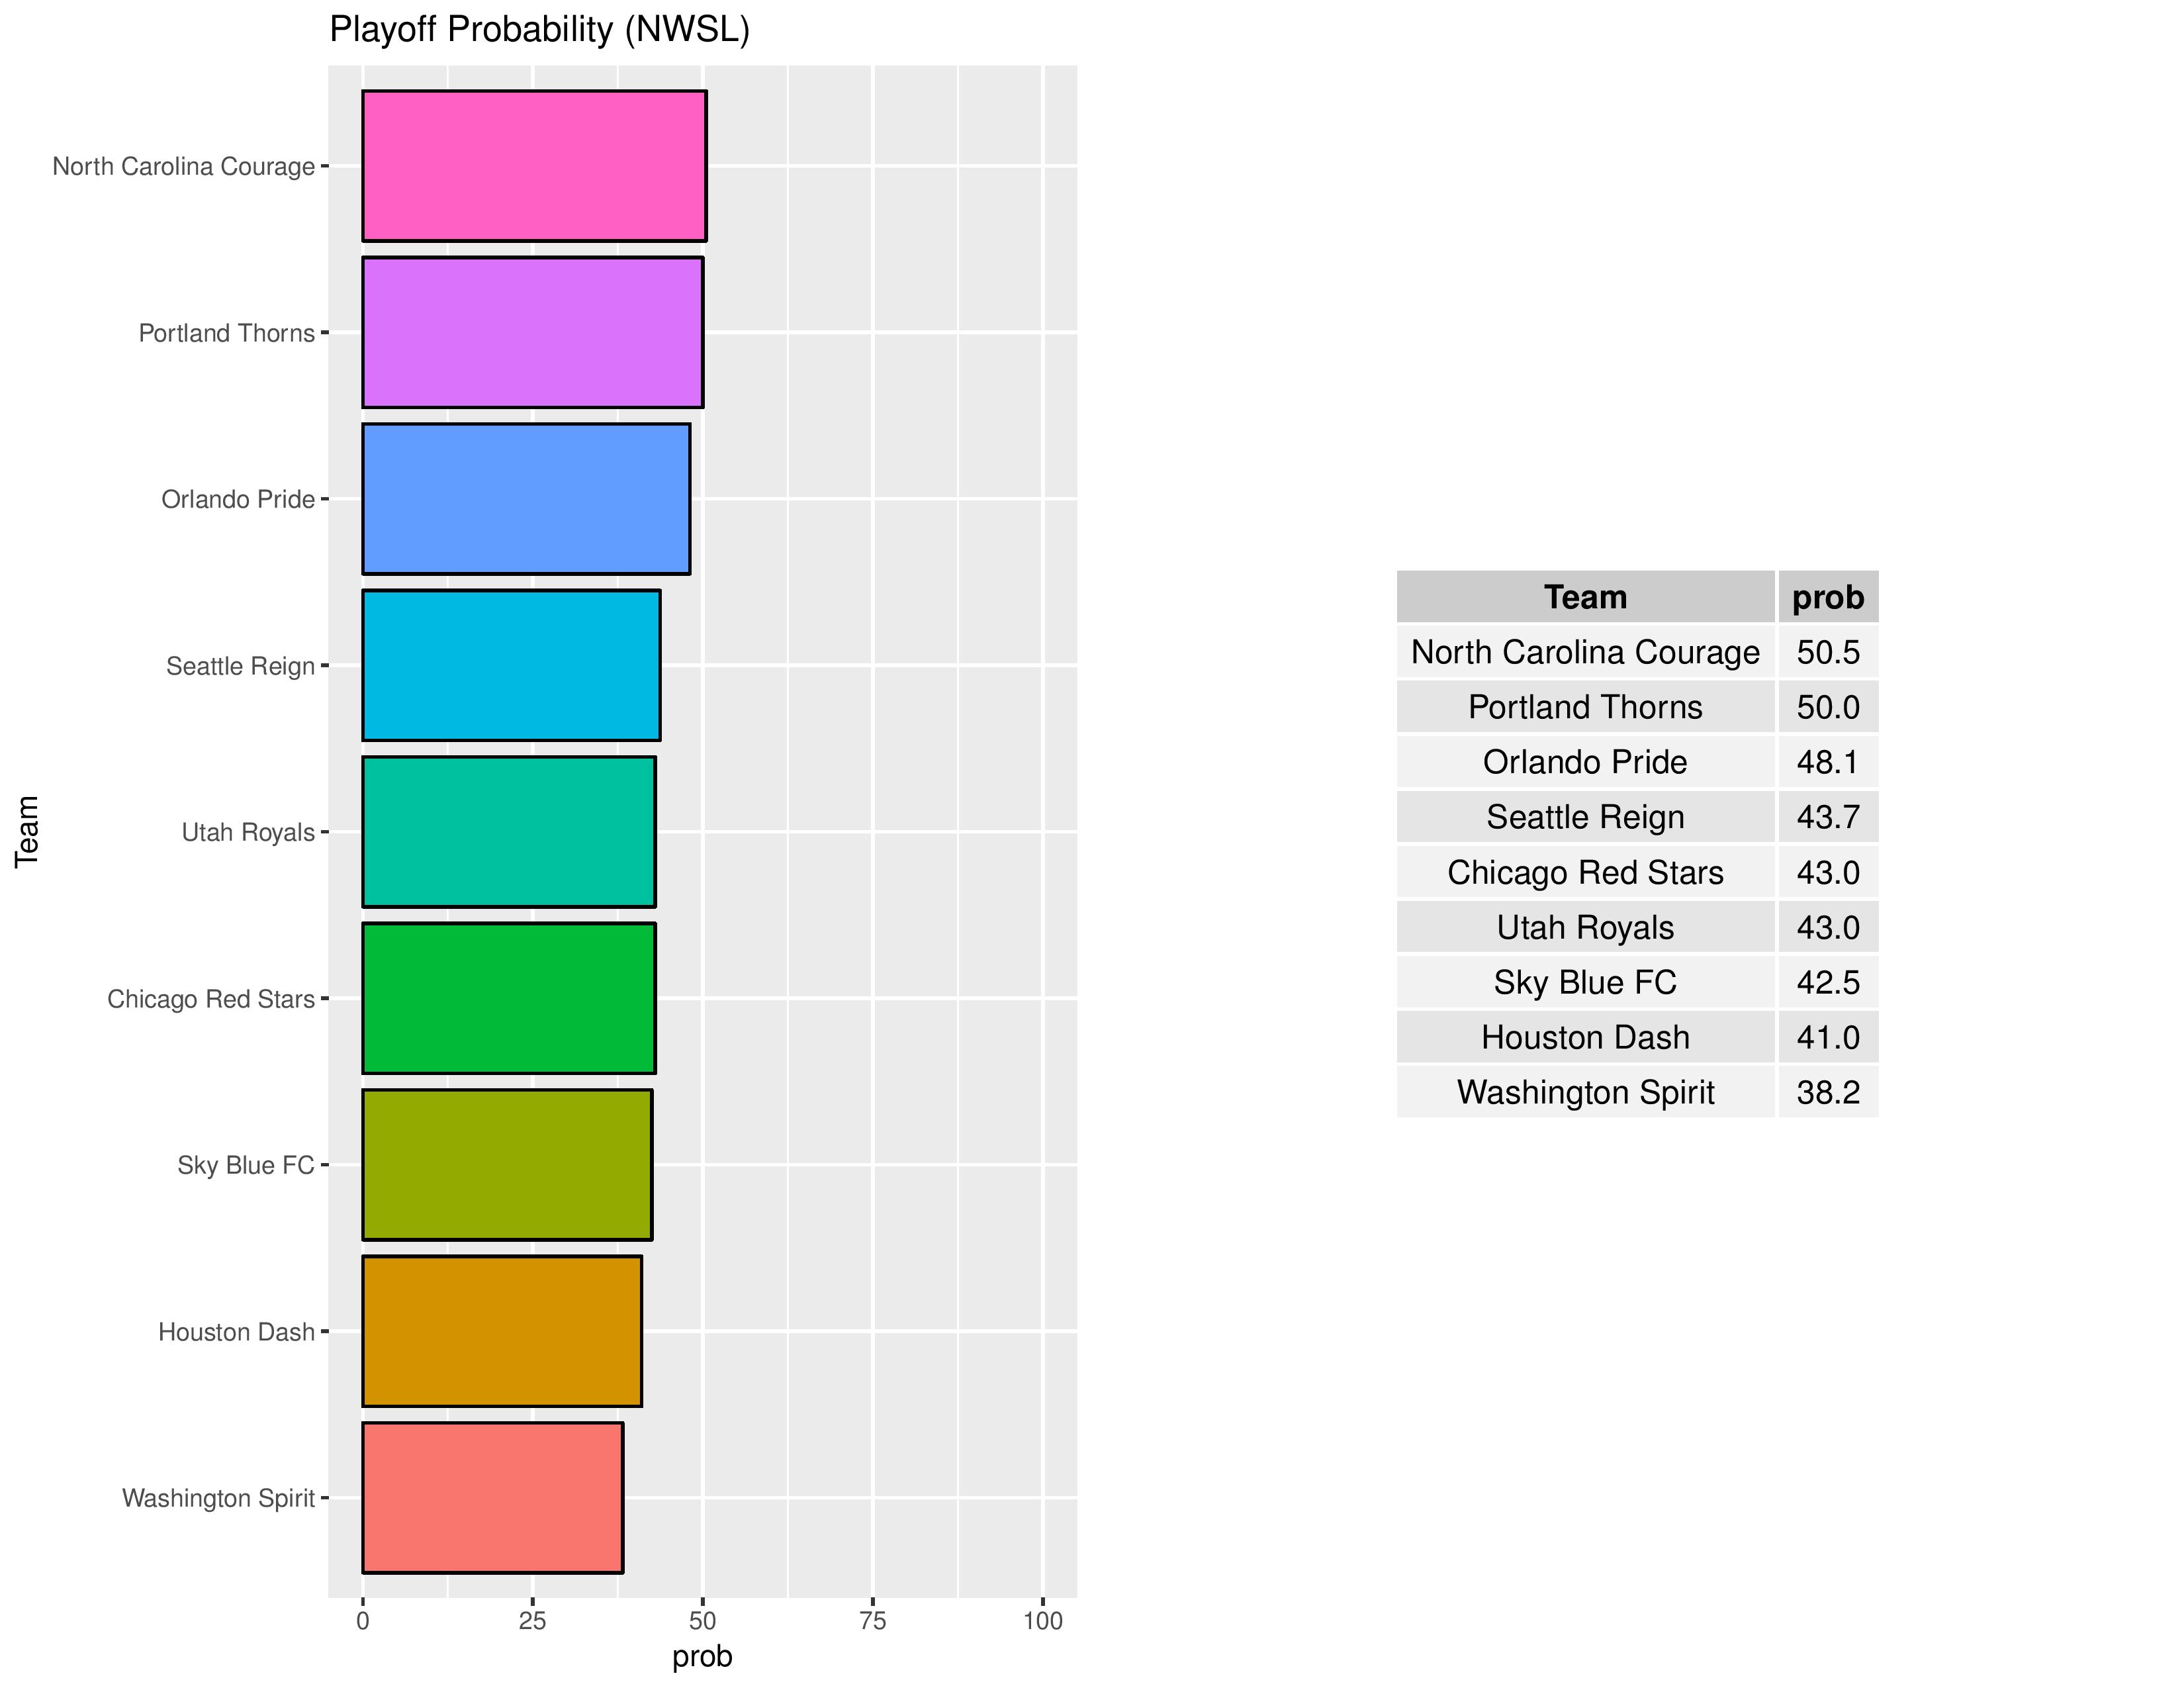
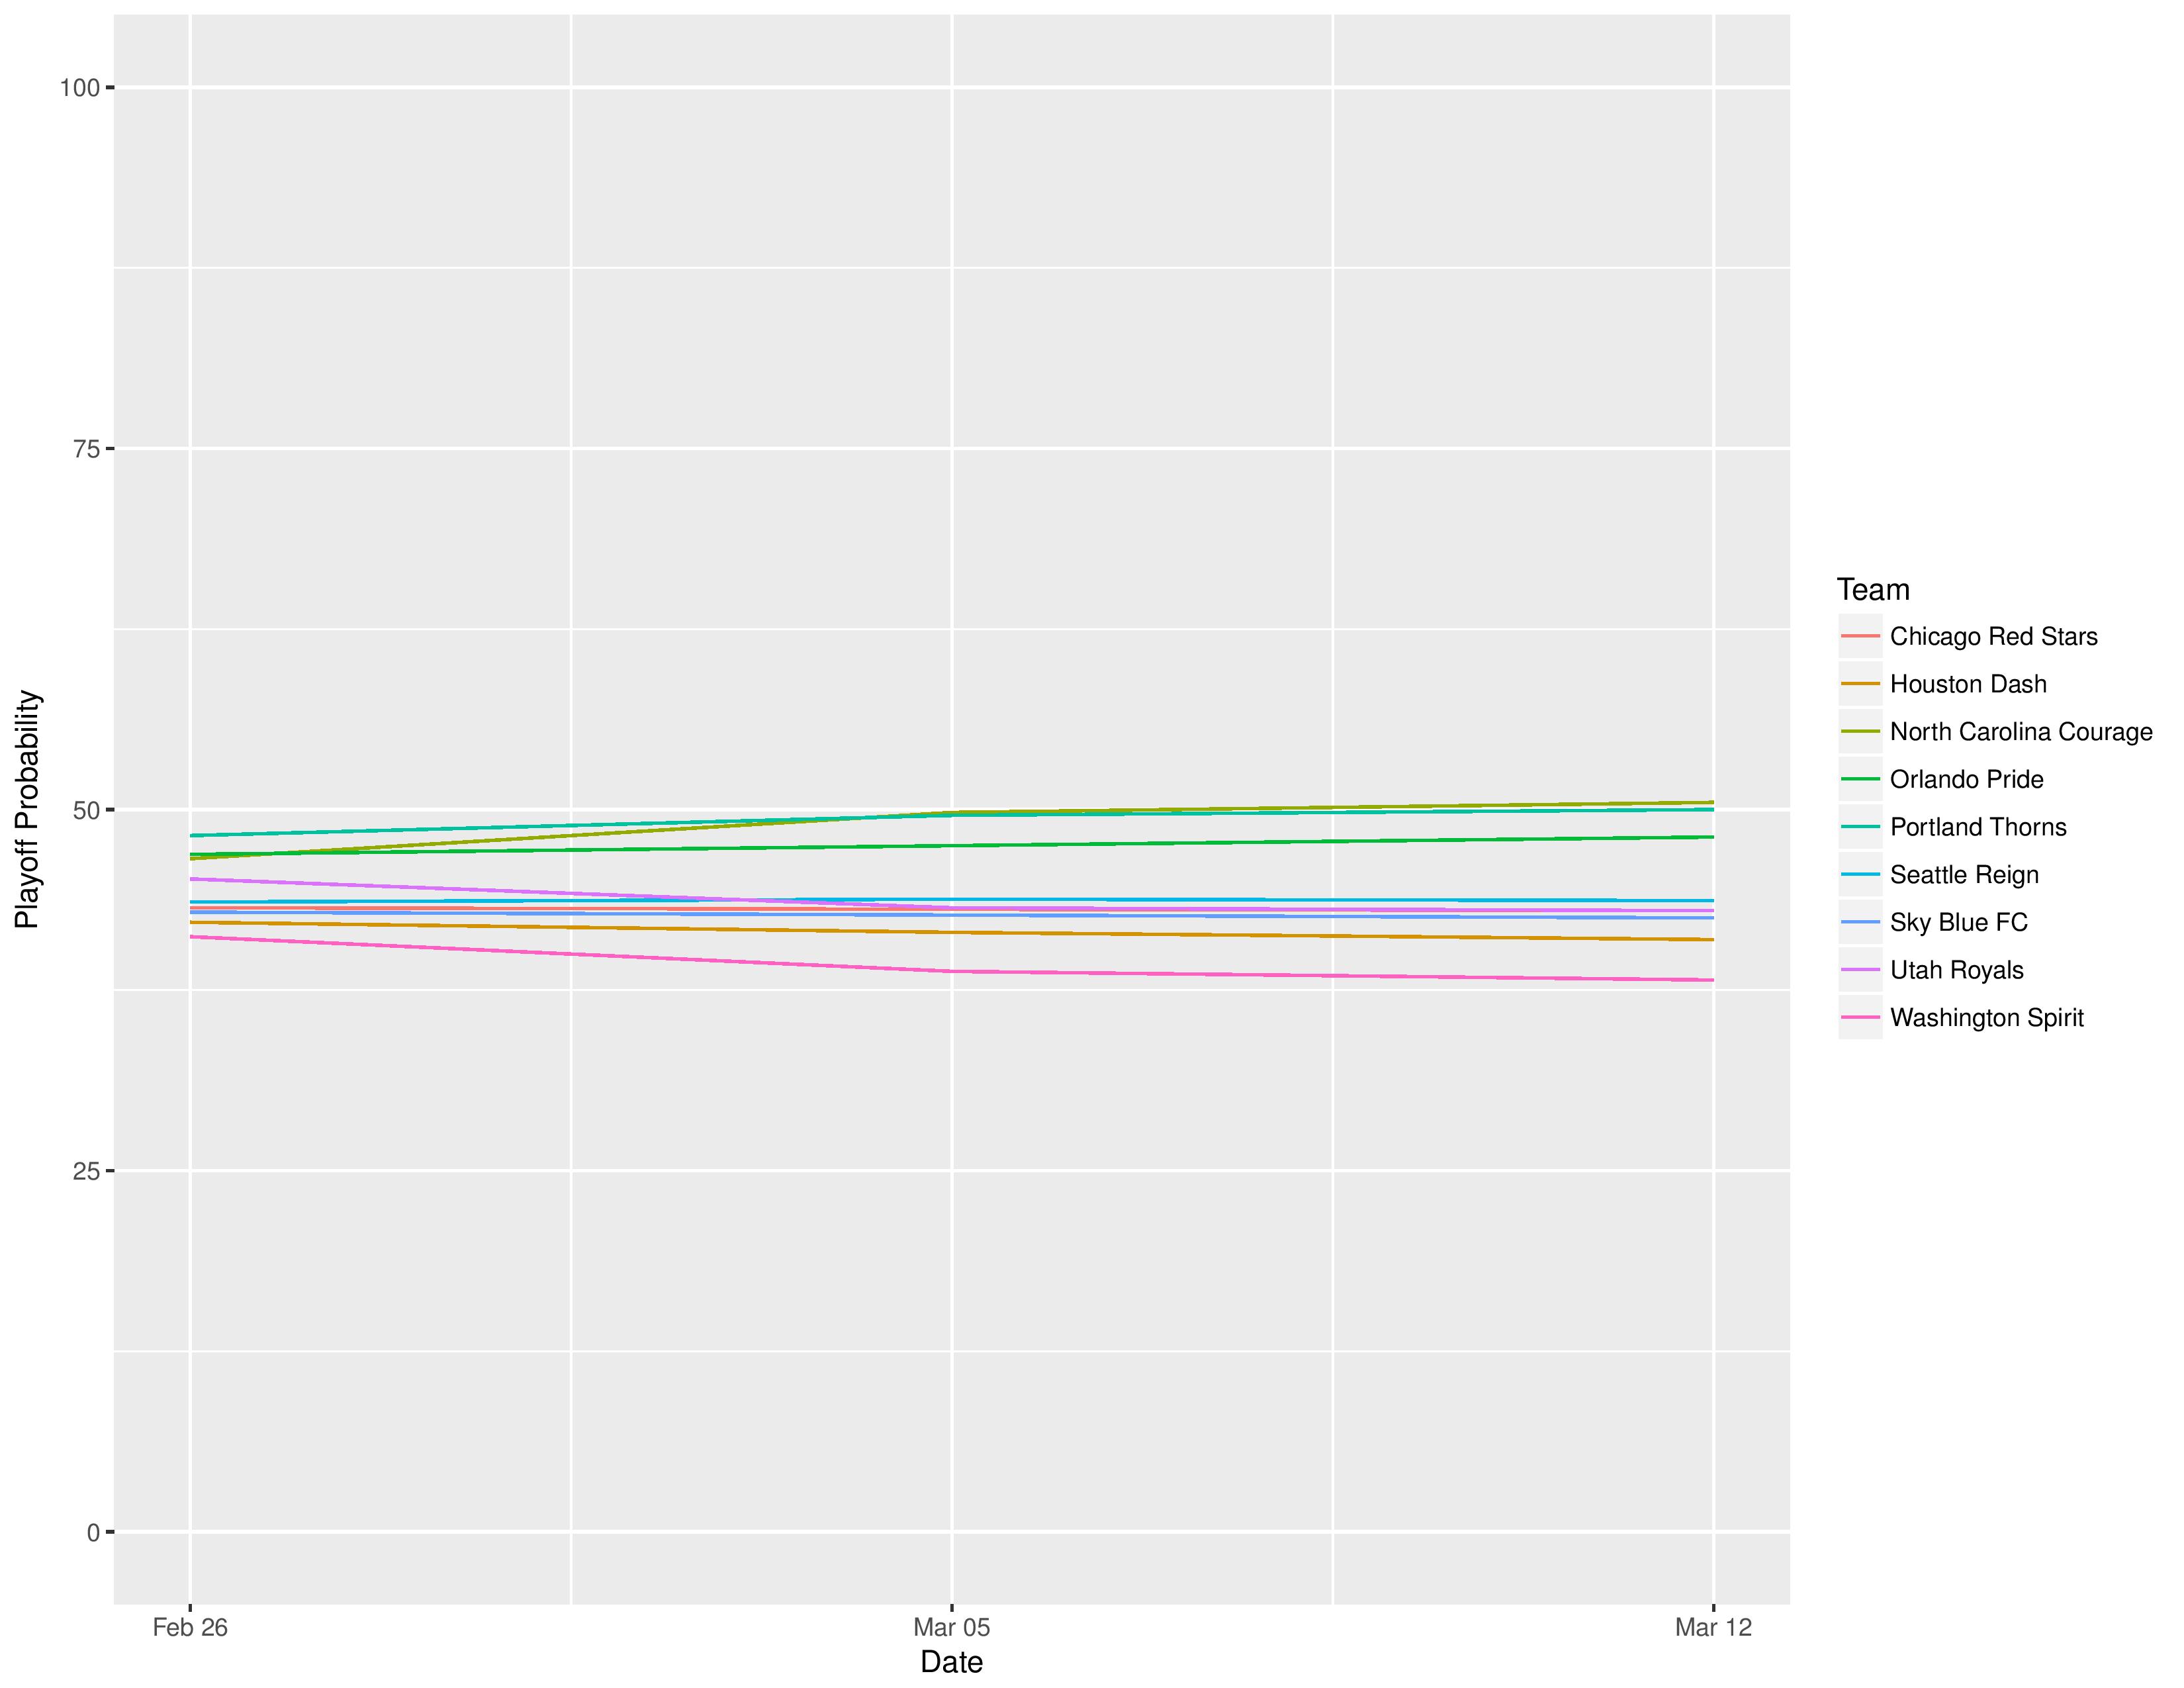
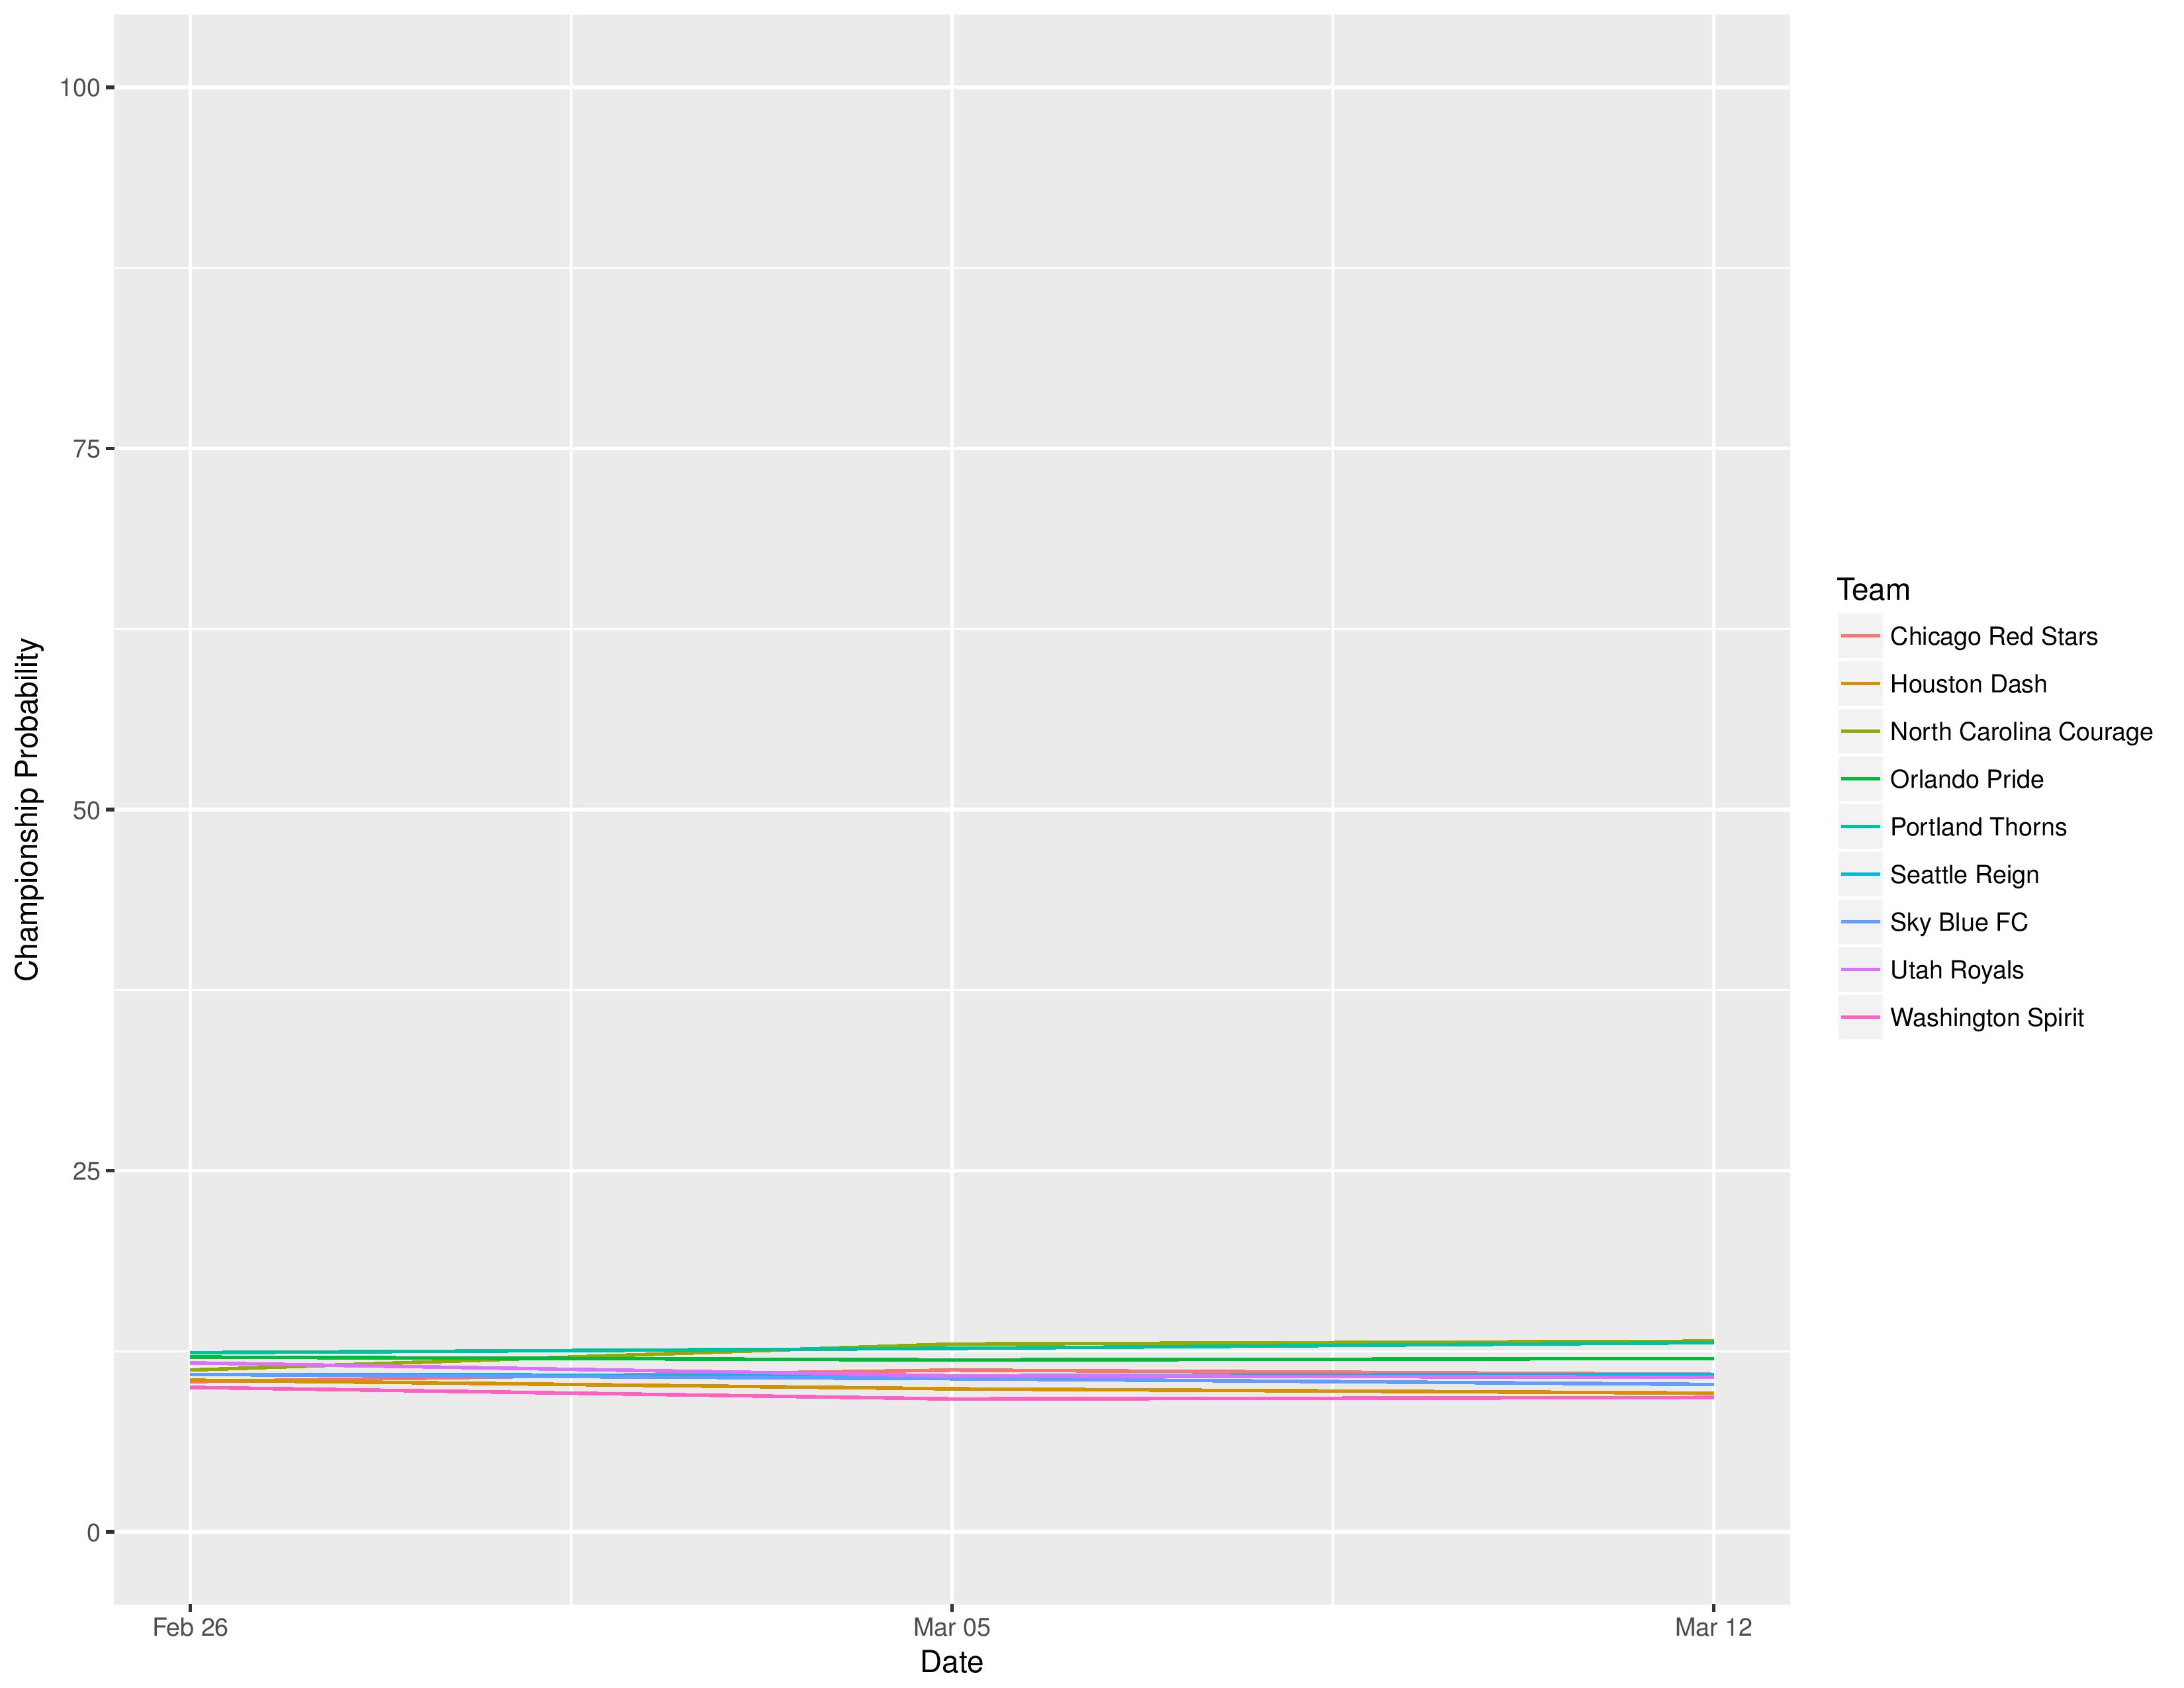
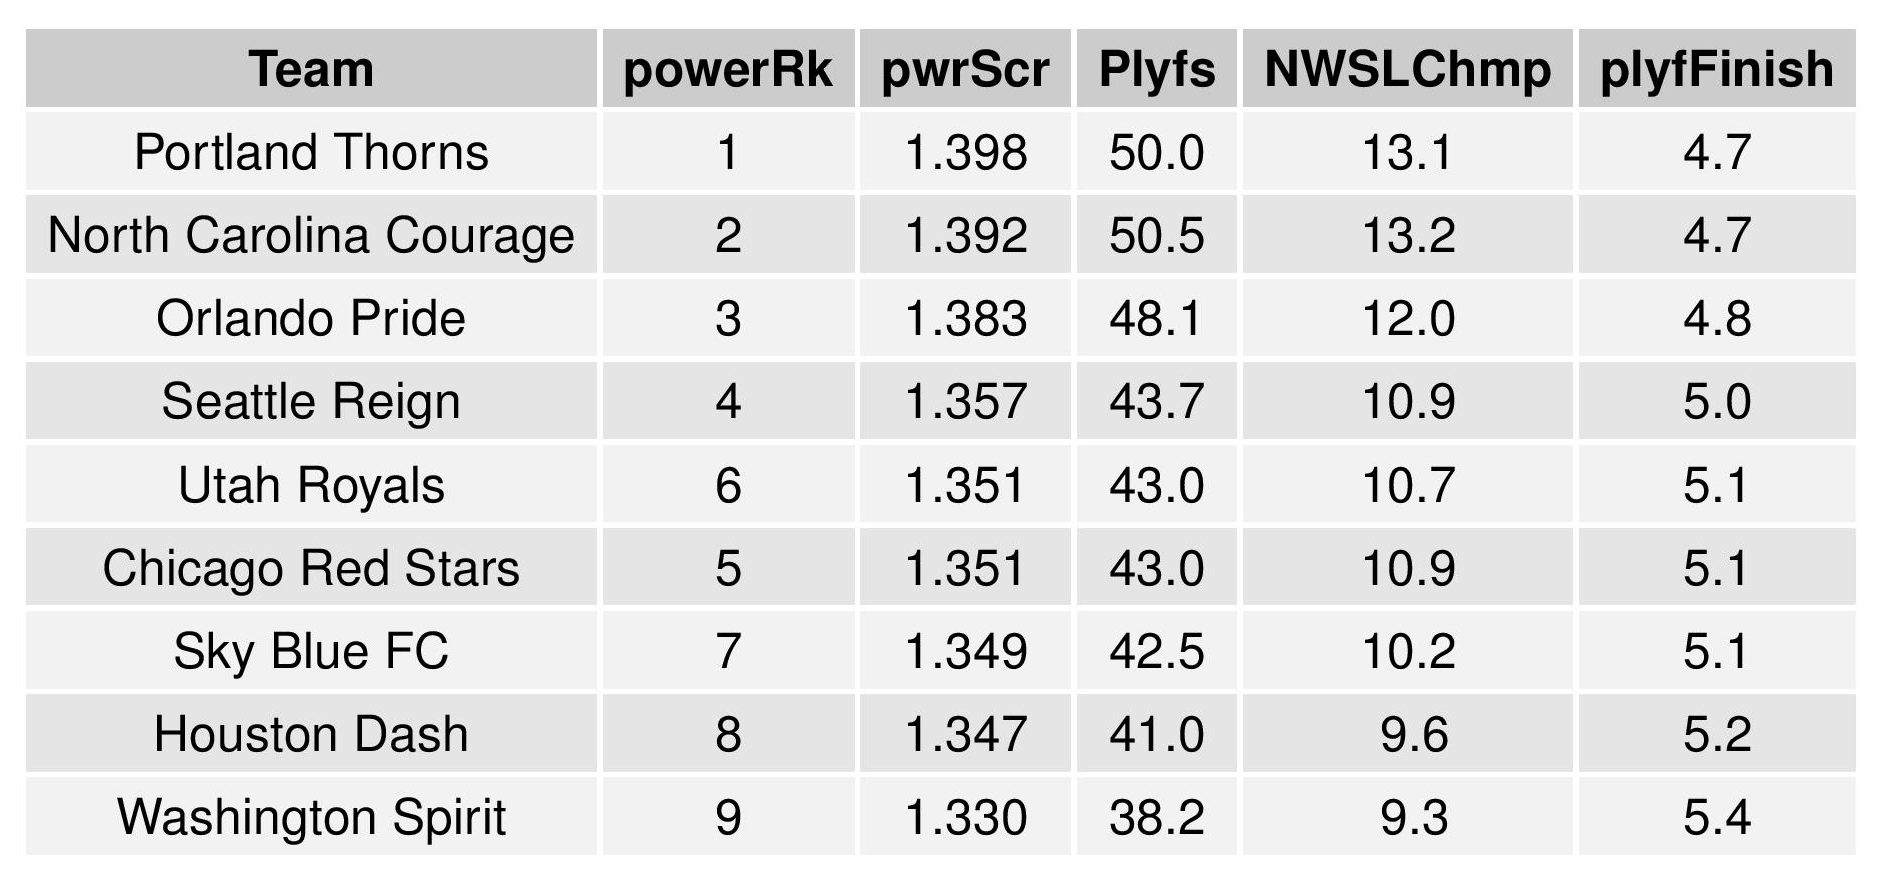
NWSL
The following are the initial projections for the 2018 NWSL season. Like the USL, these are based solely on matches from 2017 and the additional factor of distance traveled.


The following shows the remaining strength of schedule, as we project. Higher values represent easier remaining schedules.


Love the new interactive graphs.
.
I only pay attention to the USL eastern conference in any serious way. Enzo Martinez has left Charlotte, so they are likely to be closer to their 2016 performance than their 2017.
.
And Bob Lilley has moved from coaching Rochester to coaching Pittsburgh. Pittsburgh’s performance will probably be closer to Rochester’s than Pittsburgh’s.
.
And Ottawa has Swope Park Rangers old coach.