Below are the updated season forecasts using data from games through April 9, 2017.
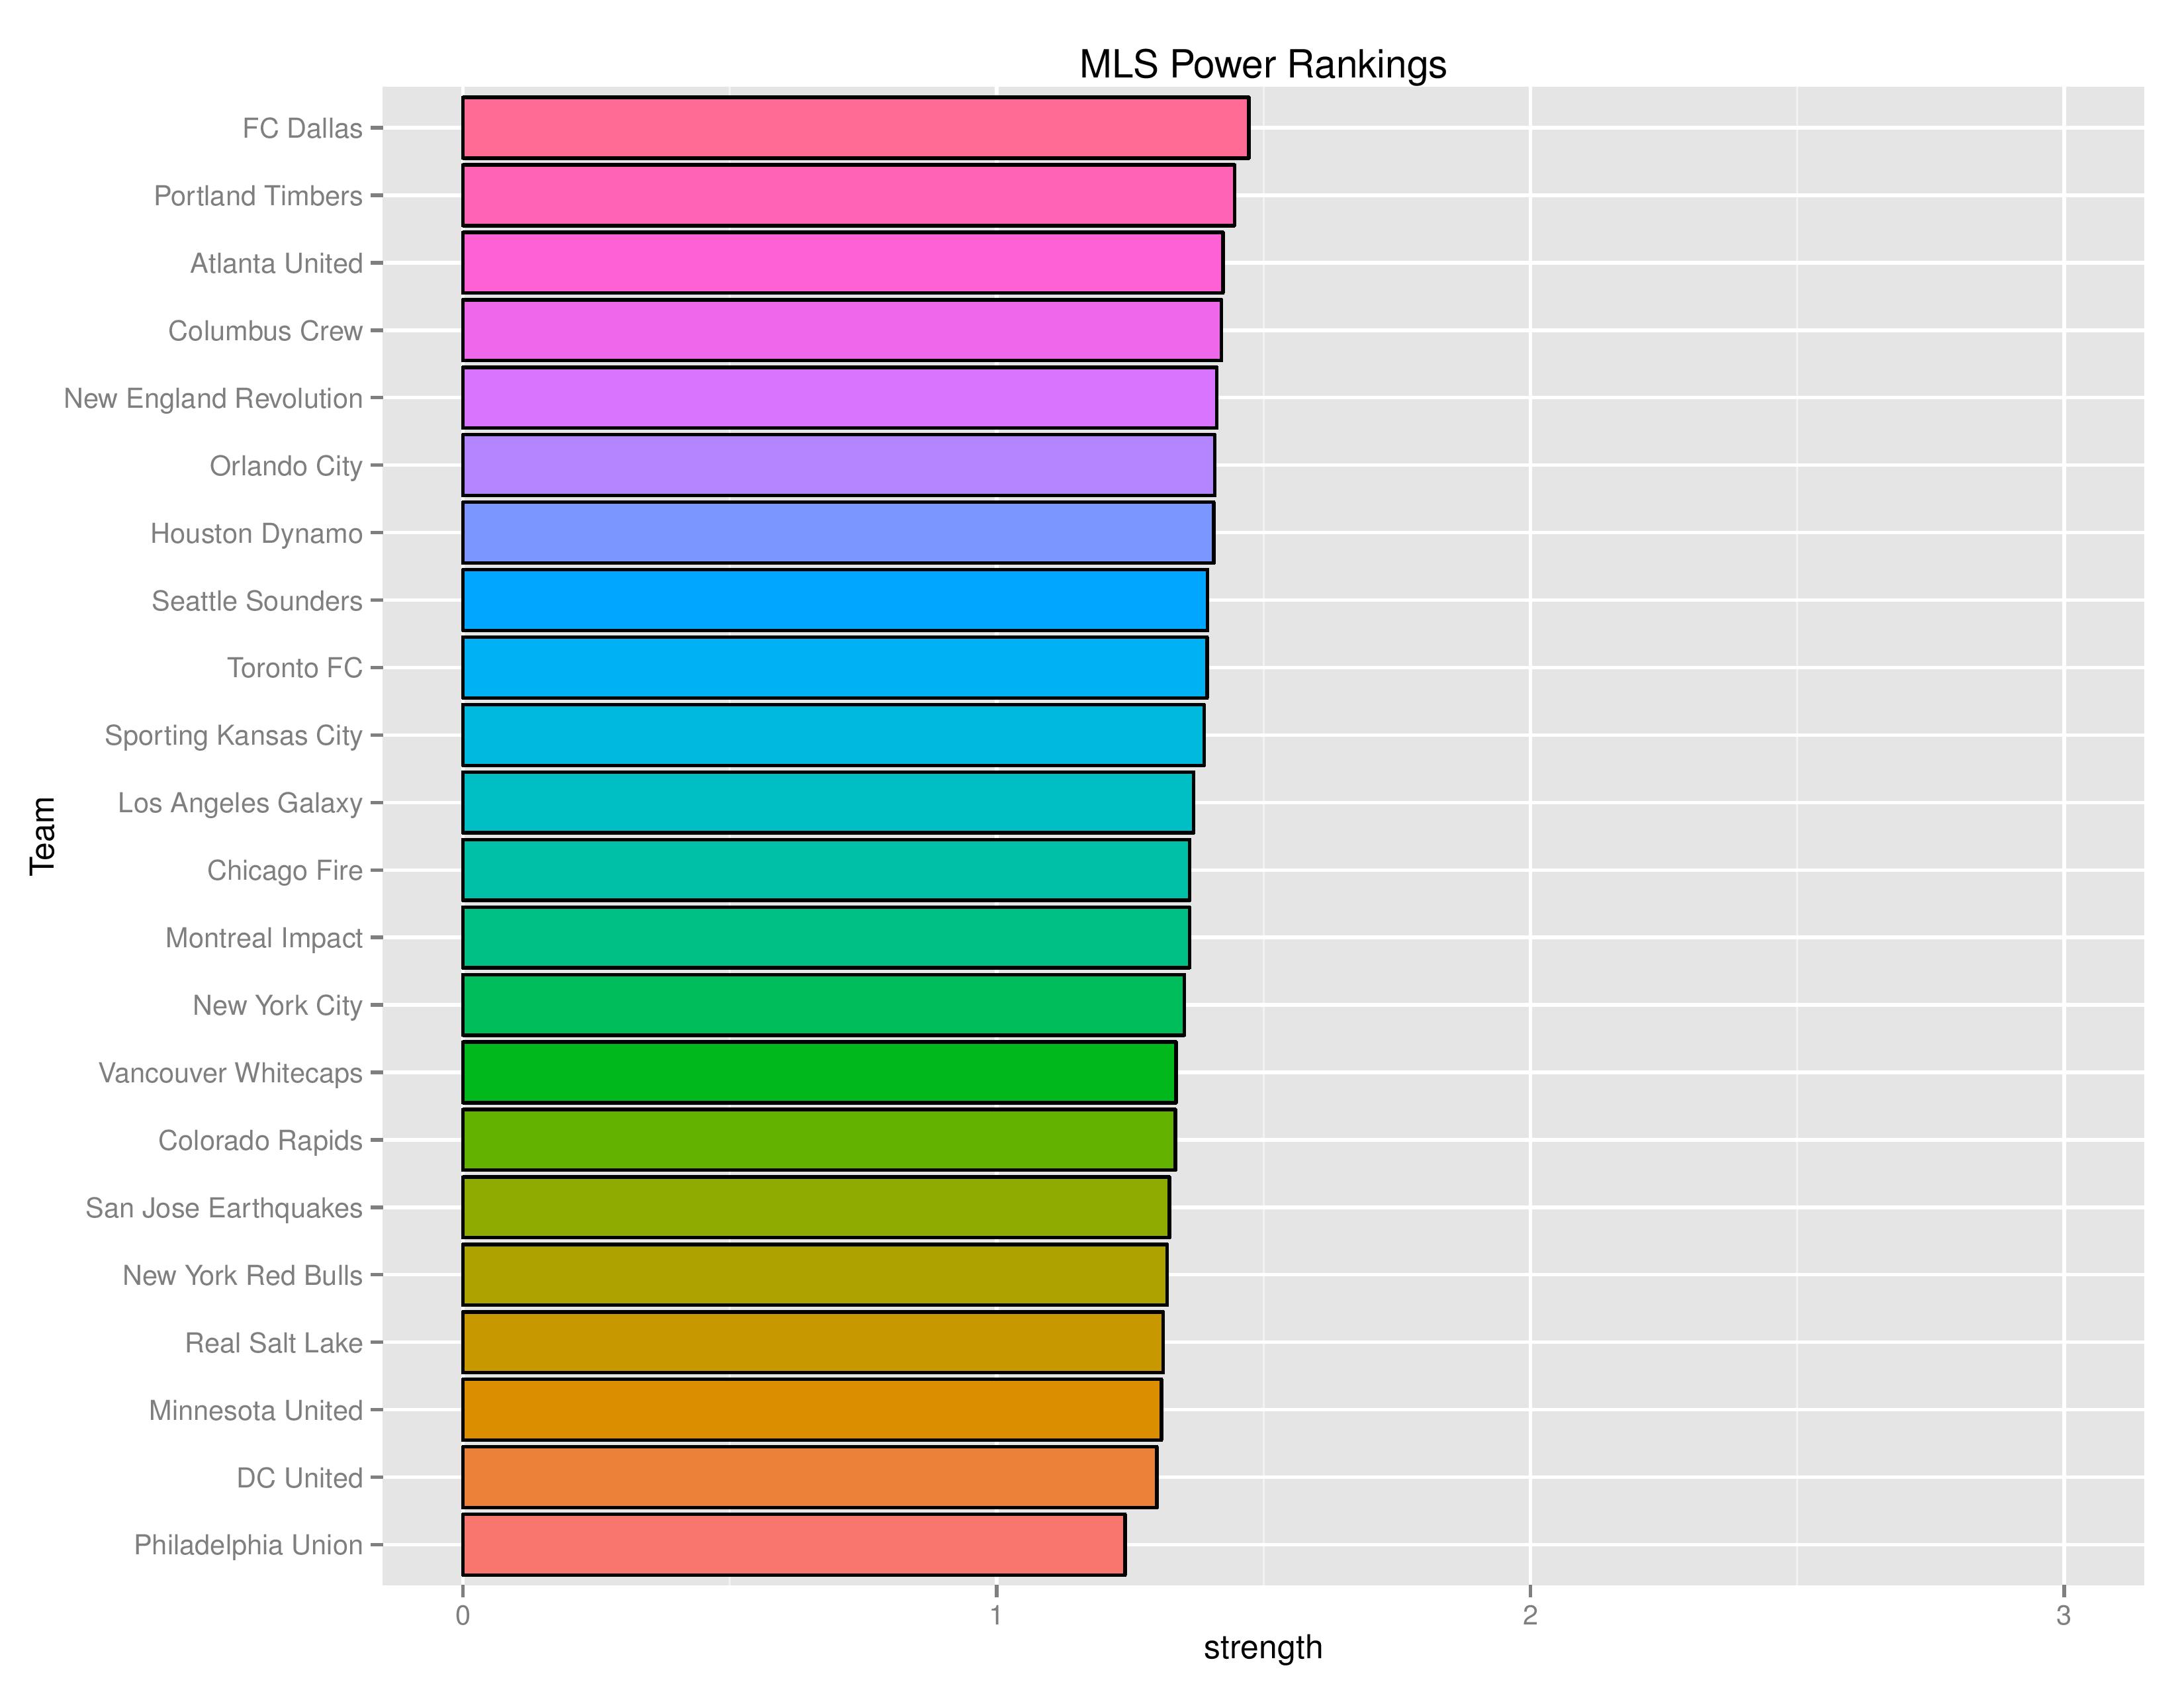
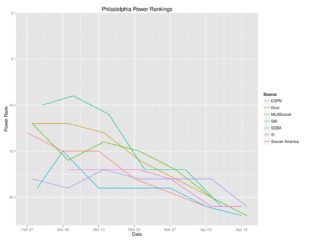
Power Rankings
The “Power Rankings” we concoct are the “strength” of the team according to its competitive expectations. They are computed by forecasting the expected points (3 x win-probability + 1 x draw-probability) against every MLS team, both home and away, and taking the average per team.
SEBA has the Union drop from 21st to 22nd. ESPN has Philadelphia ranked 22nd, down from 21st. MLSSoccer.com has the Union down to 22nd from 20th. Soccer America has the Union down to 22nd from 21st. And SI has Philadelphia down to 21st from 19th.
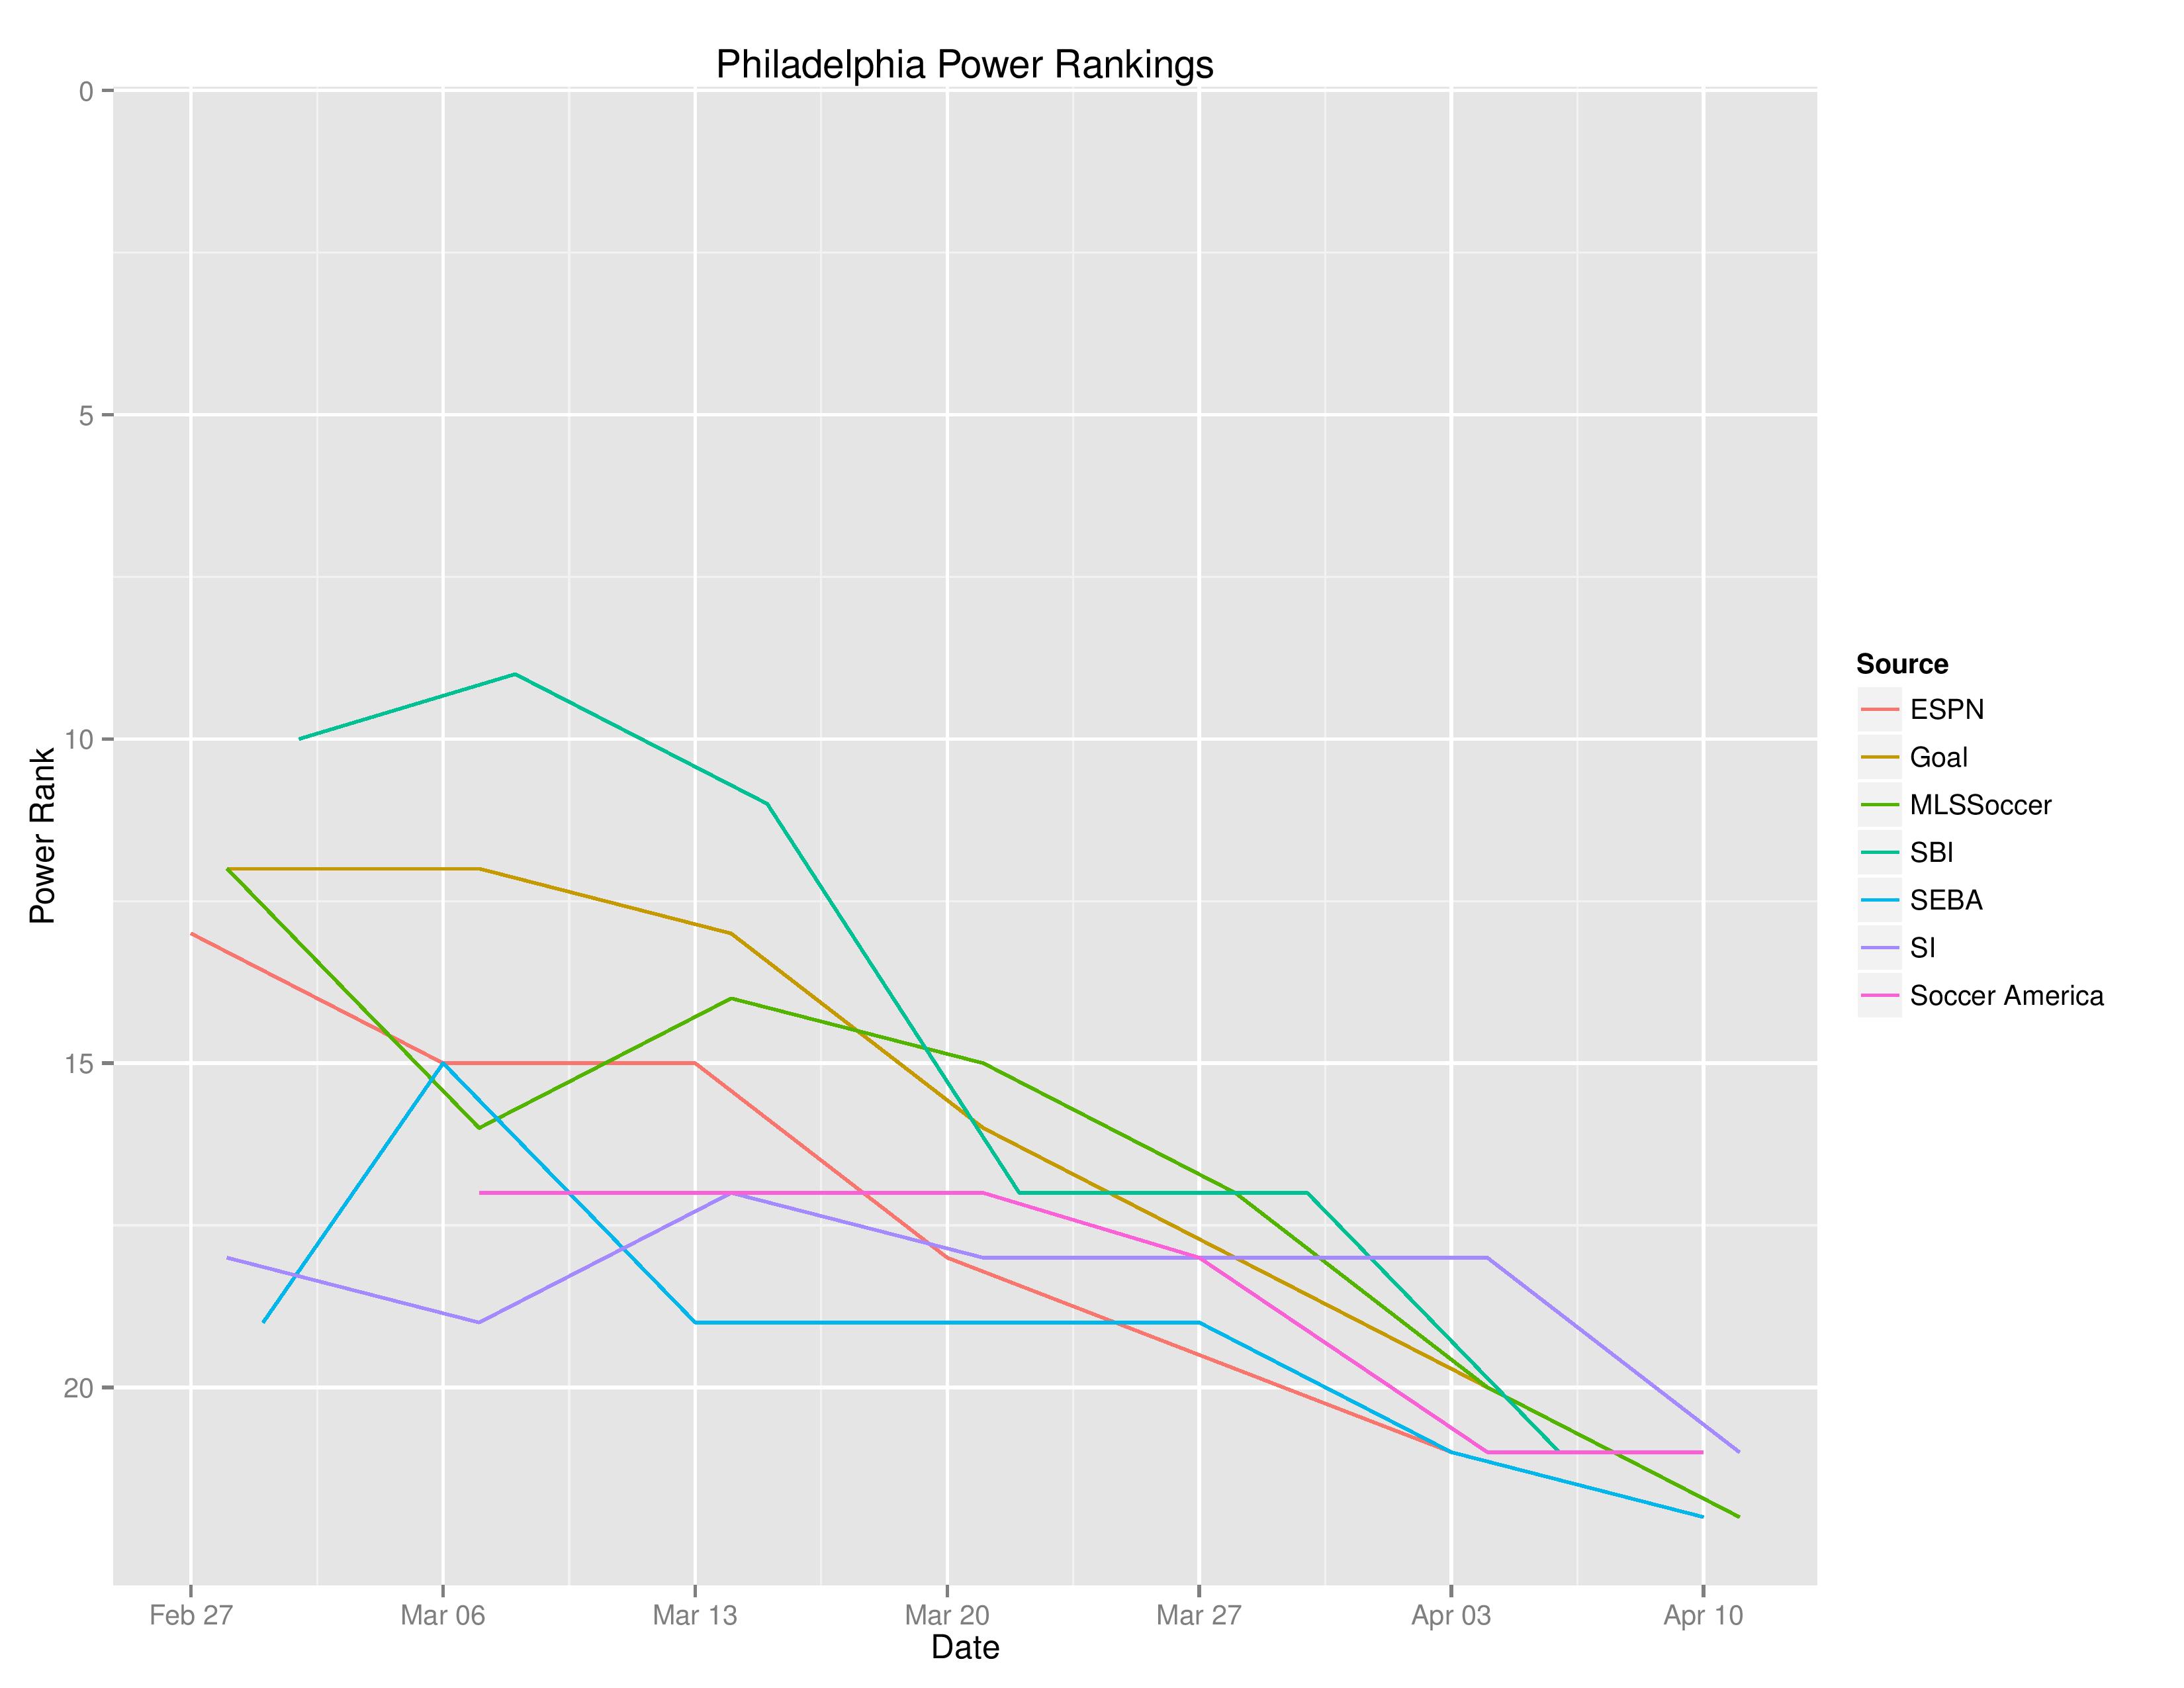
The following shows the evolution of SEBA’s power rankings for the MLS East over time.

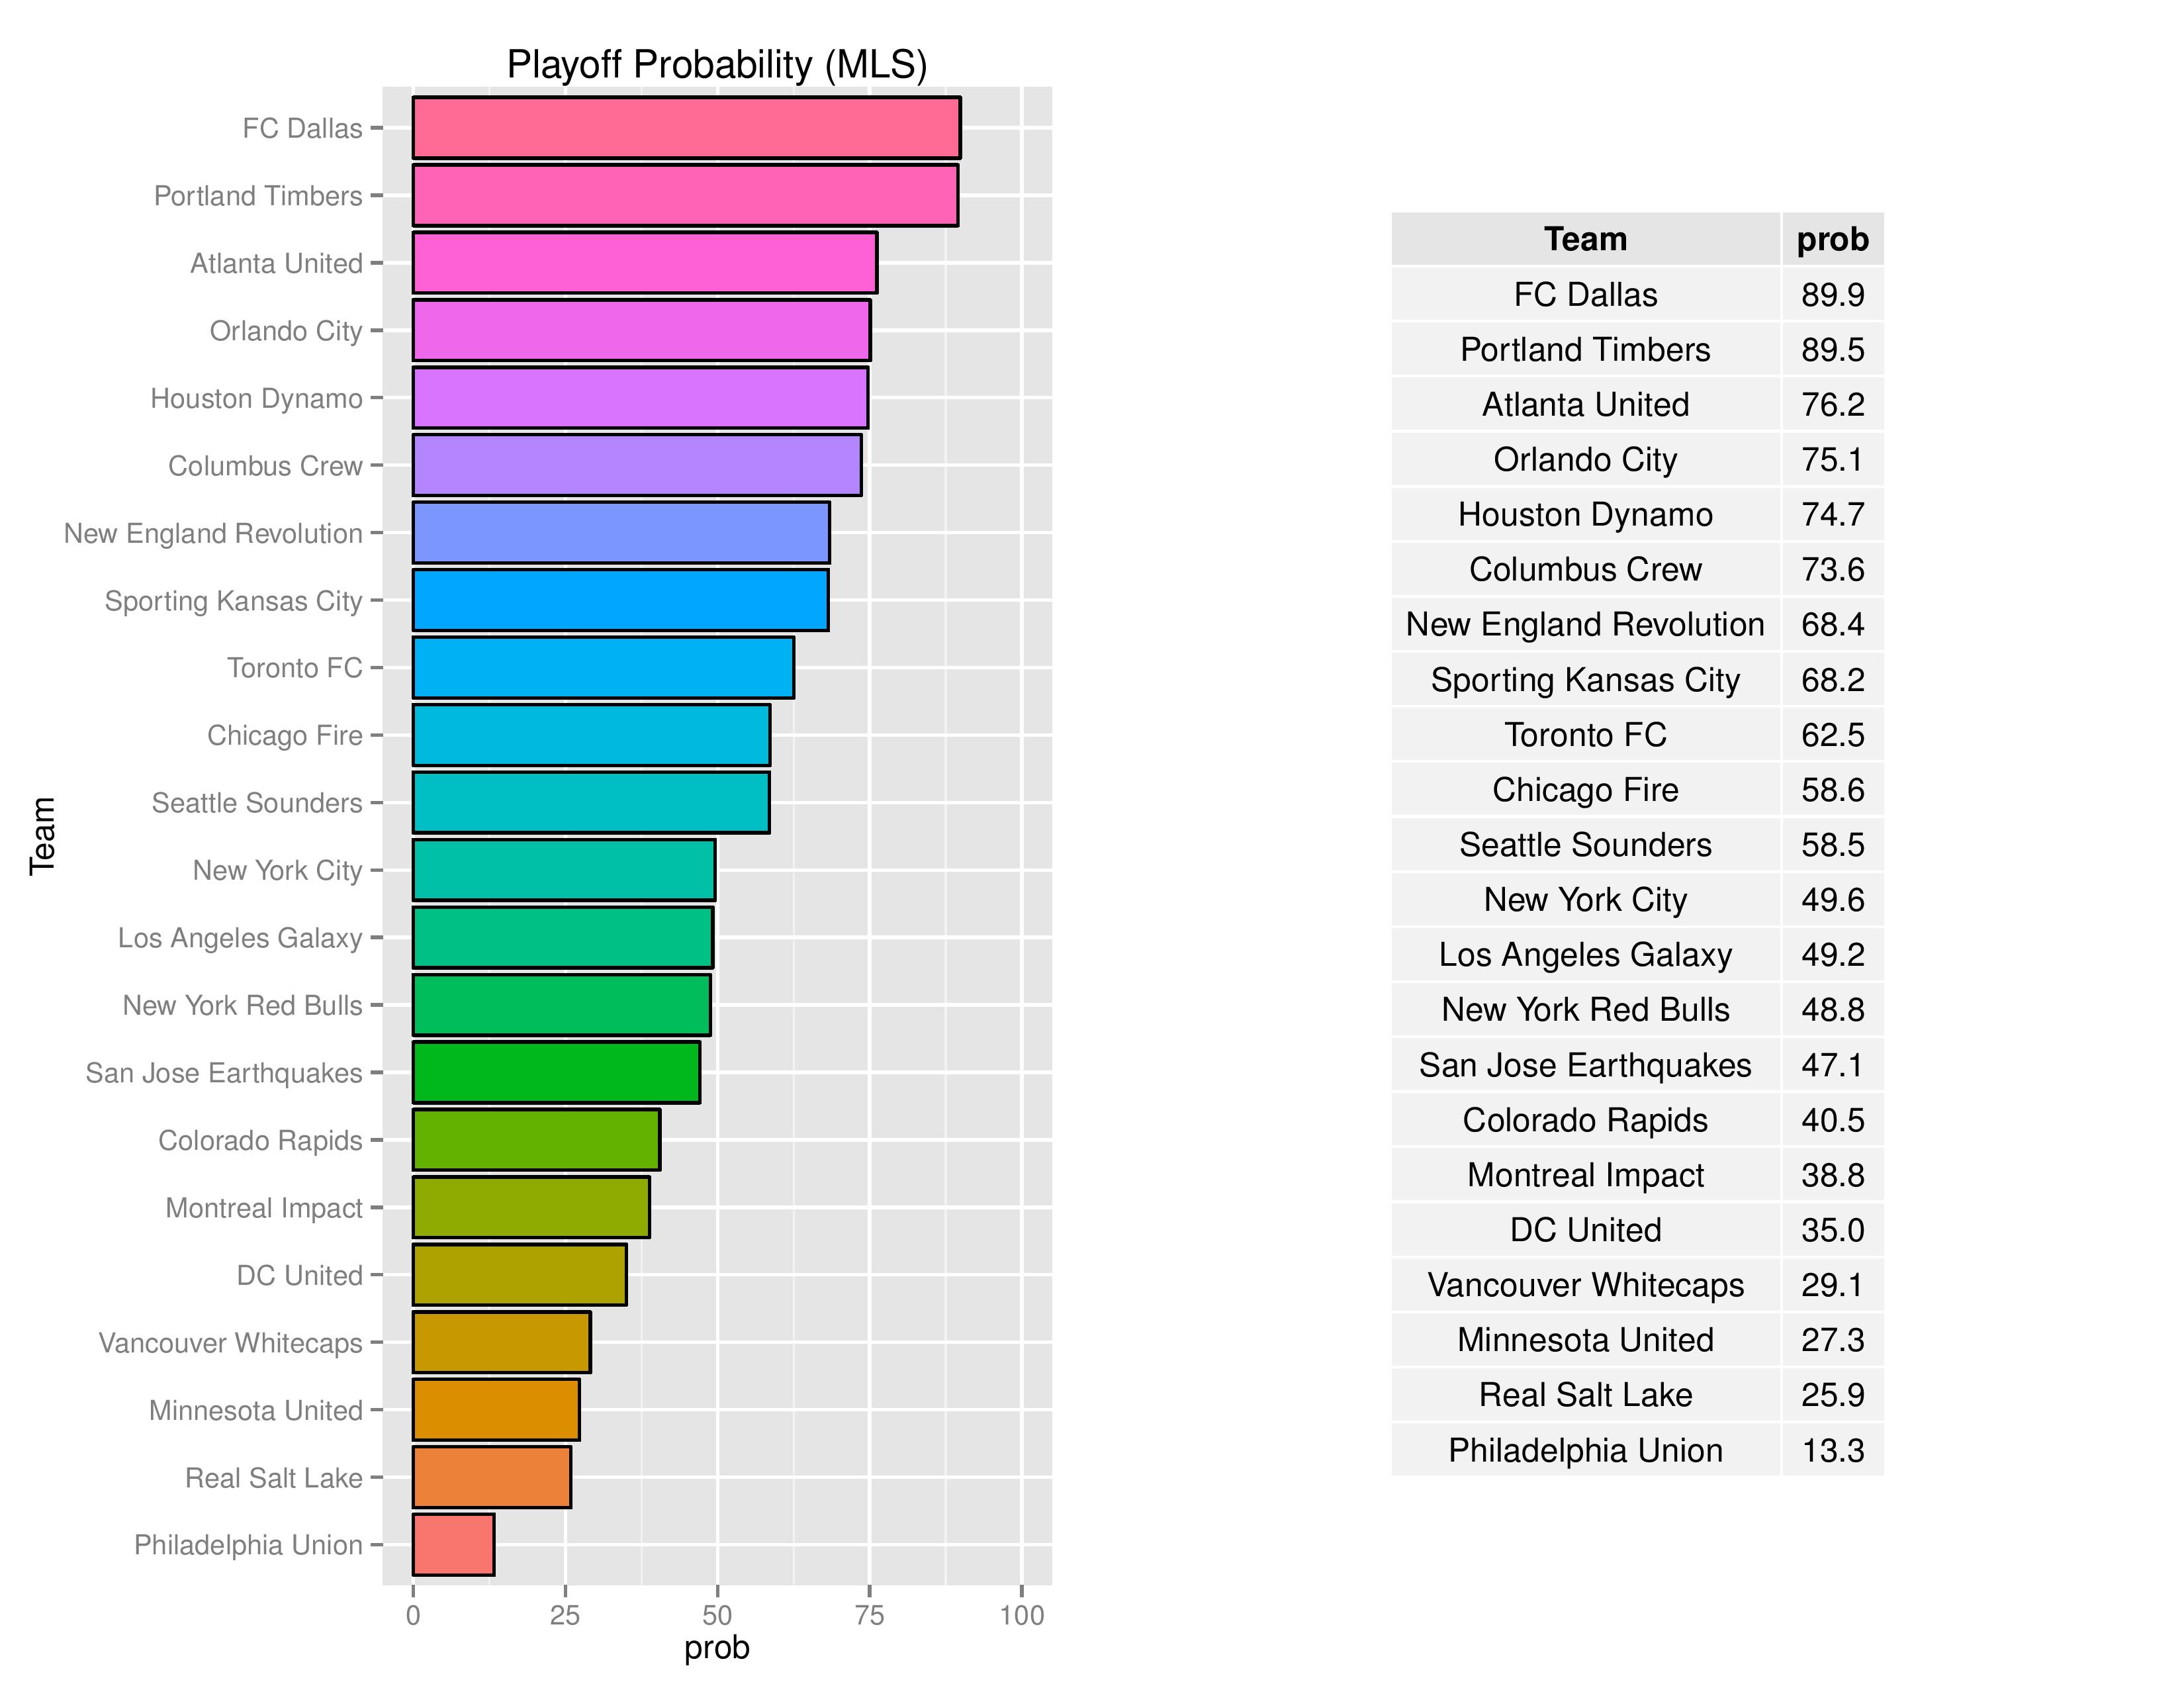
Playoffs probability and more
I’ve enabled the model to make bolder decisions as I have a decent sample of 2017 data, so there should be a few larger jumps in this week’s forecast.
Philadelphia’s playoffs odds have declined from 30.5% to 13.3%.
Philadelphia’s odds to win the Supporters’ Shield have declined from 0.9% to 0.2%.
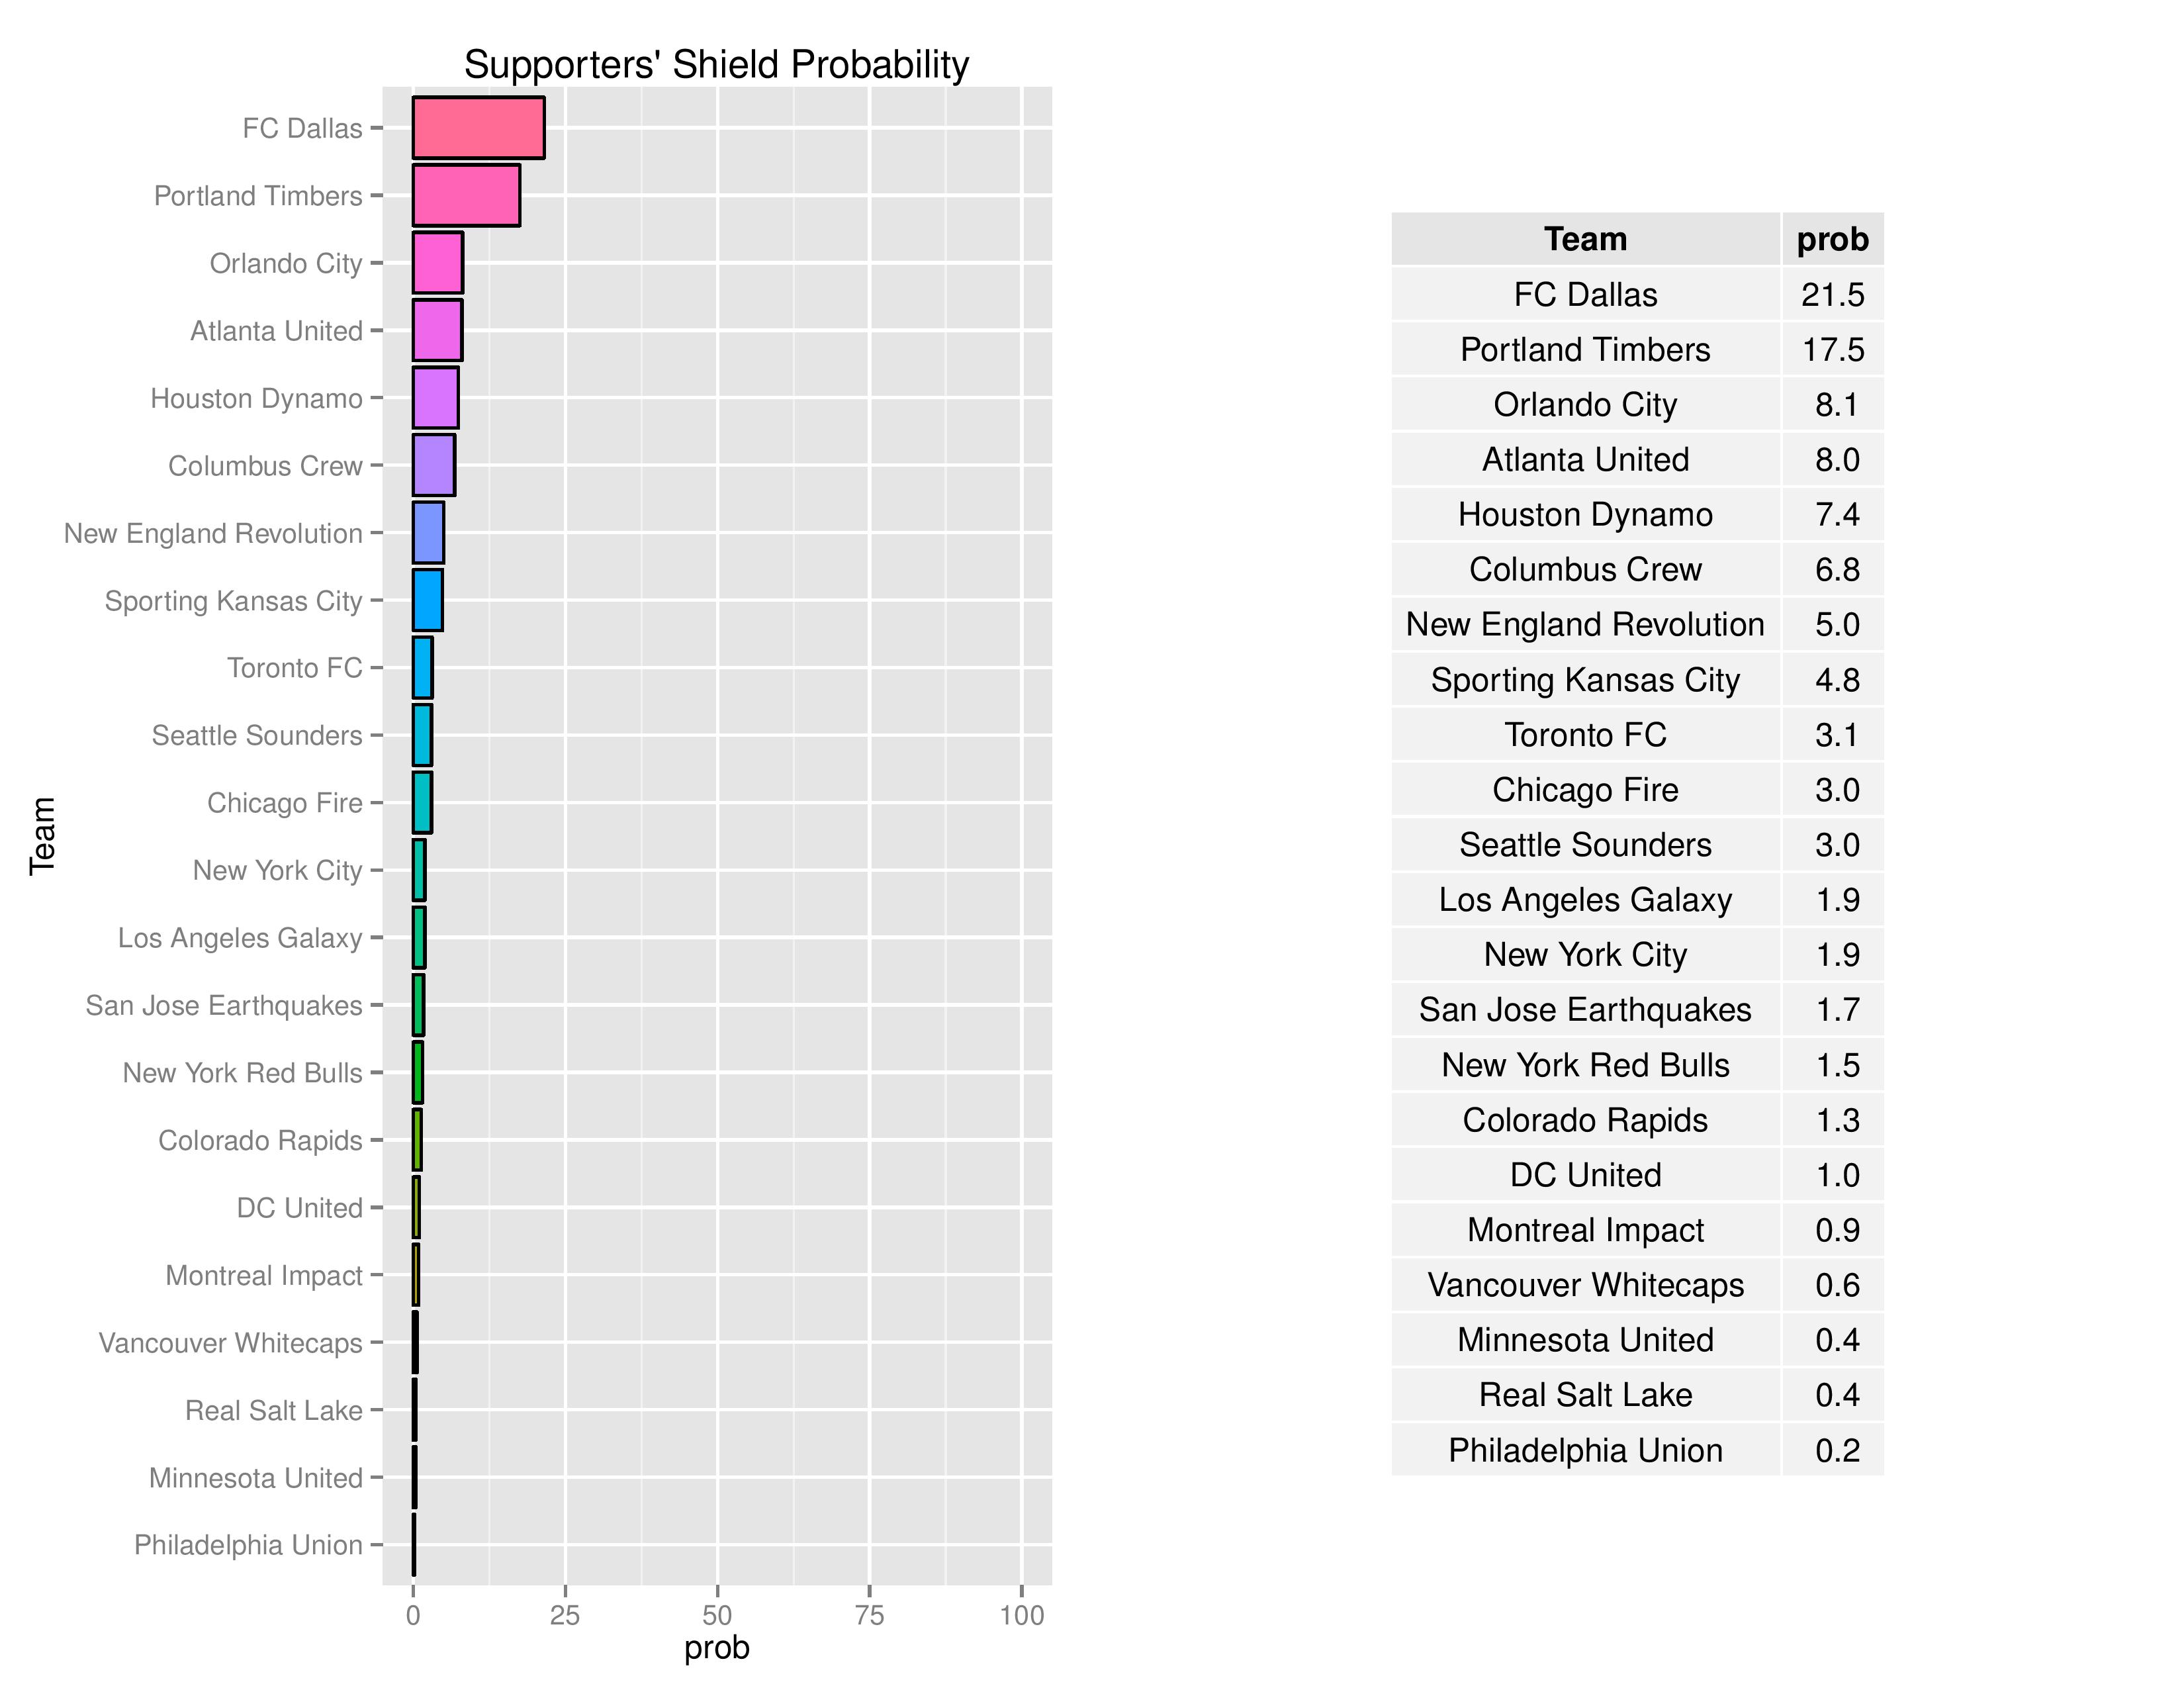
In part, clubs that score a lot of goals are given an advantage in MLS Cup due to the 2-leg aggregate goal format of the conference semi-finals and conference finals. This gives those clubs a better chance at banking large victories which carry over.
The Union’s chances of winning the MLS Cup have decreased from 1.6% to 0.4%.

Philadelphia’s odds of winning the U.S. Open Cup have declined from 3.2% to 2.4%.

**I ran this week’s simulation system before I read about the changing CCL’s structure and thus the USA’s and Canada’s changing qualification for the CCL tournament. Seeing as it takes 5-6 hours to re-run the simulation (in addition to re-coding the logic), the following non-italicized text won’t represent the actual truth.
The new USA qualification slots will now be: 2017 MLS Cup Winner, 2018 MLS Cup Winner, 2017 USOC Winner, and 2018 USOC Winner. If a Canadian team wins either MLS Cup or a single USA team wins multiple slots, then presumably the remaining slots will go to the top, not-yet-qualified 2018 MLS regular season finishers.
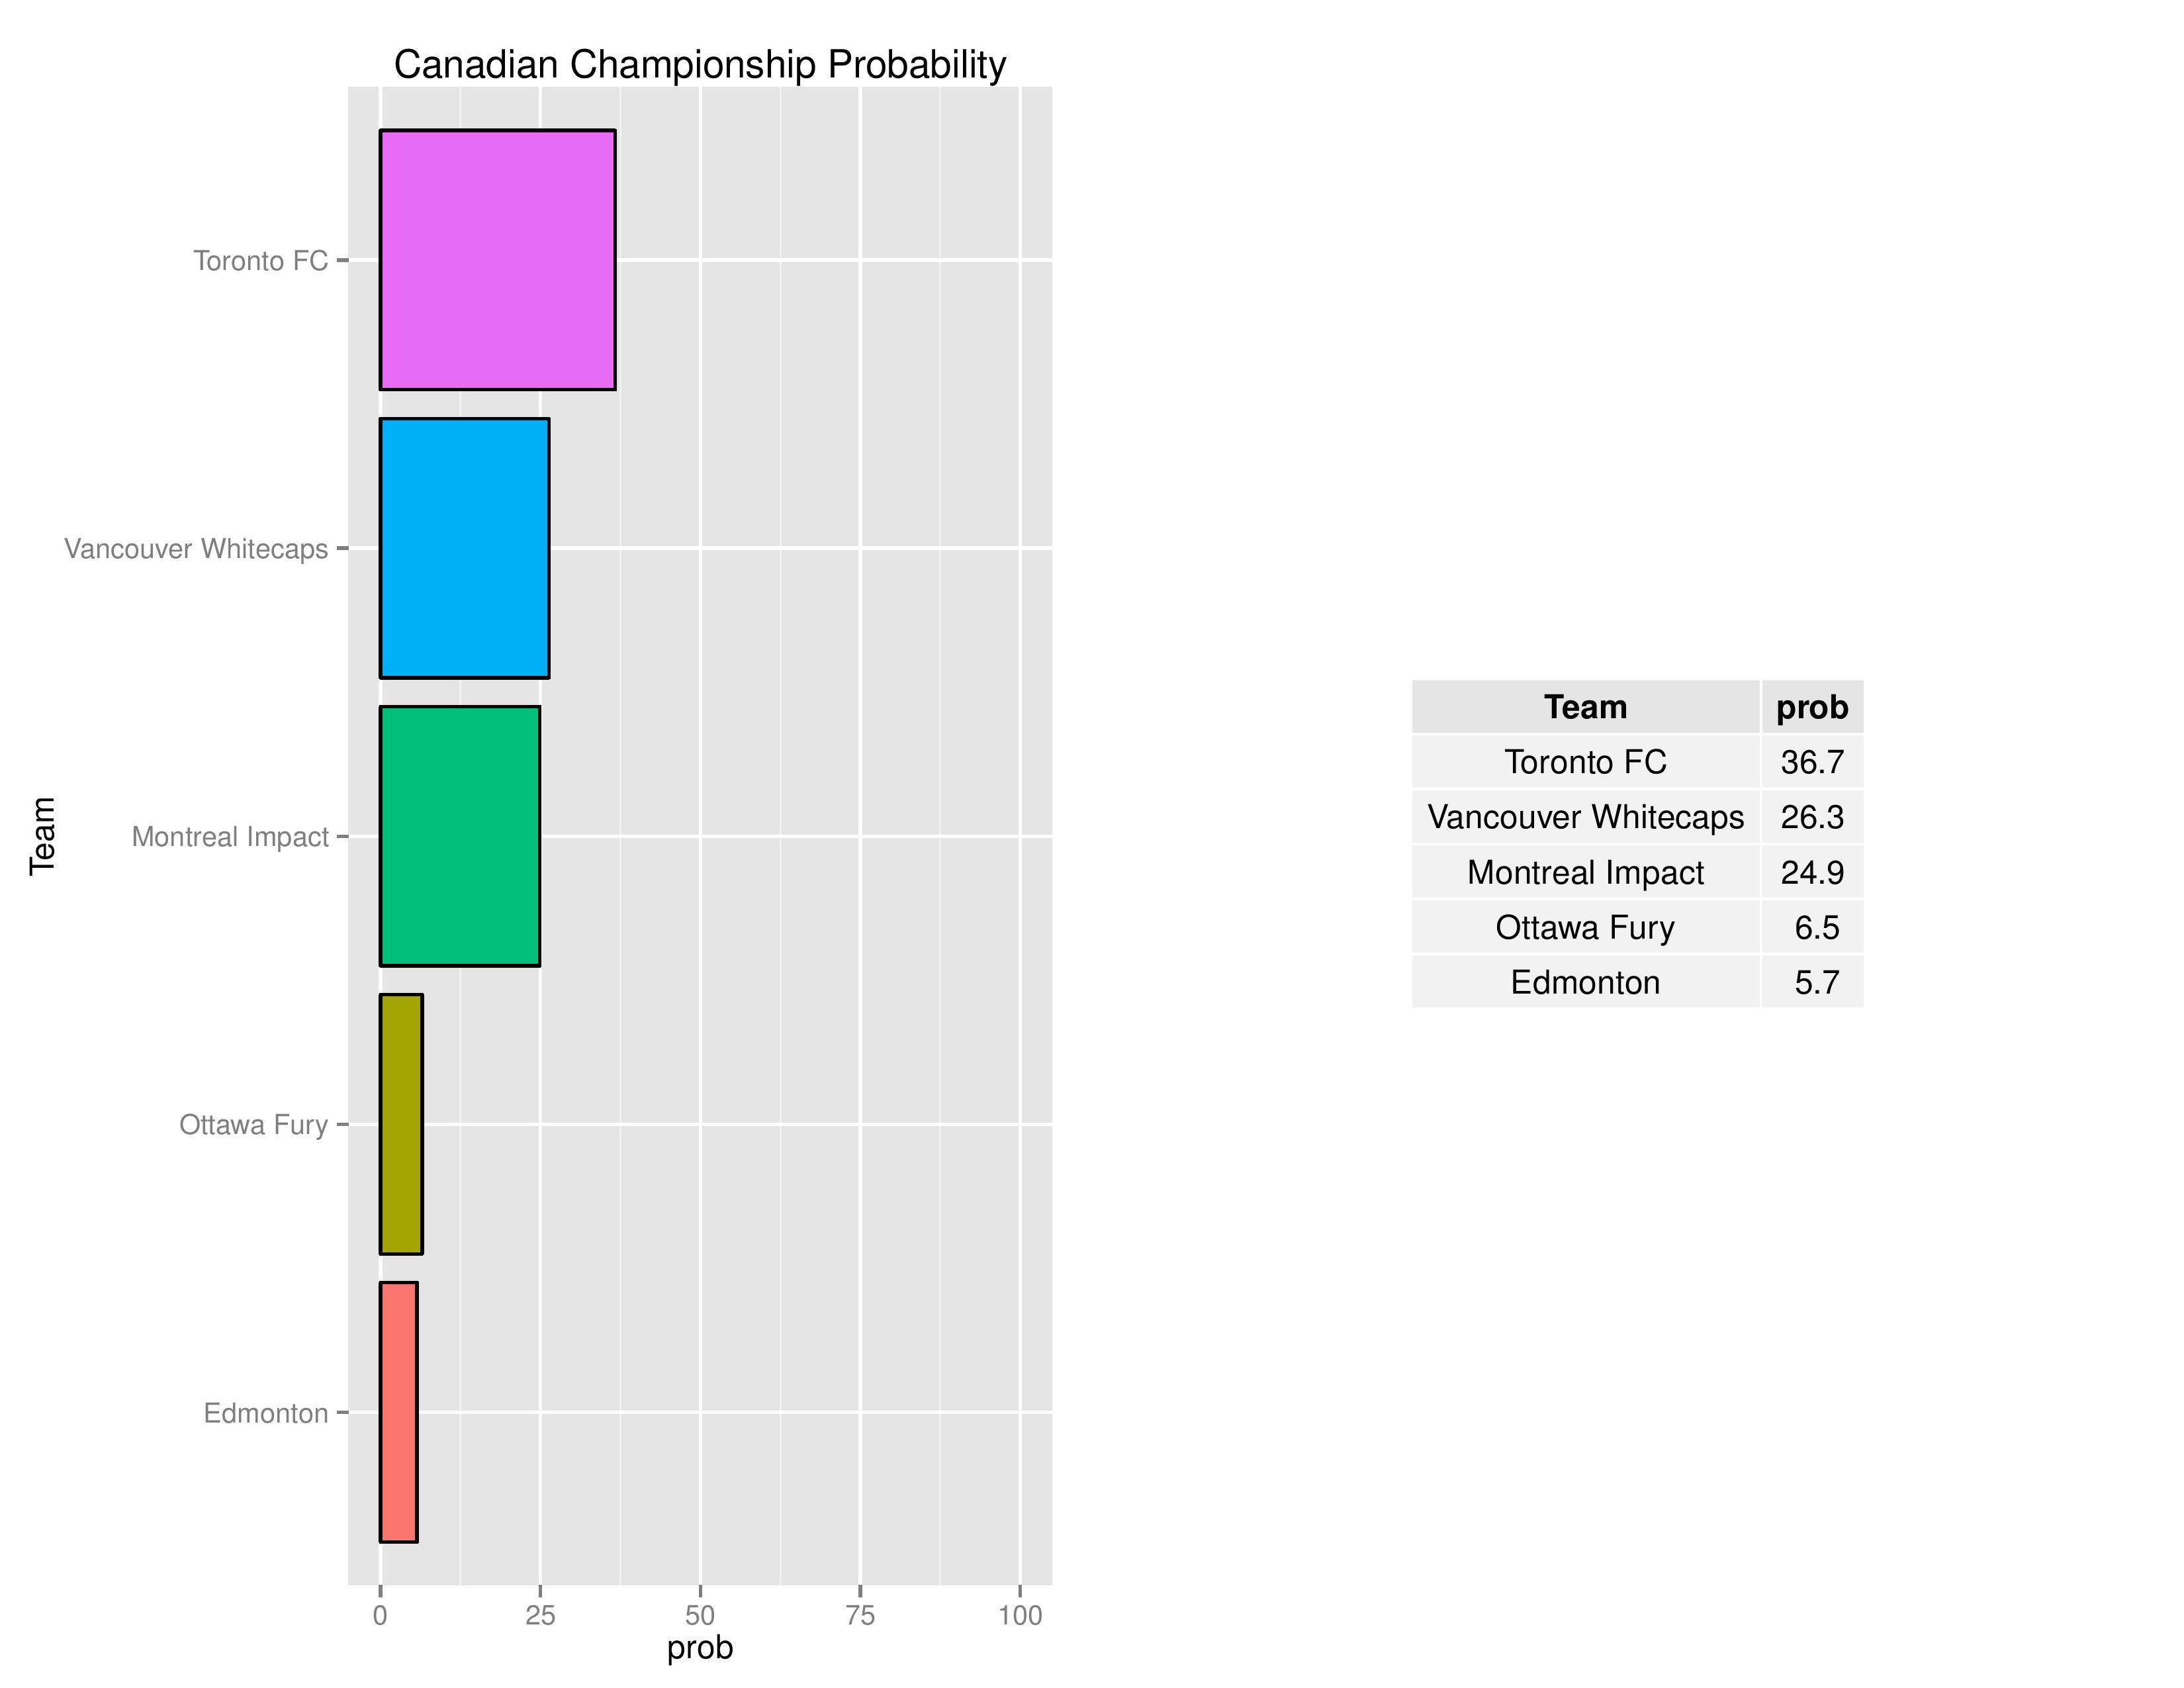
The new Canadian qualification slot will go to the winner of Toronto (at home, as the 2016 Canadian Championship Winner) vs. 2017 Canadian Championship Winner (assuming it isn’t Toronto).
The slots which no longer automatically qualify (until the 2020 CCL tournament for USA, 2019 for Canada) are the regular season conference winners (for USA teams) for 2017/2018 and the 2016/2017 Canadian Championship Winners.
I’ll try and fix this for next week. Correct me in the comments if I missed something.
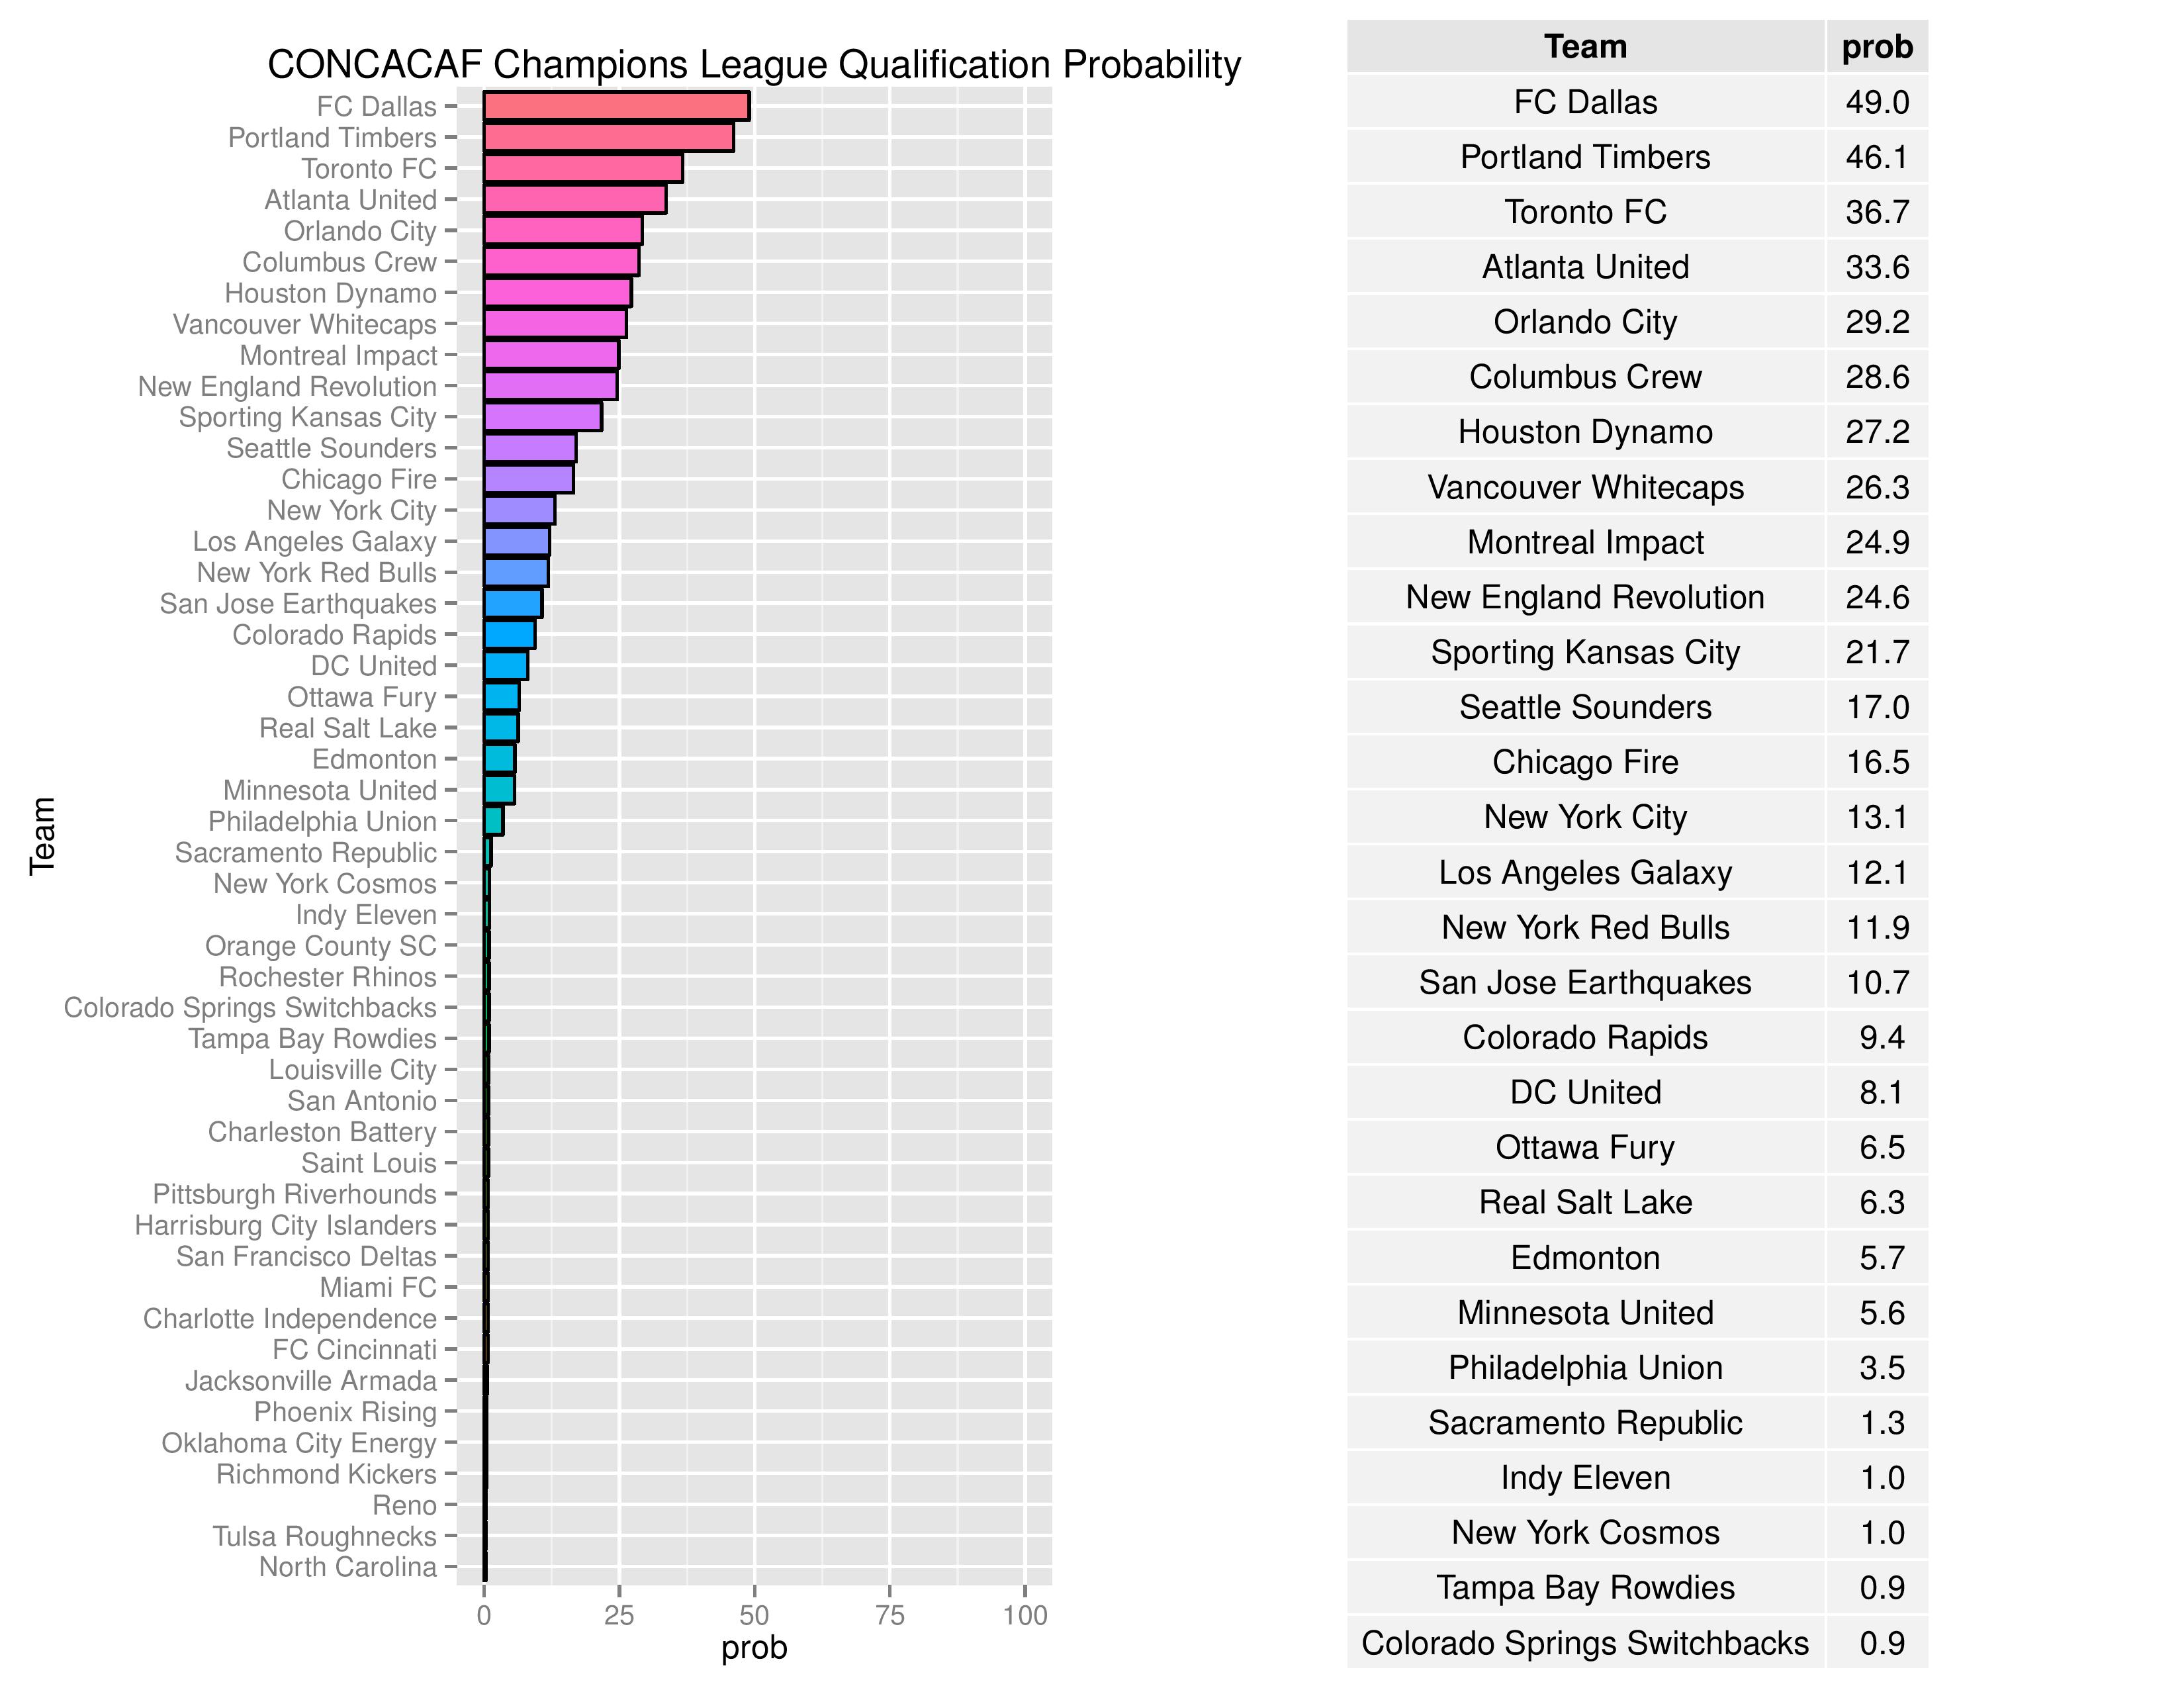
Philadelphia’s chances for qualifying for the 2018-2019 edition of the CONCACAF Champions League have dropped from 8.2% to 3.5%.
Over time, we can see how Philadelphia’s odds for different prizes have changed.

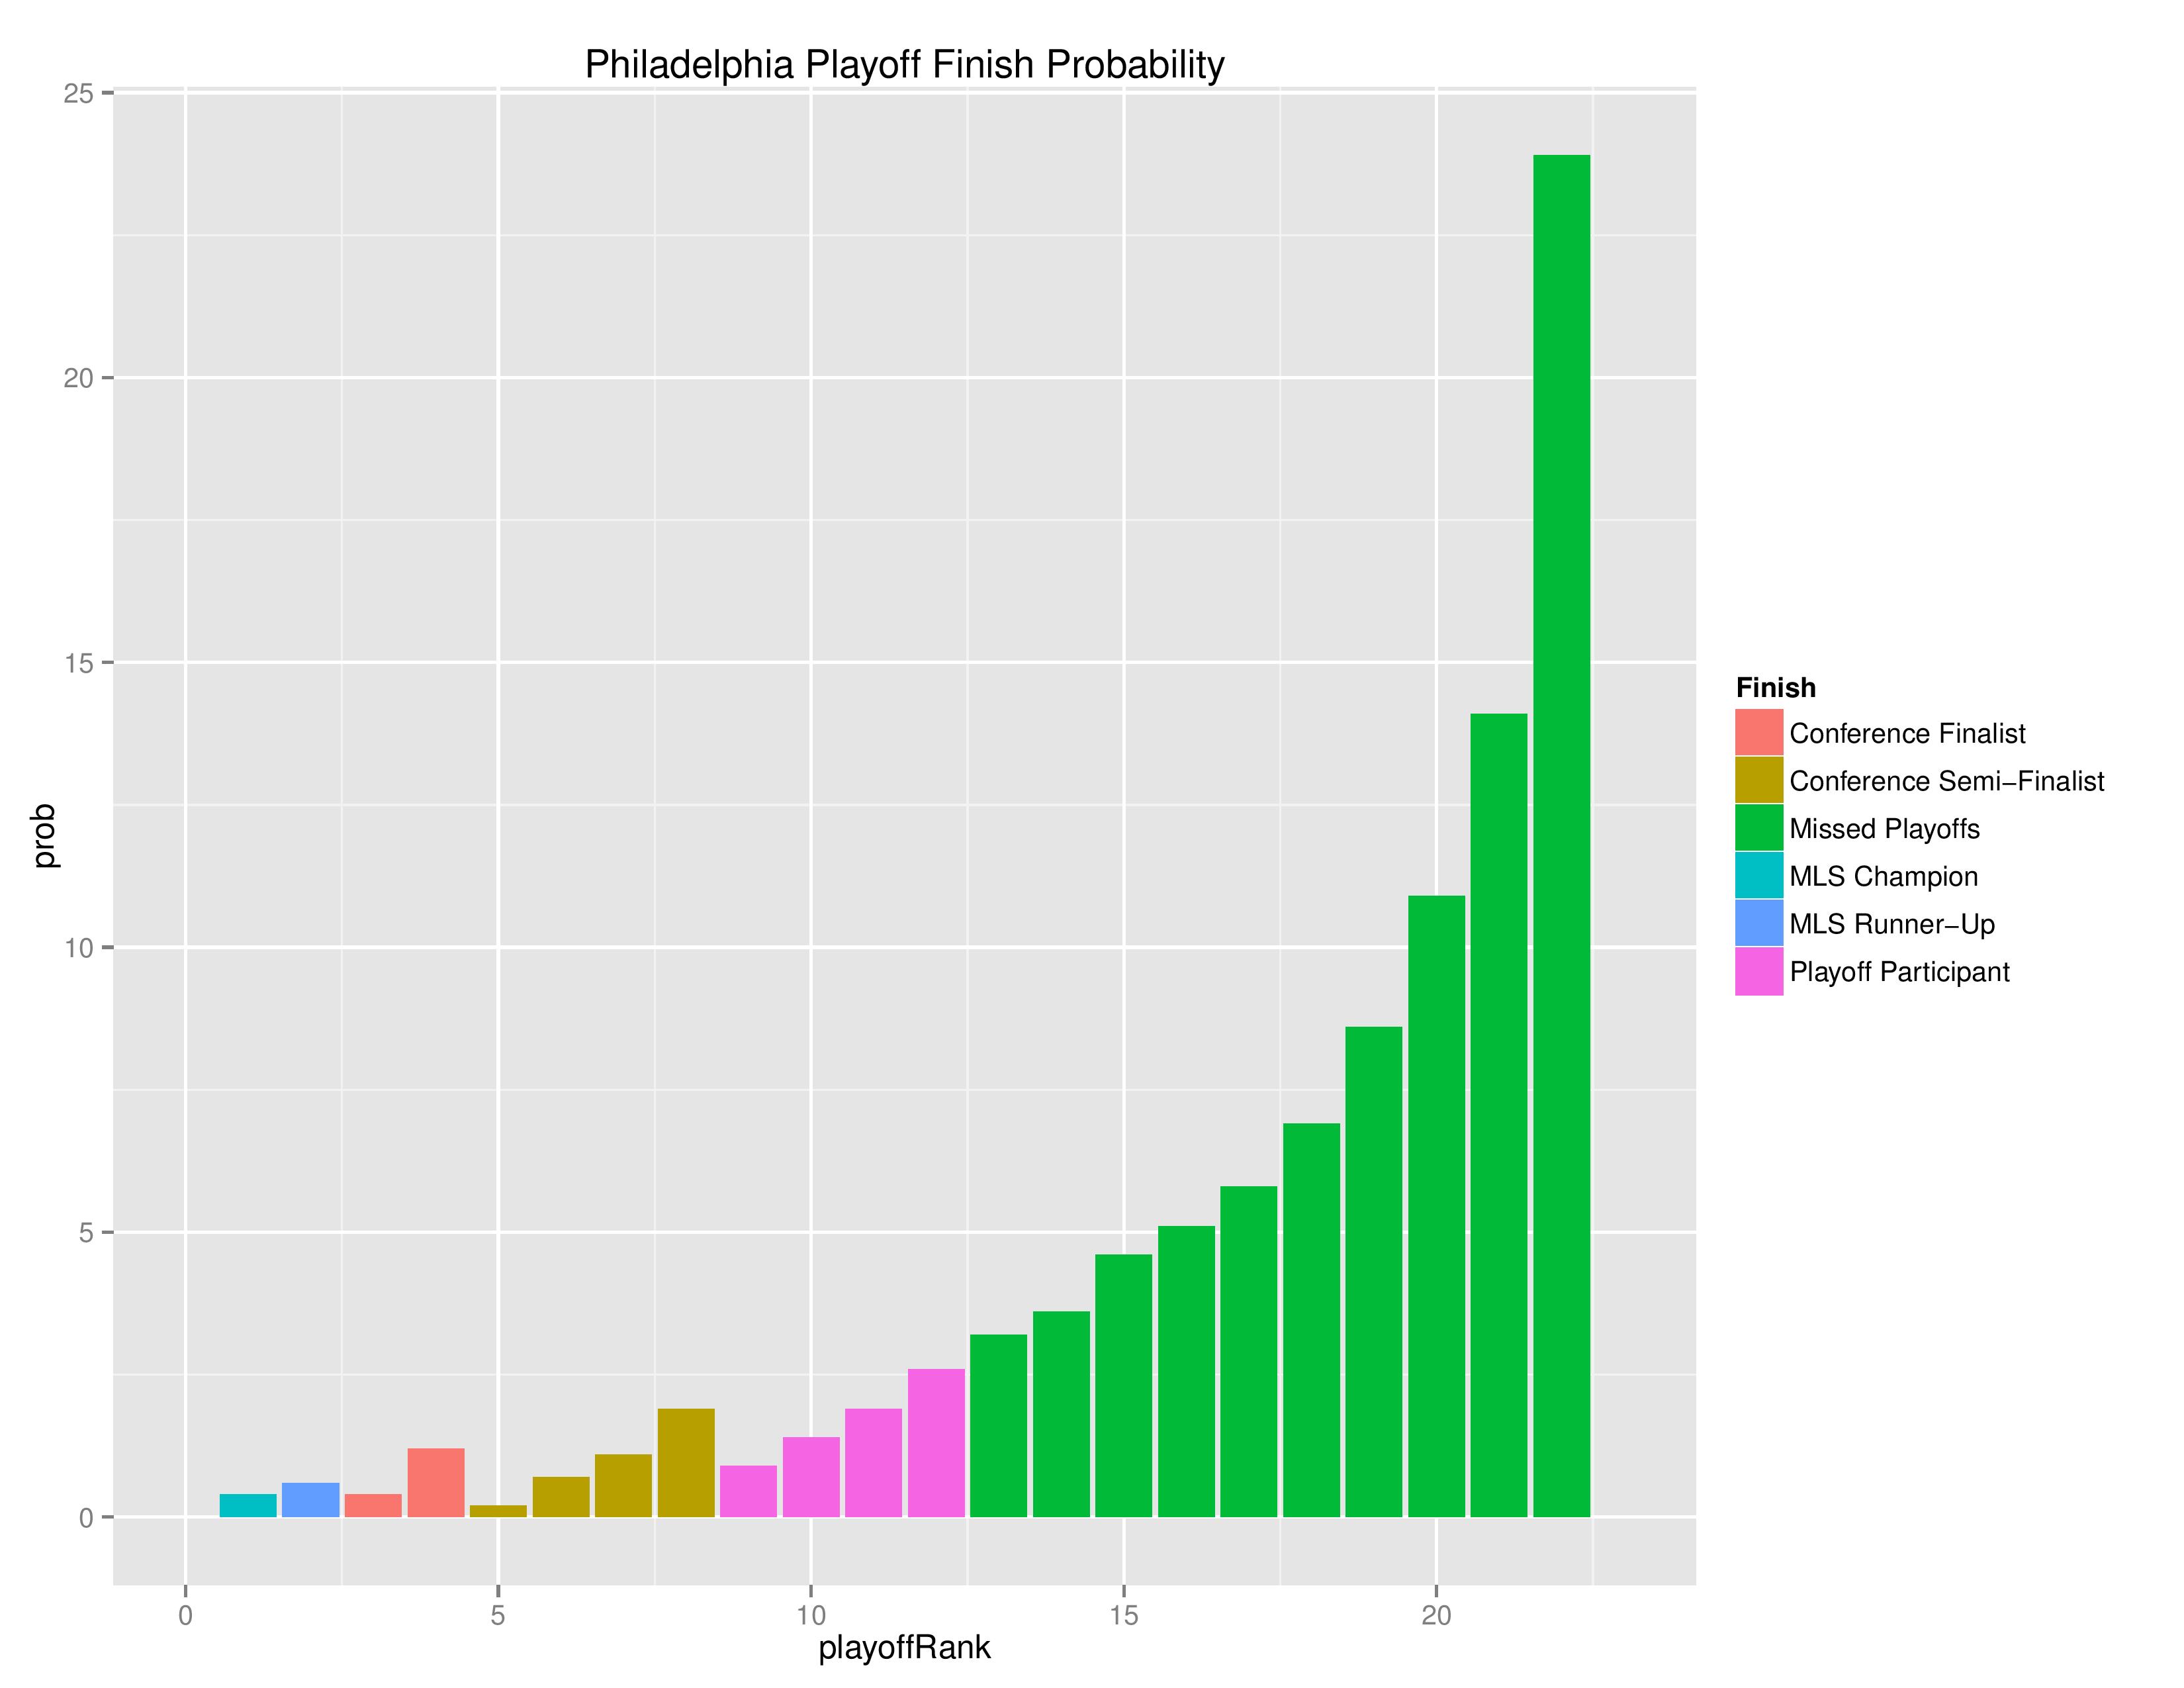
The following are probabilities for each category of outcomes for Philadelphia:

The following shows the relative probability of the prior categories. If the projection system were entirely random, these bars would be even, despite that “Missed Playoffs” is inherently 10 times more likely than “MLS Cup Champion.” The chart outlines where the club is headed:

The following shows the probability of each post-playoff ranking finish:
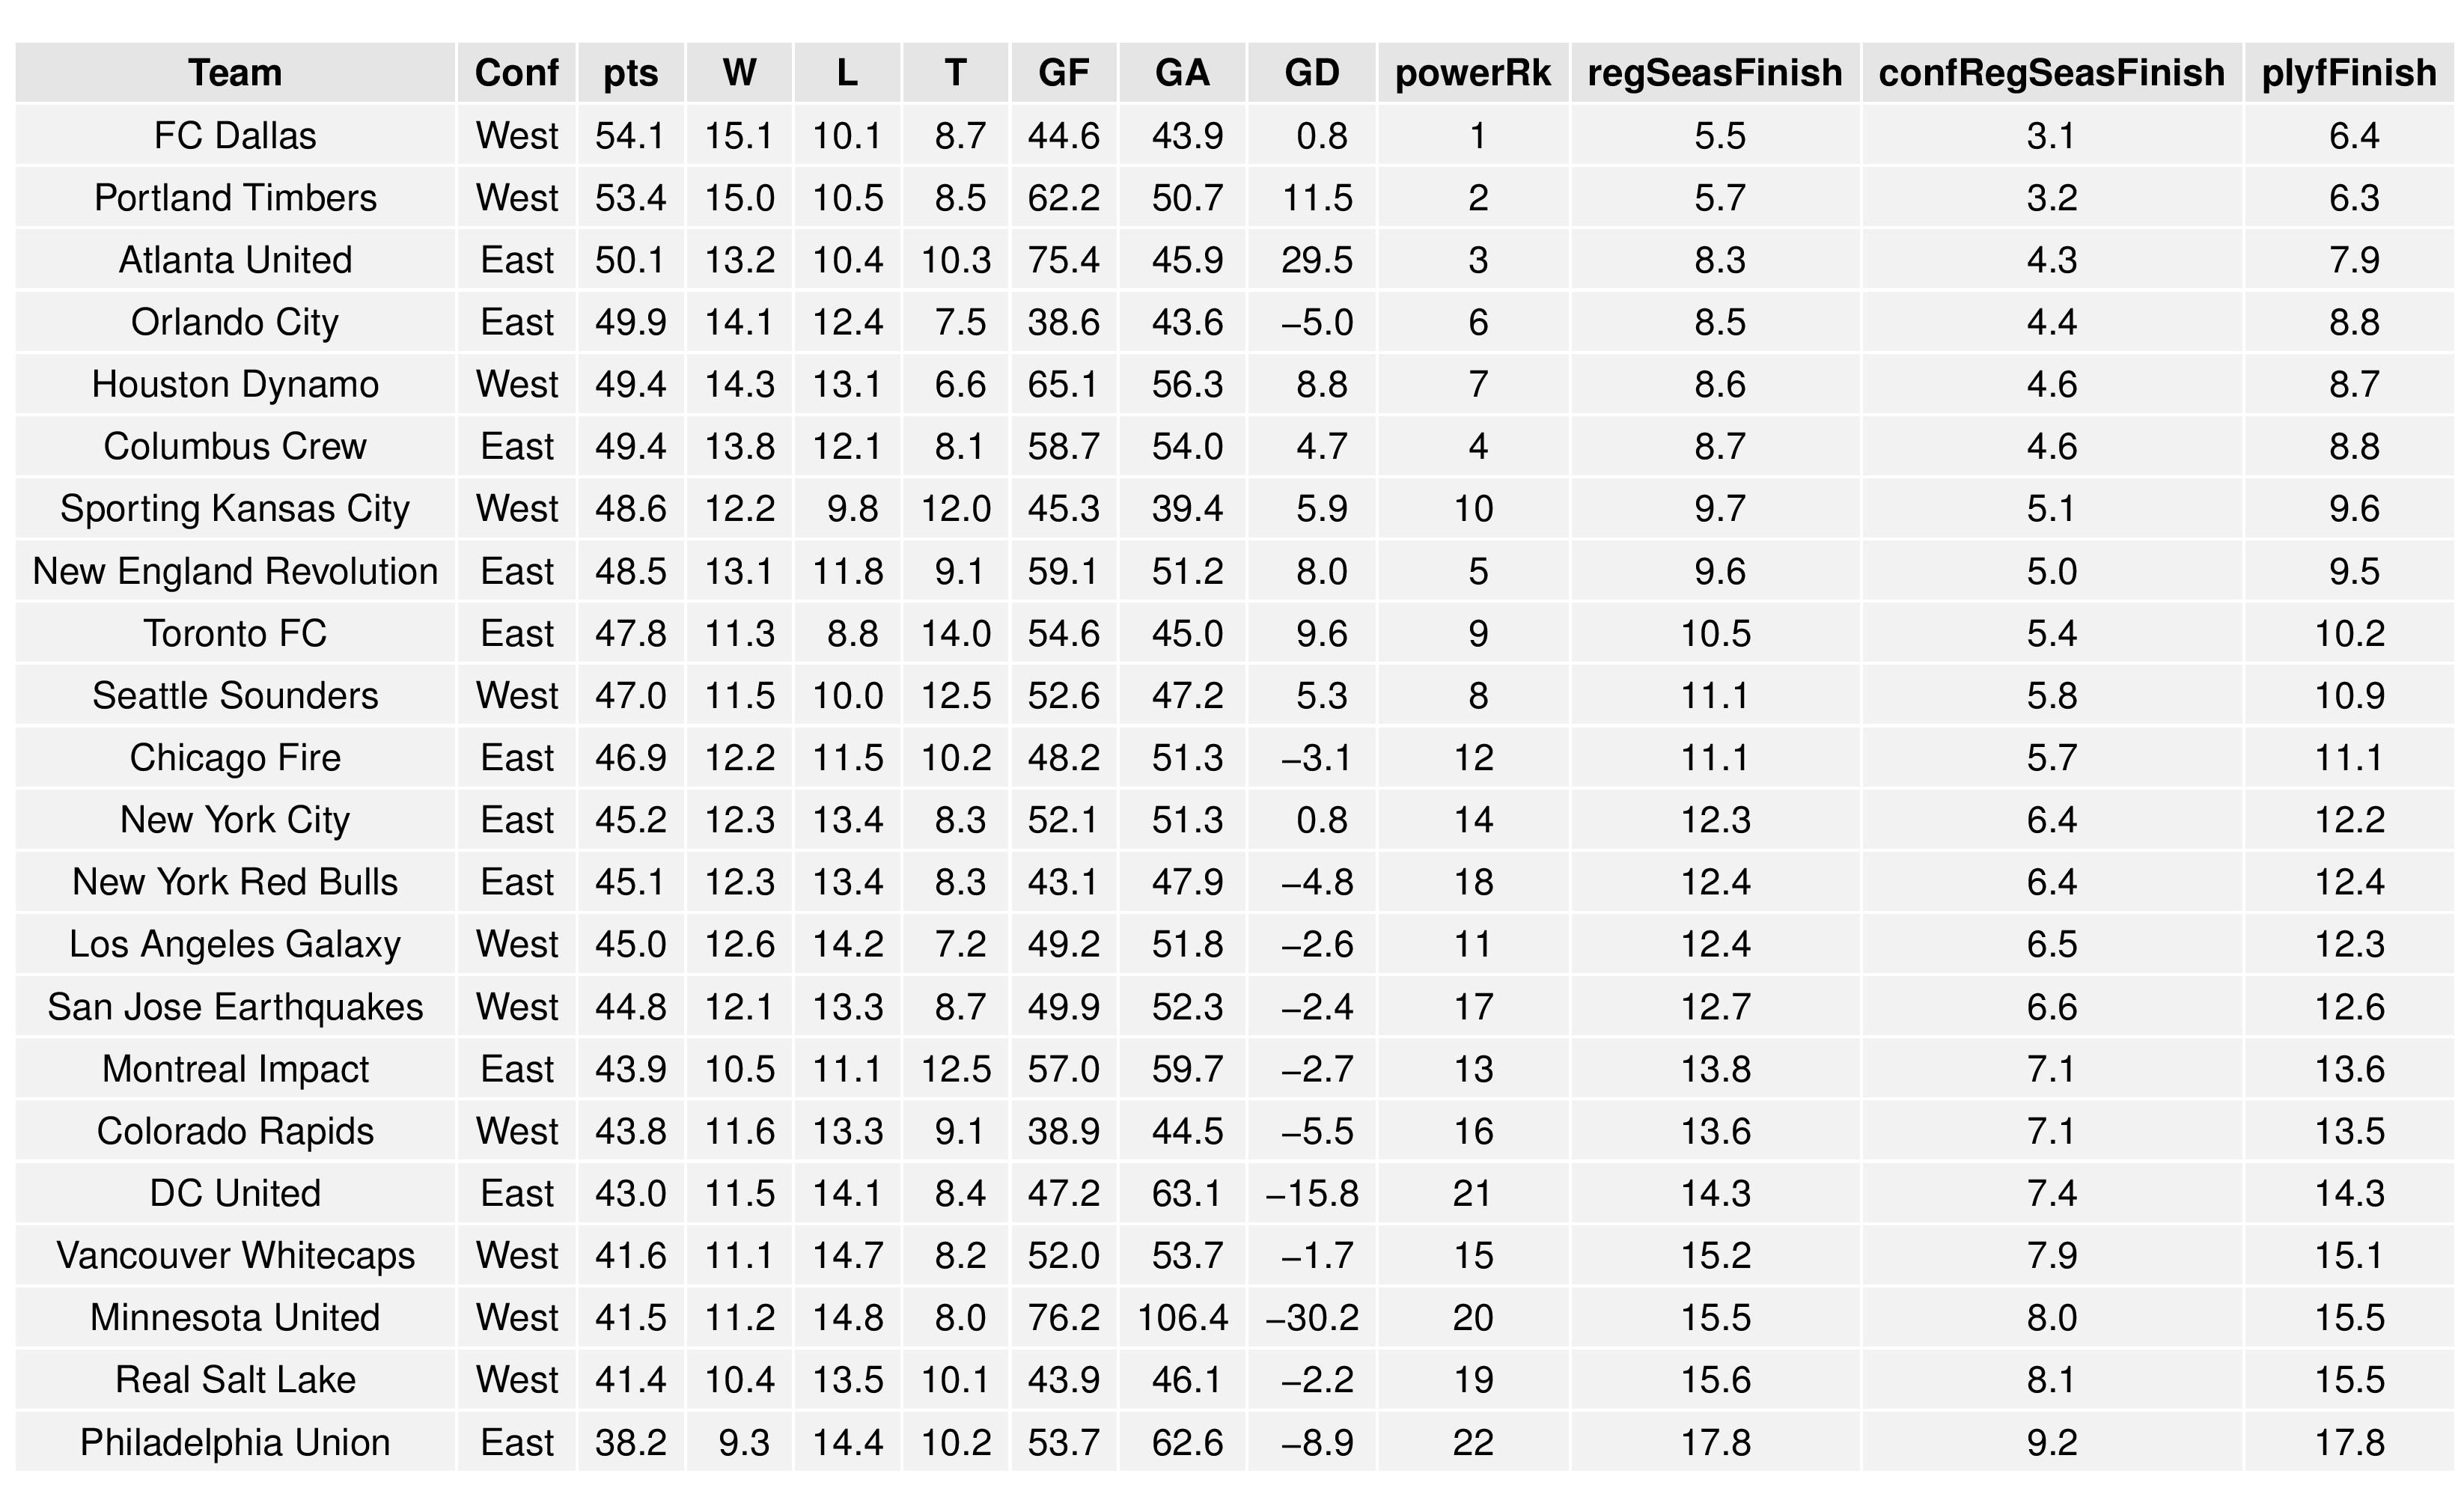
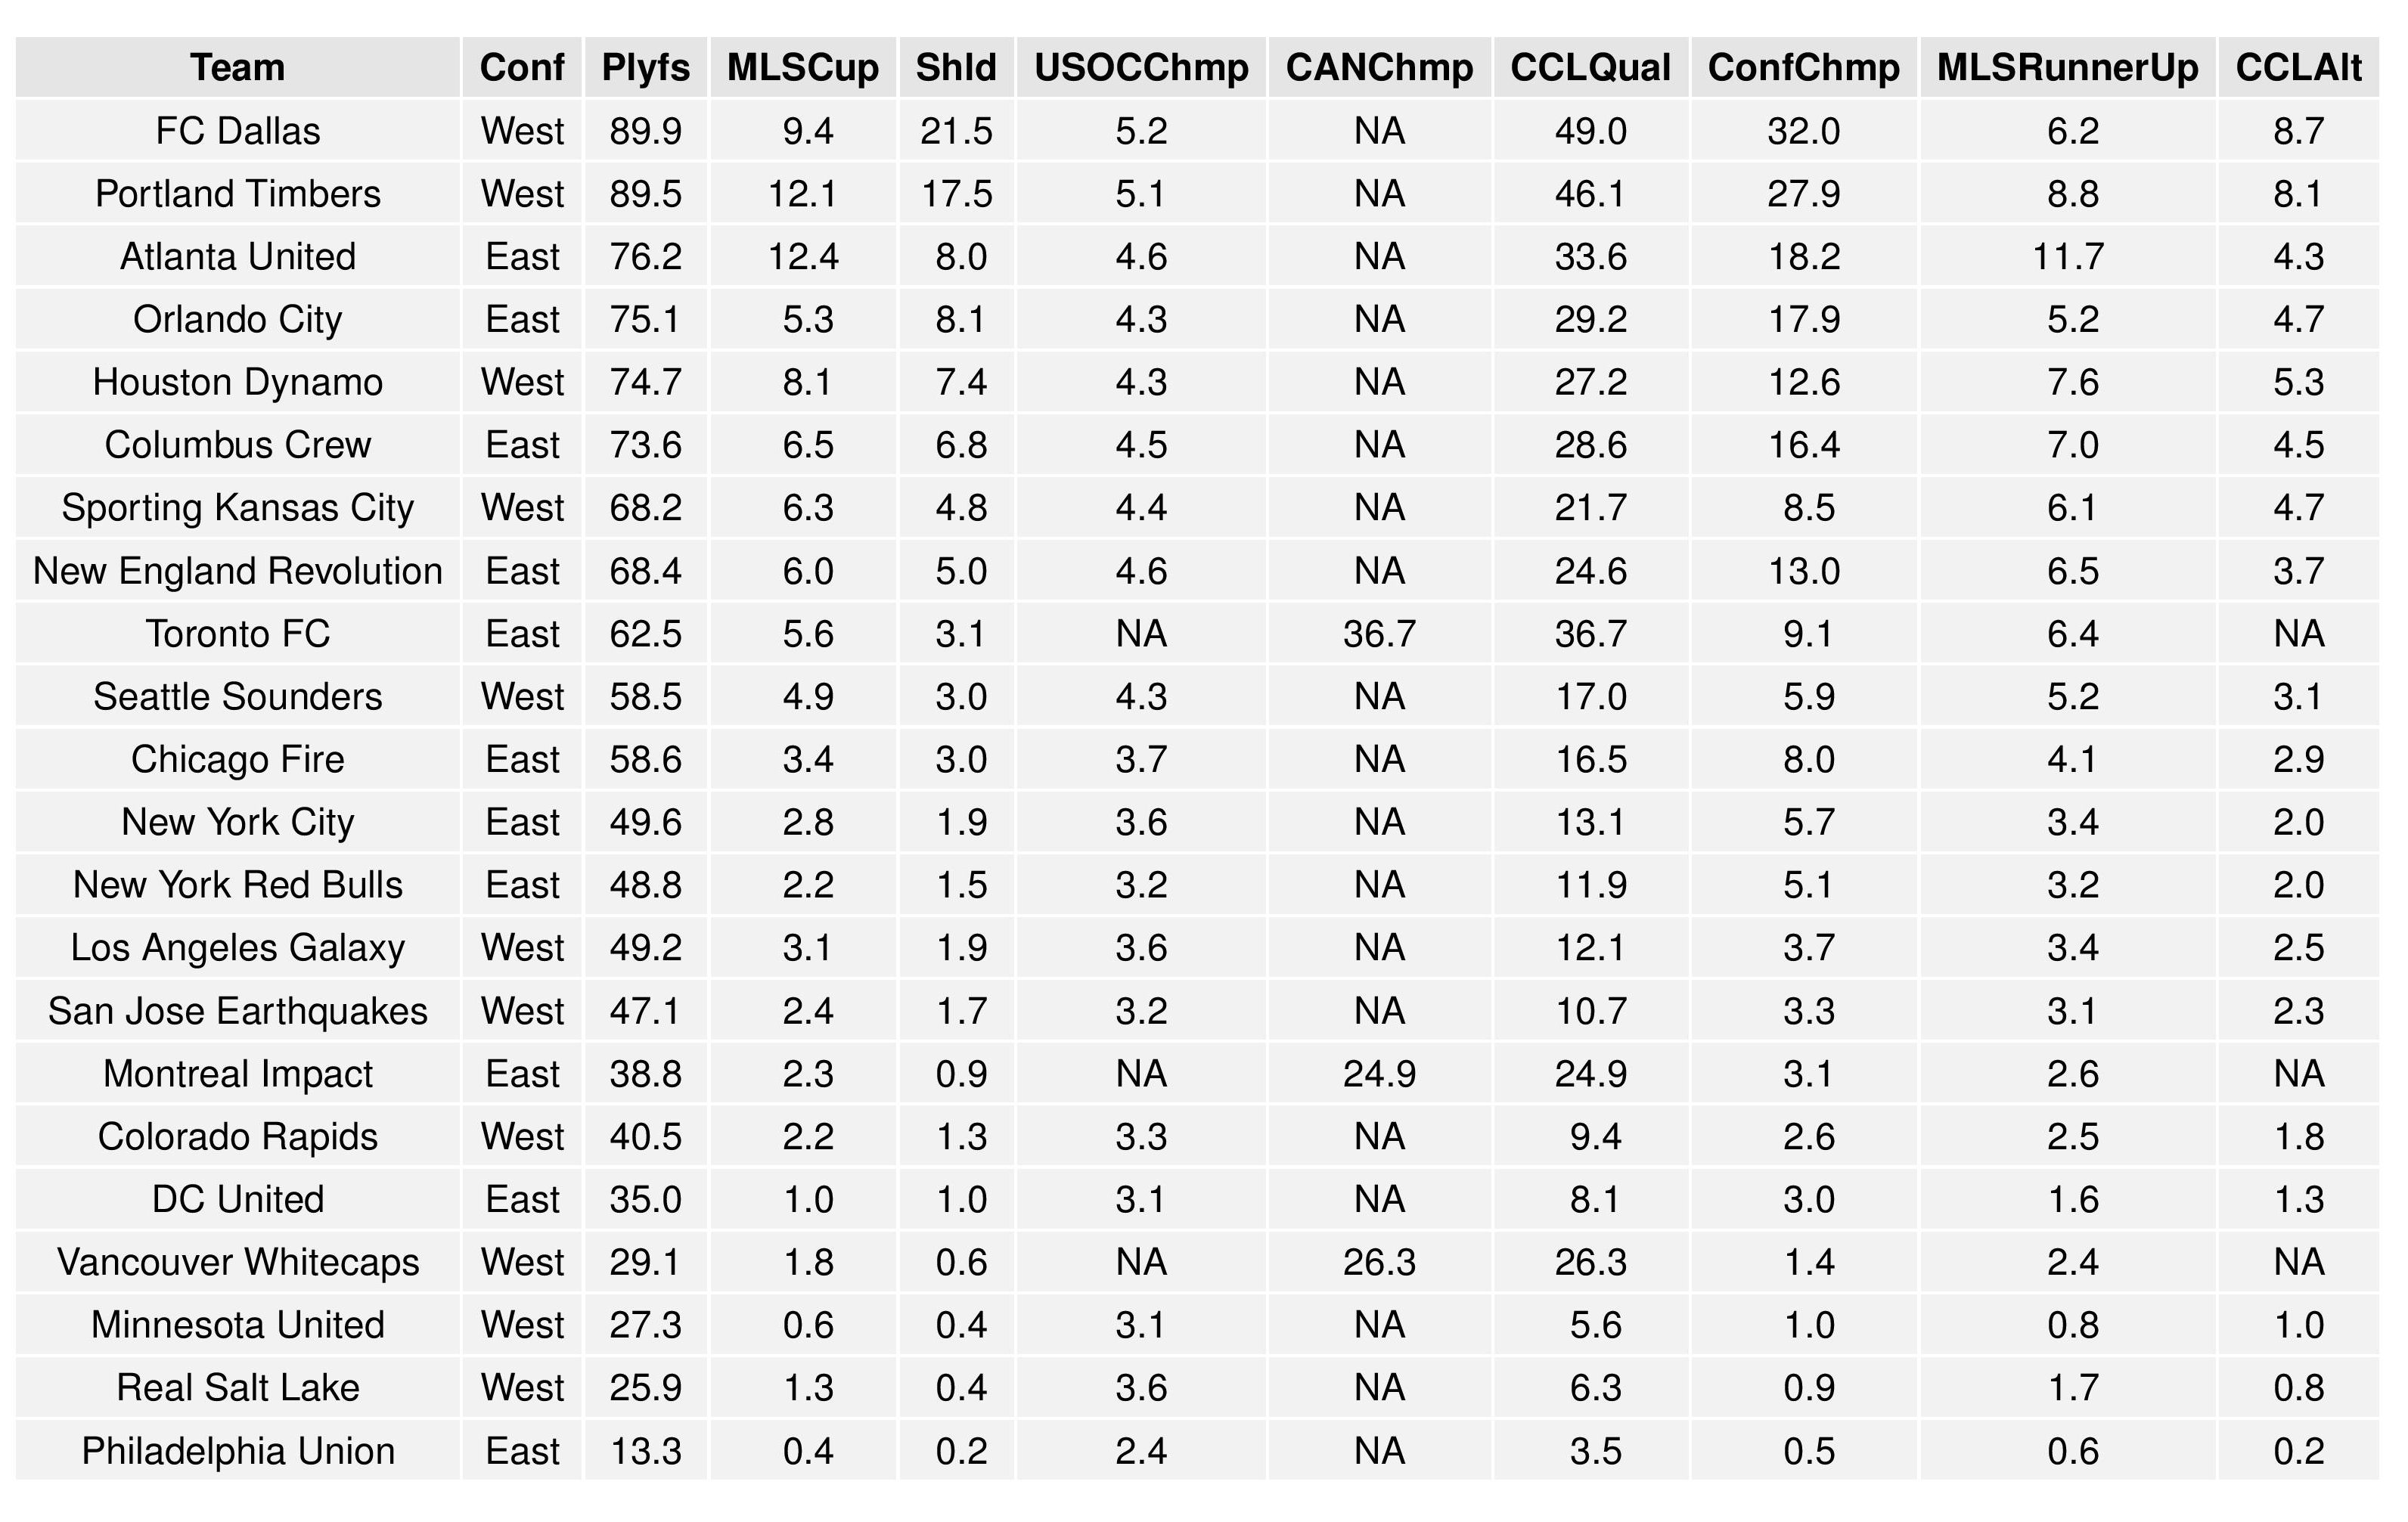
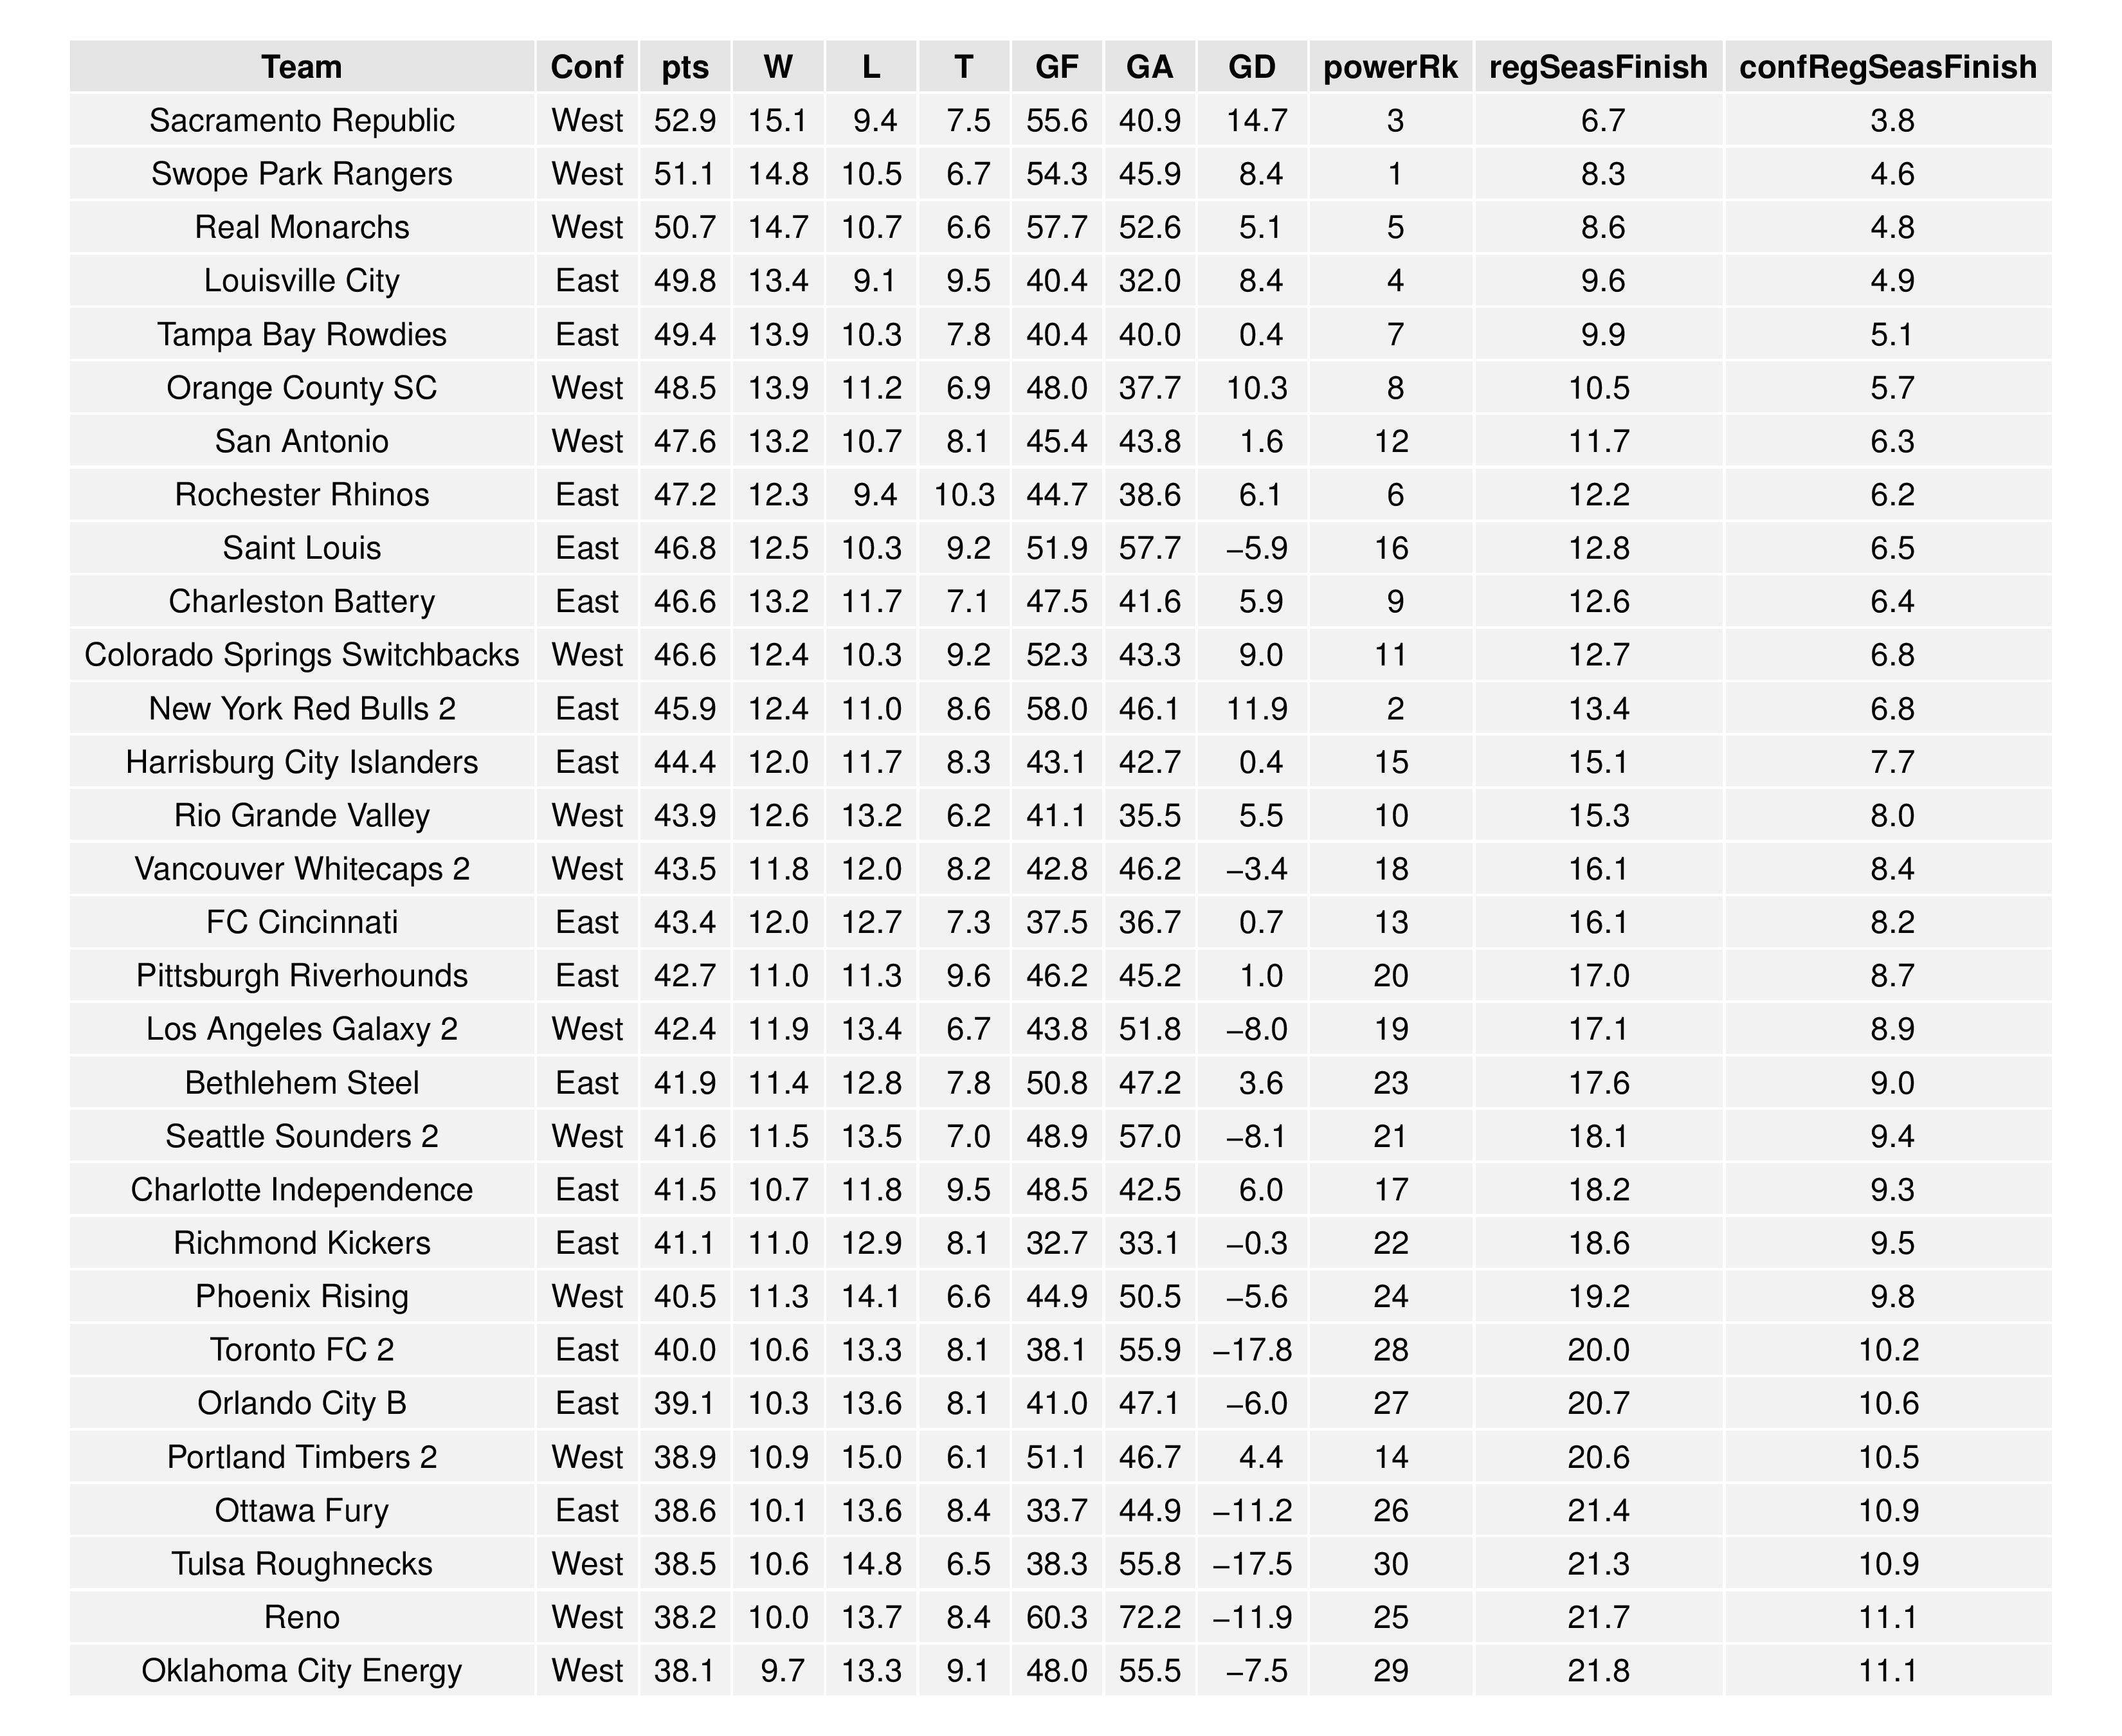
The following shows the summary of the simulations in an easy table format.
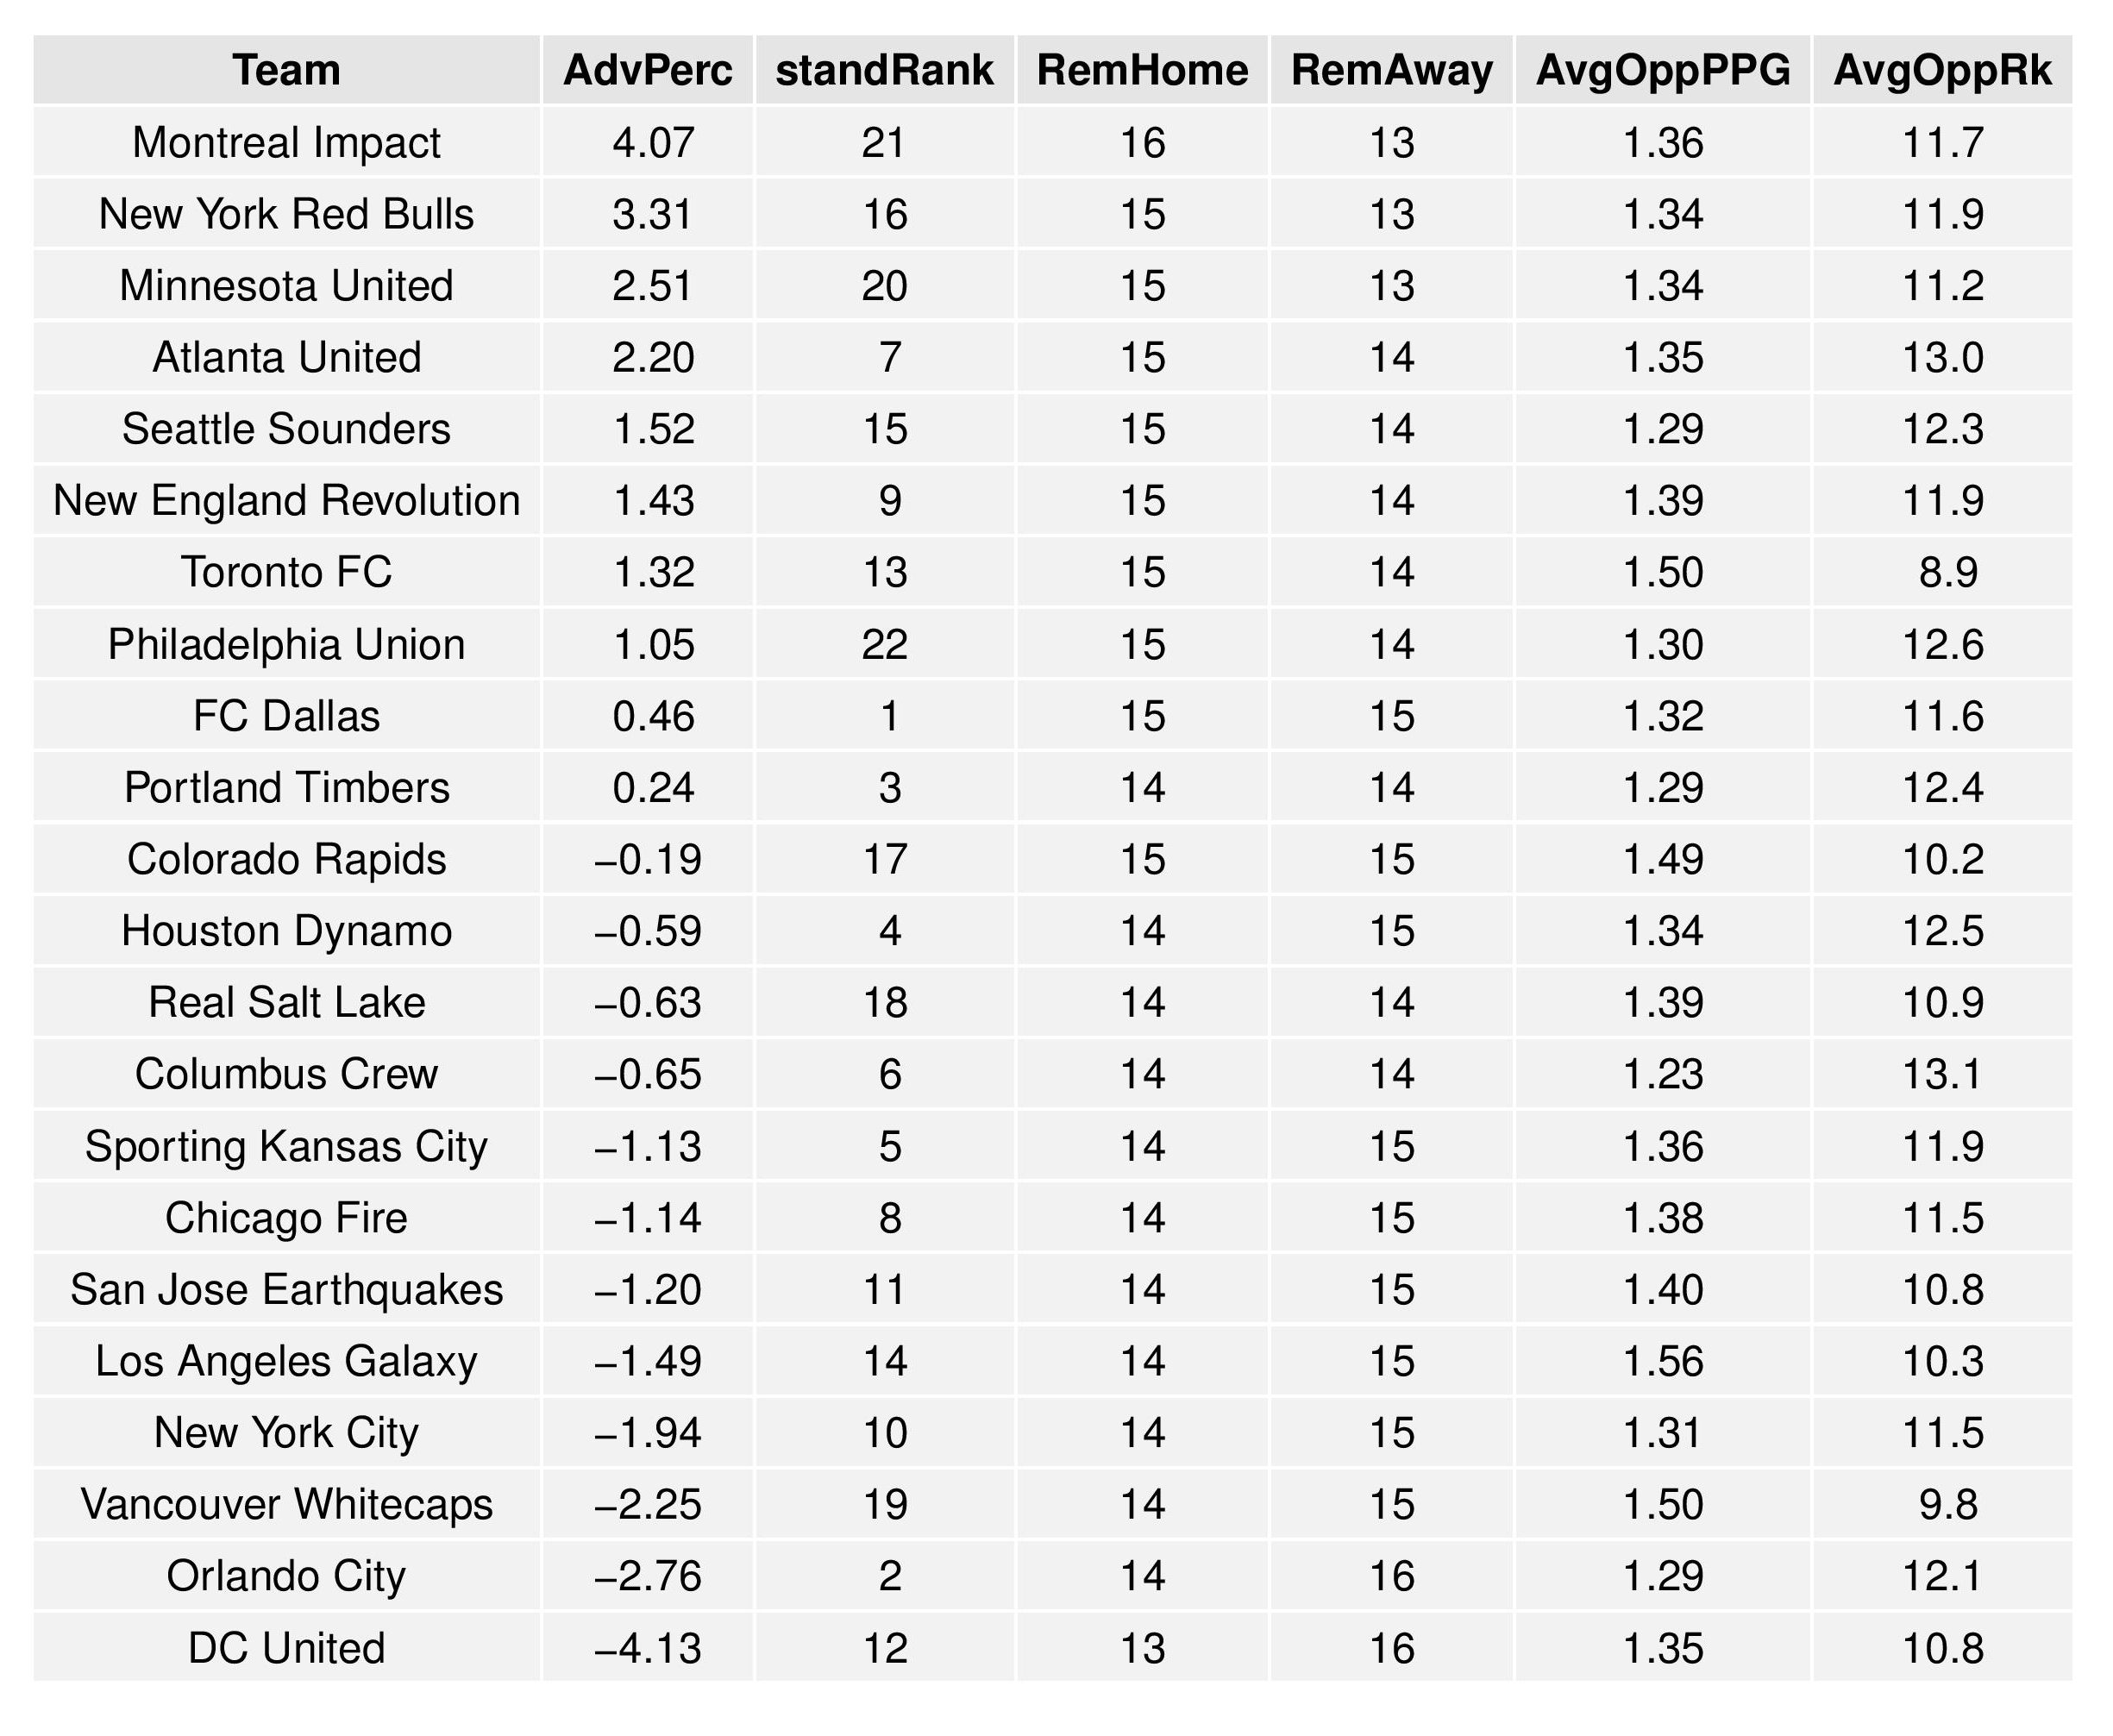
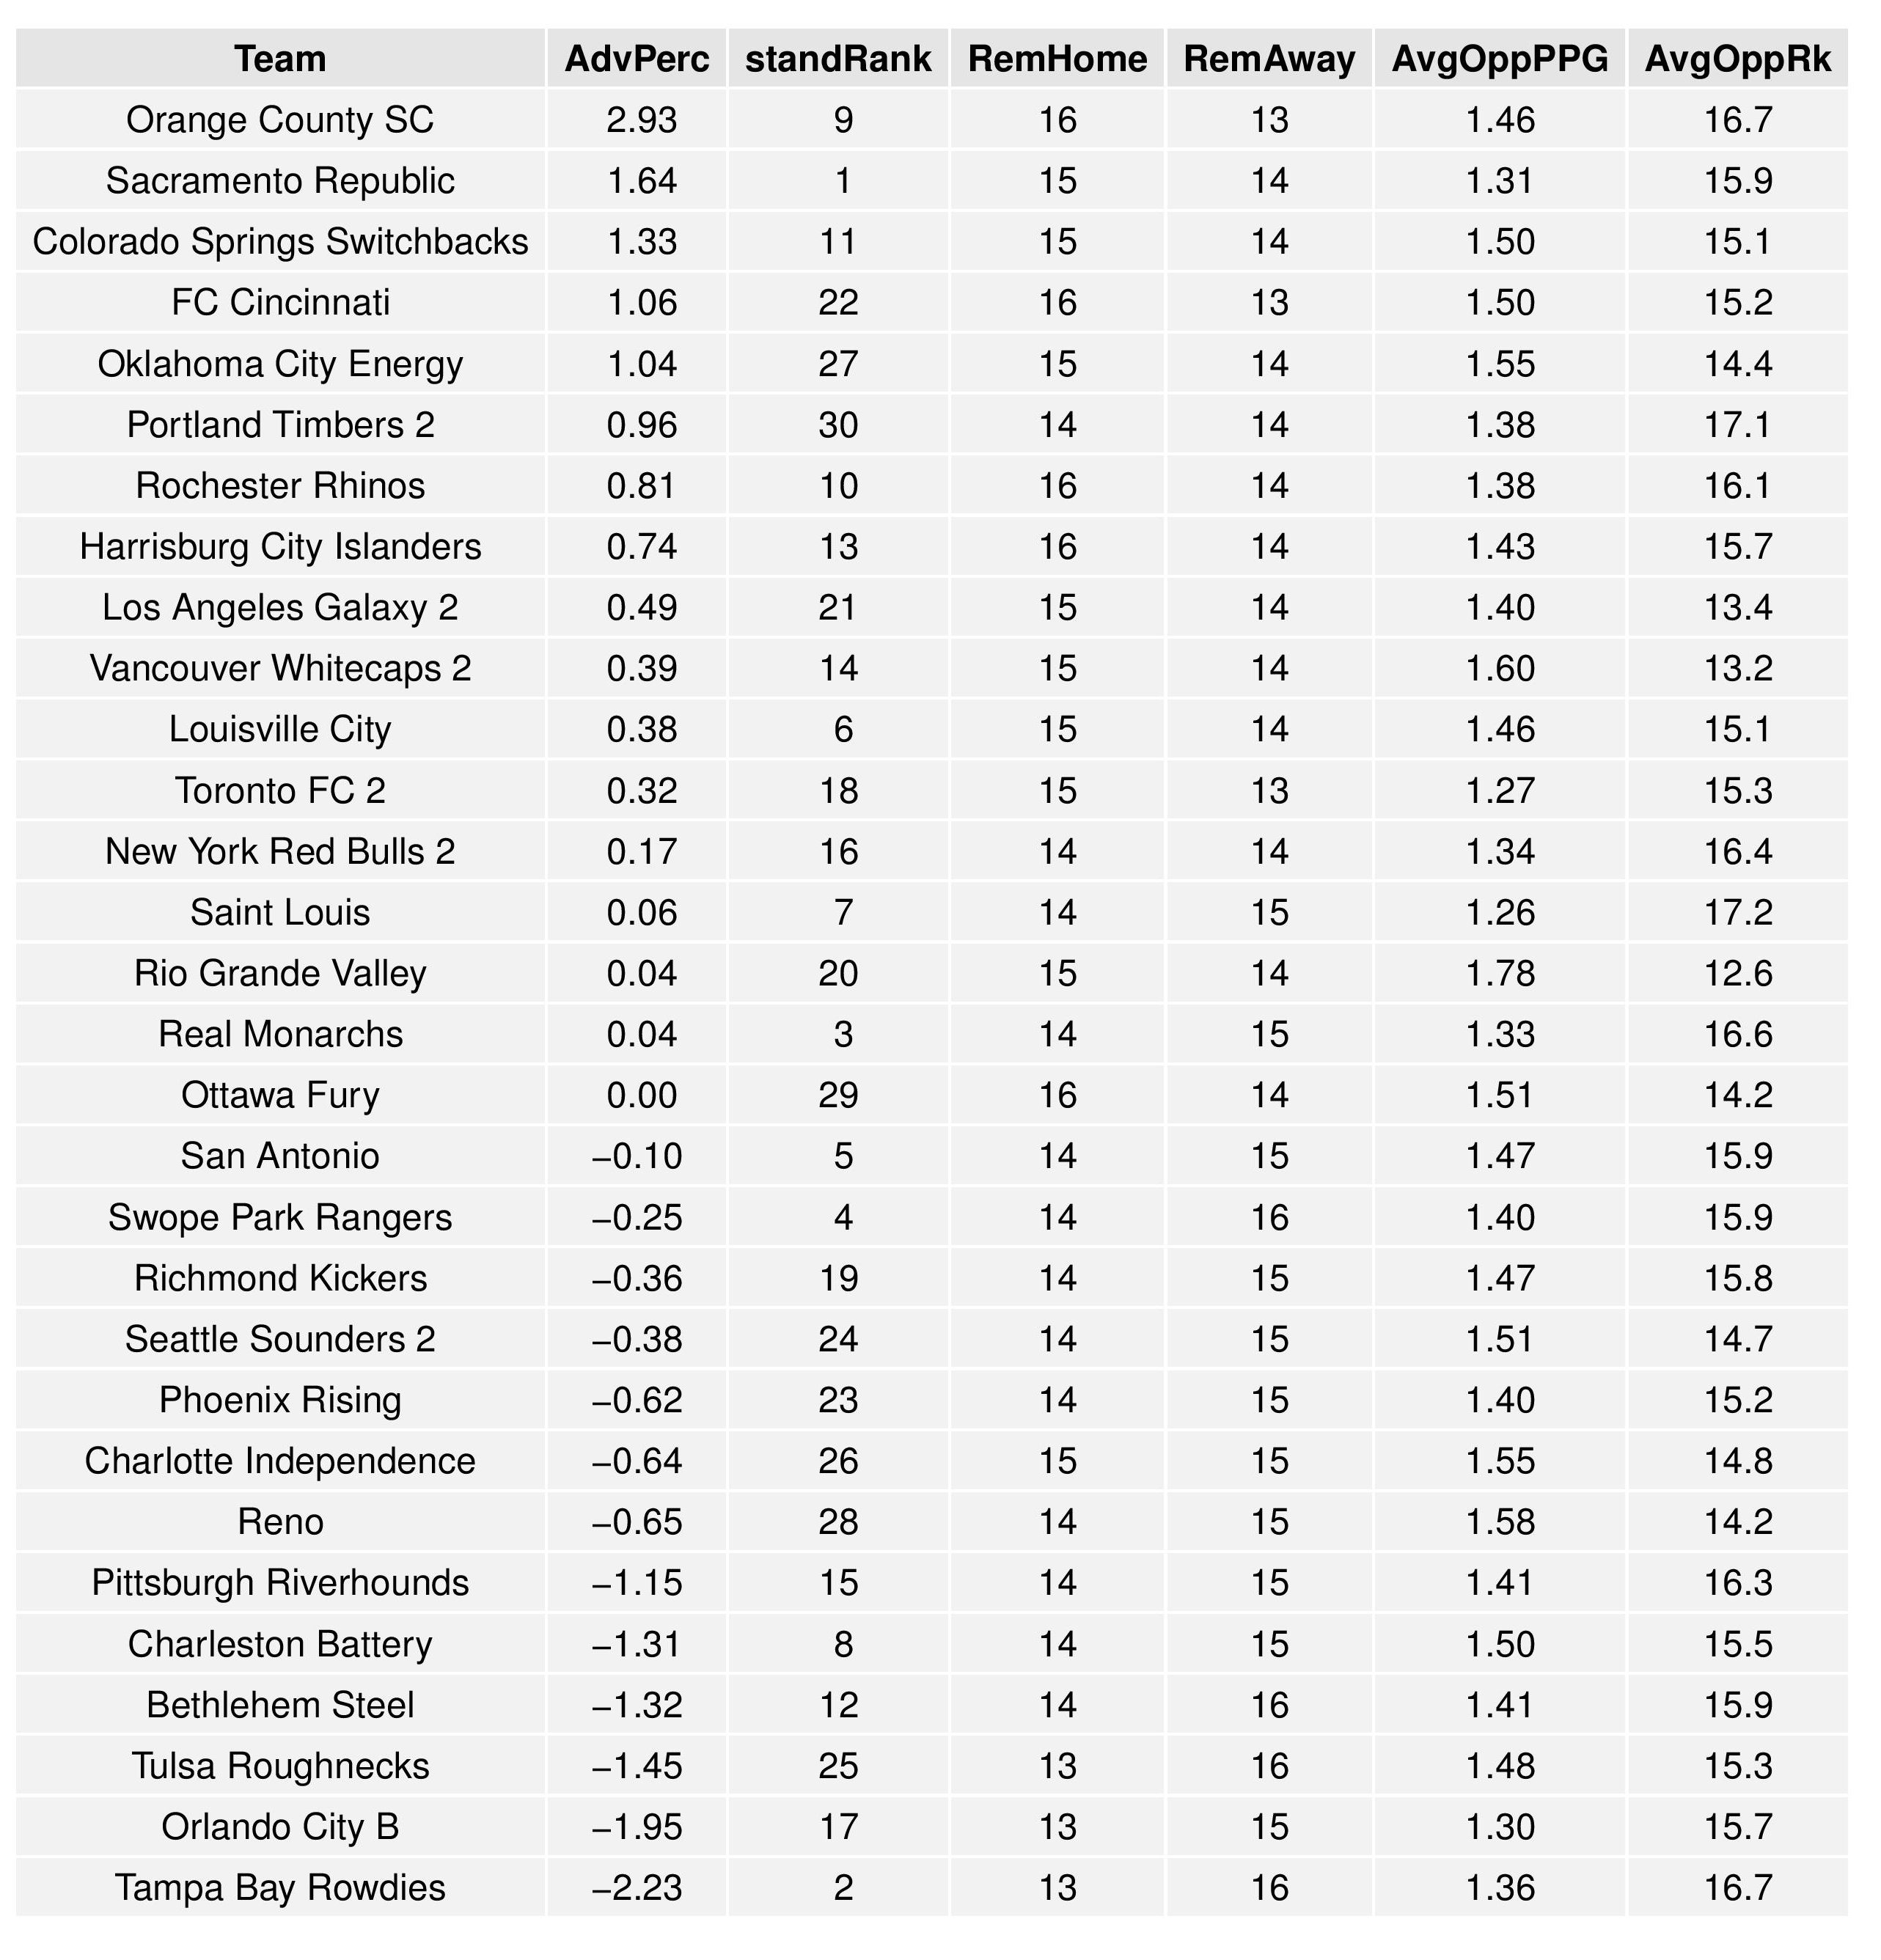
Next we show how the Remaining Strength of Schedule affects each team.
The “Points Percentage Advantage” shown on the X-axis represents the percentage of points expected over the league average schedule. This “points expected” value is generated by simulating how all teams would perform with all remaining schedules (and therefore judges a schedule based upon how all teams would perform in that scenario).
In short, the higher the value, the easier the remaining schedule.
Remaining home field advantage will be important here. It might also be true that a better team has an ‘easier’ schedule simply because they do not have to play themselves. Likewise, a bad team may have a ‘harder’ schedule because they also do not play themselves.
The table following the chart also shares helpful context with these percentages.

Accompanying the advantage percentage in the following table is their current standings rank (right now ties are not properly calculated beyond pts/gd/gf; I may fix that, but maybe not for a while), the remaining home matches, the remaining away matches, the current average points-per-game of future opponents (results-based, not model-based), and the average power ranking of future opponents according to SEBA.
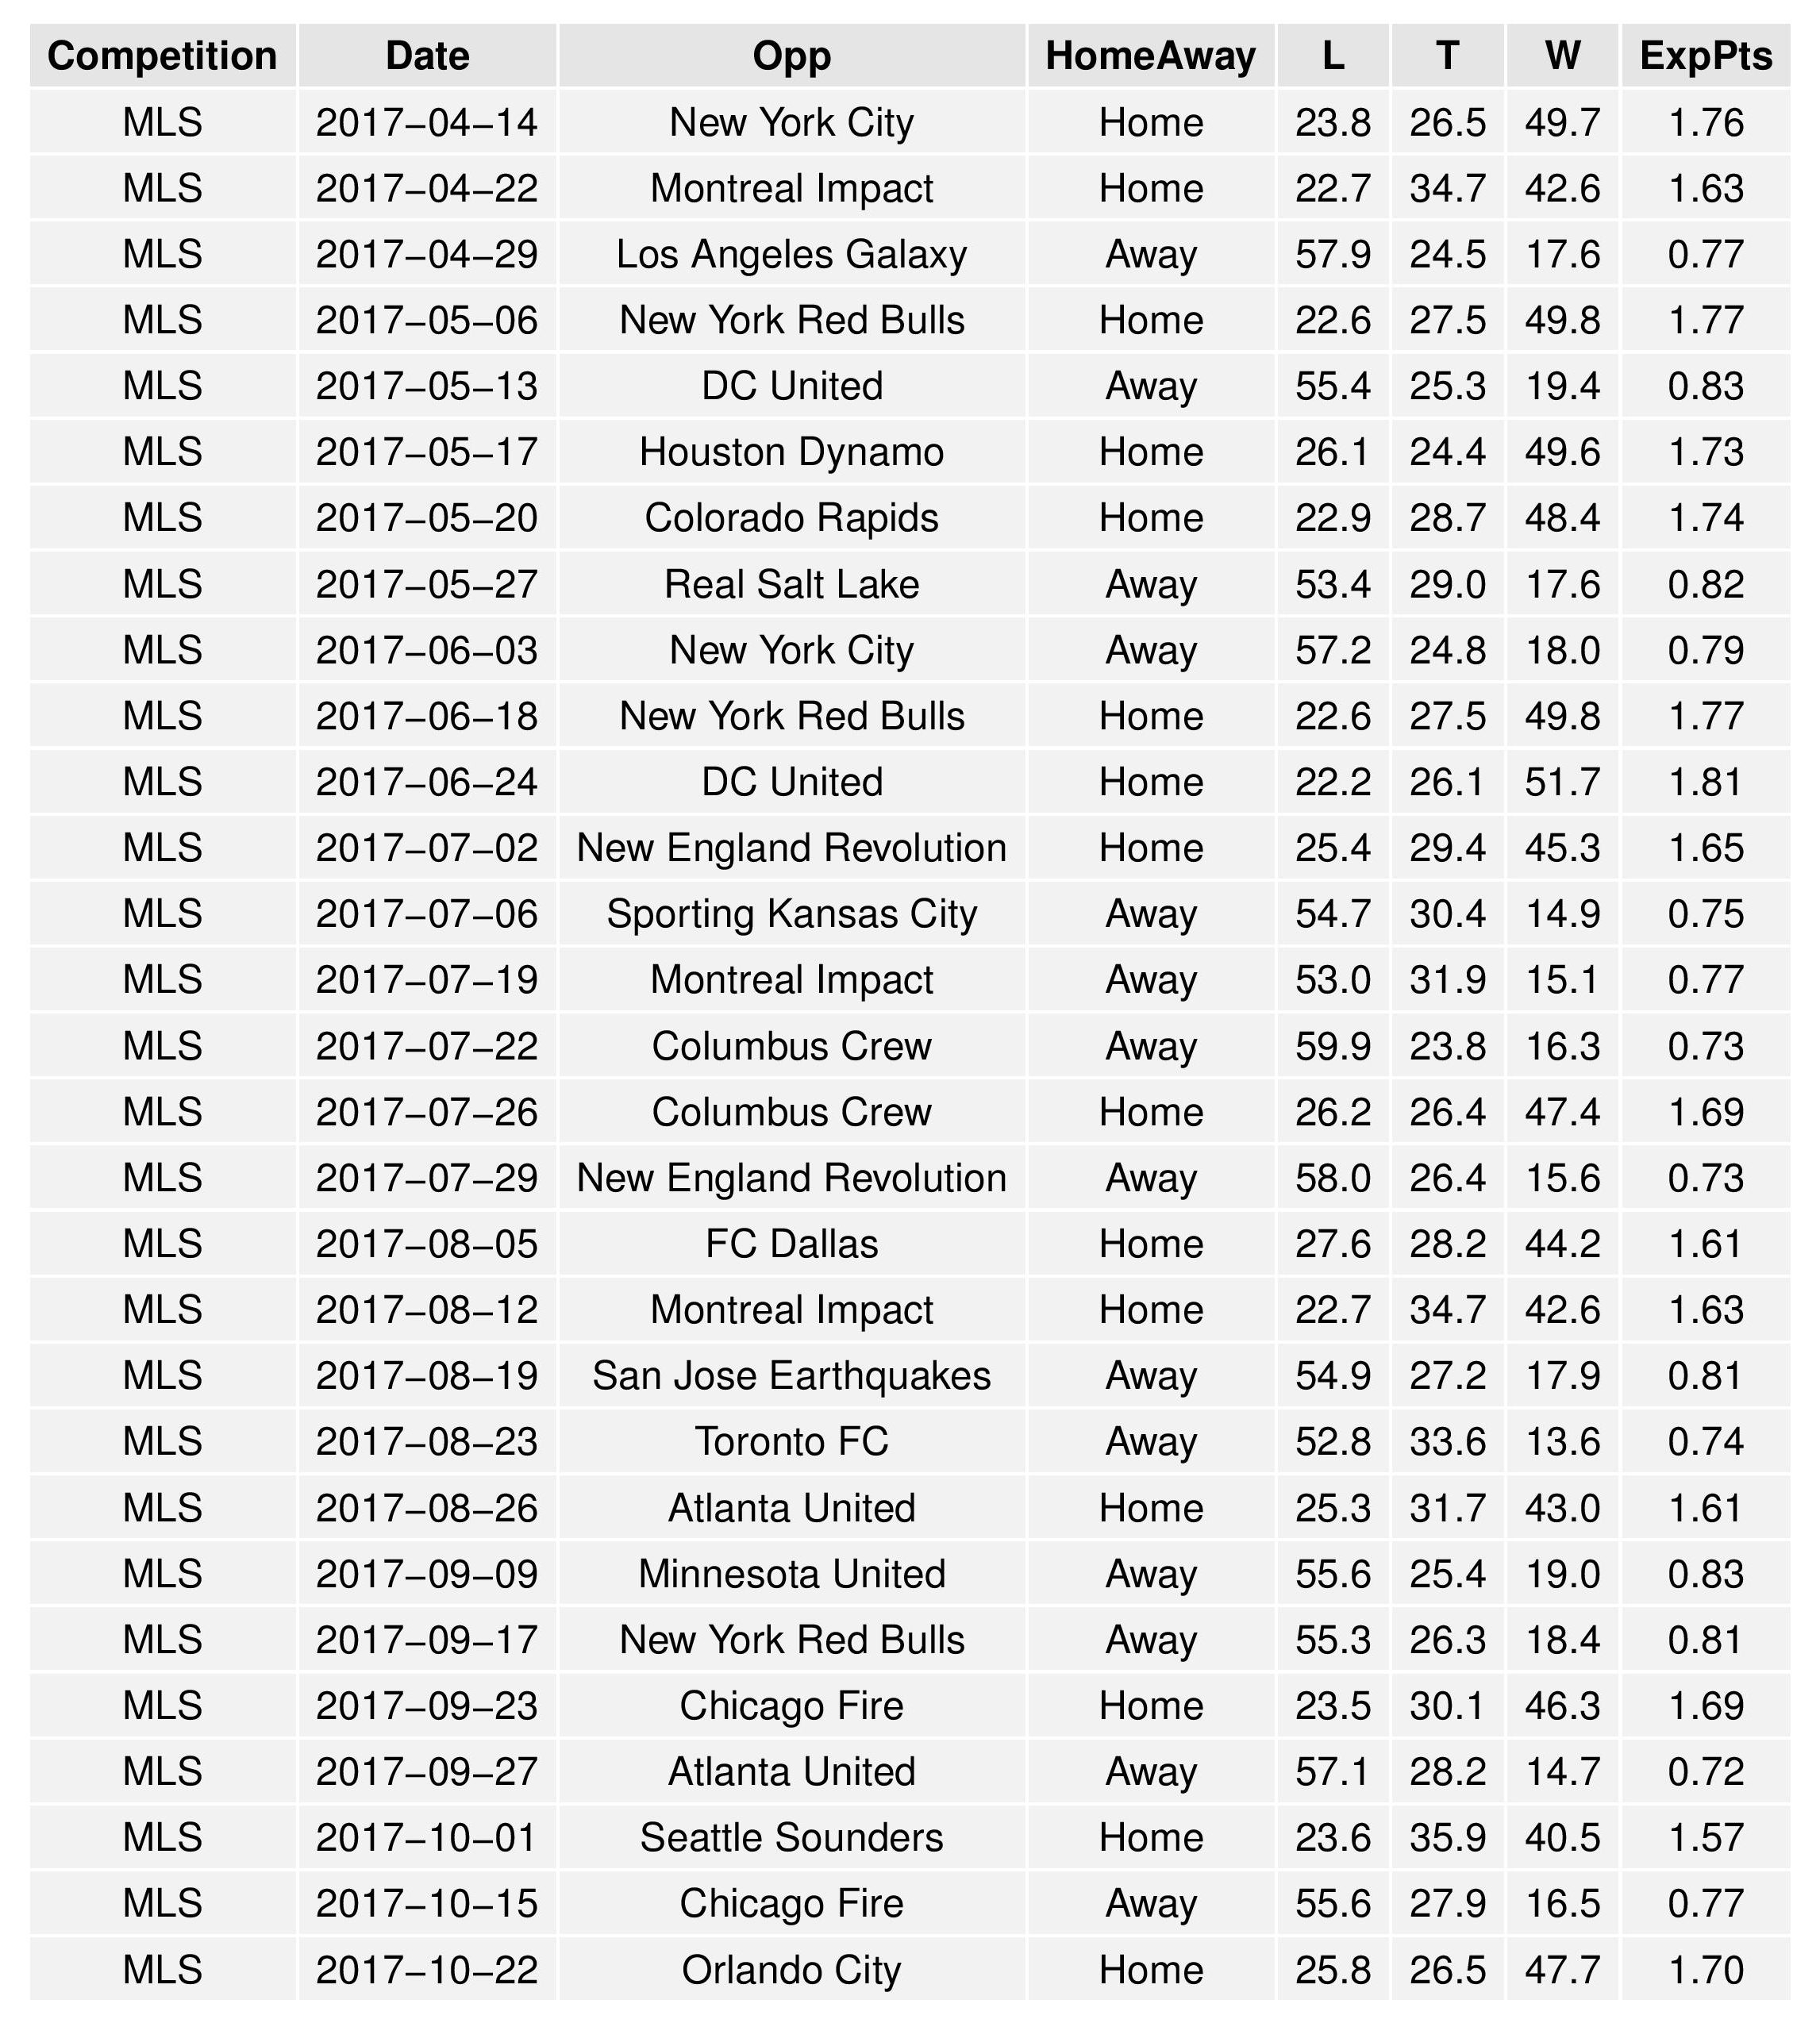
The following shows the expectations for upcoming Philadelphia matches:
USL
Power Rankings
SEBA has Bethlehem Steel increased to 23rd from 29th. It has Harrisburg City moving up to 15th from 19th.


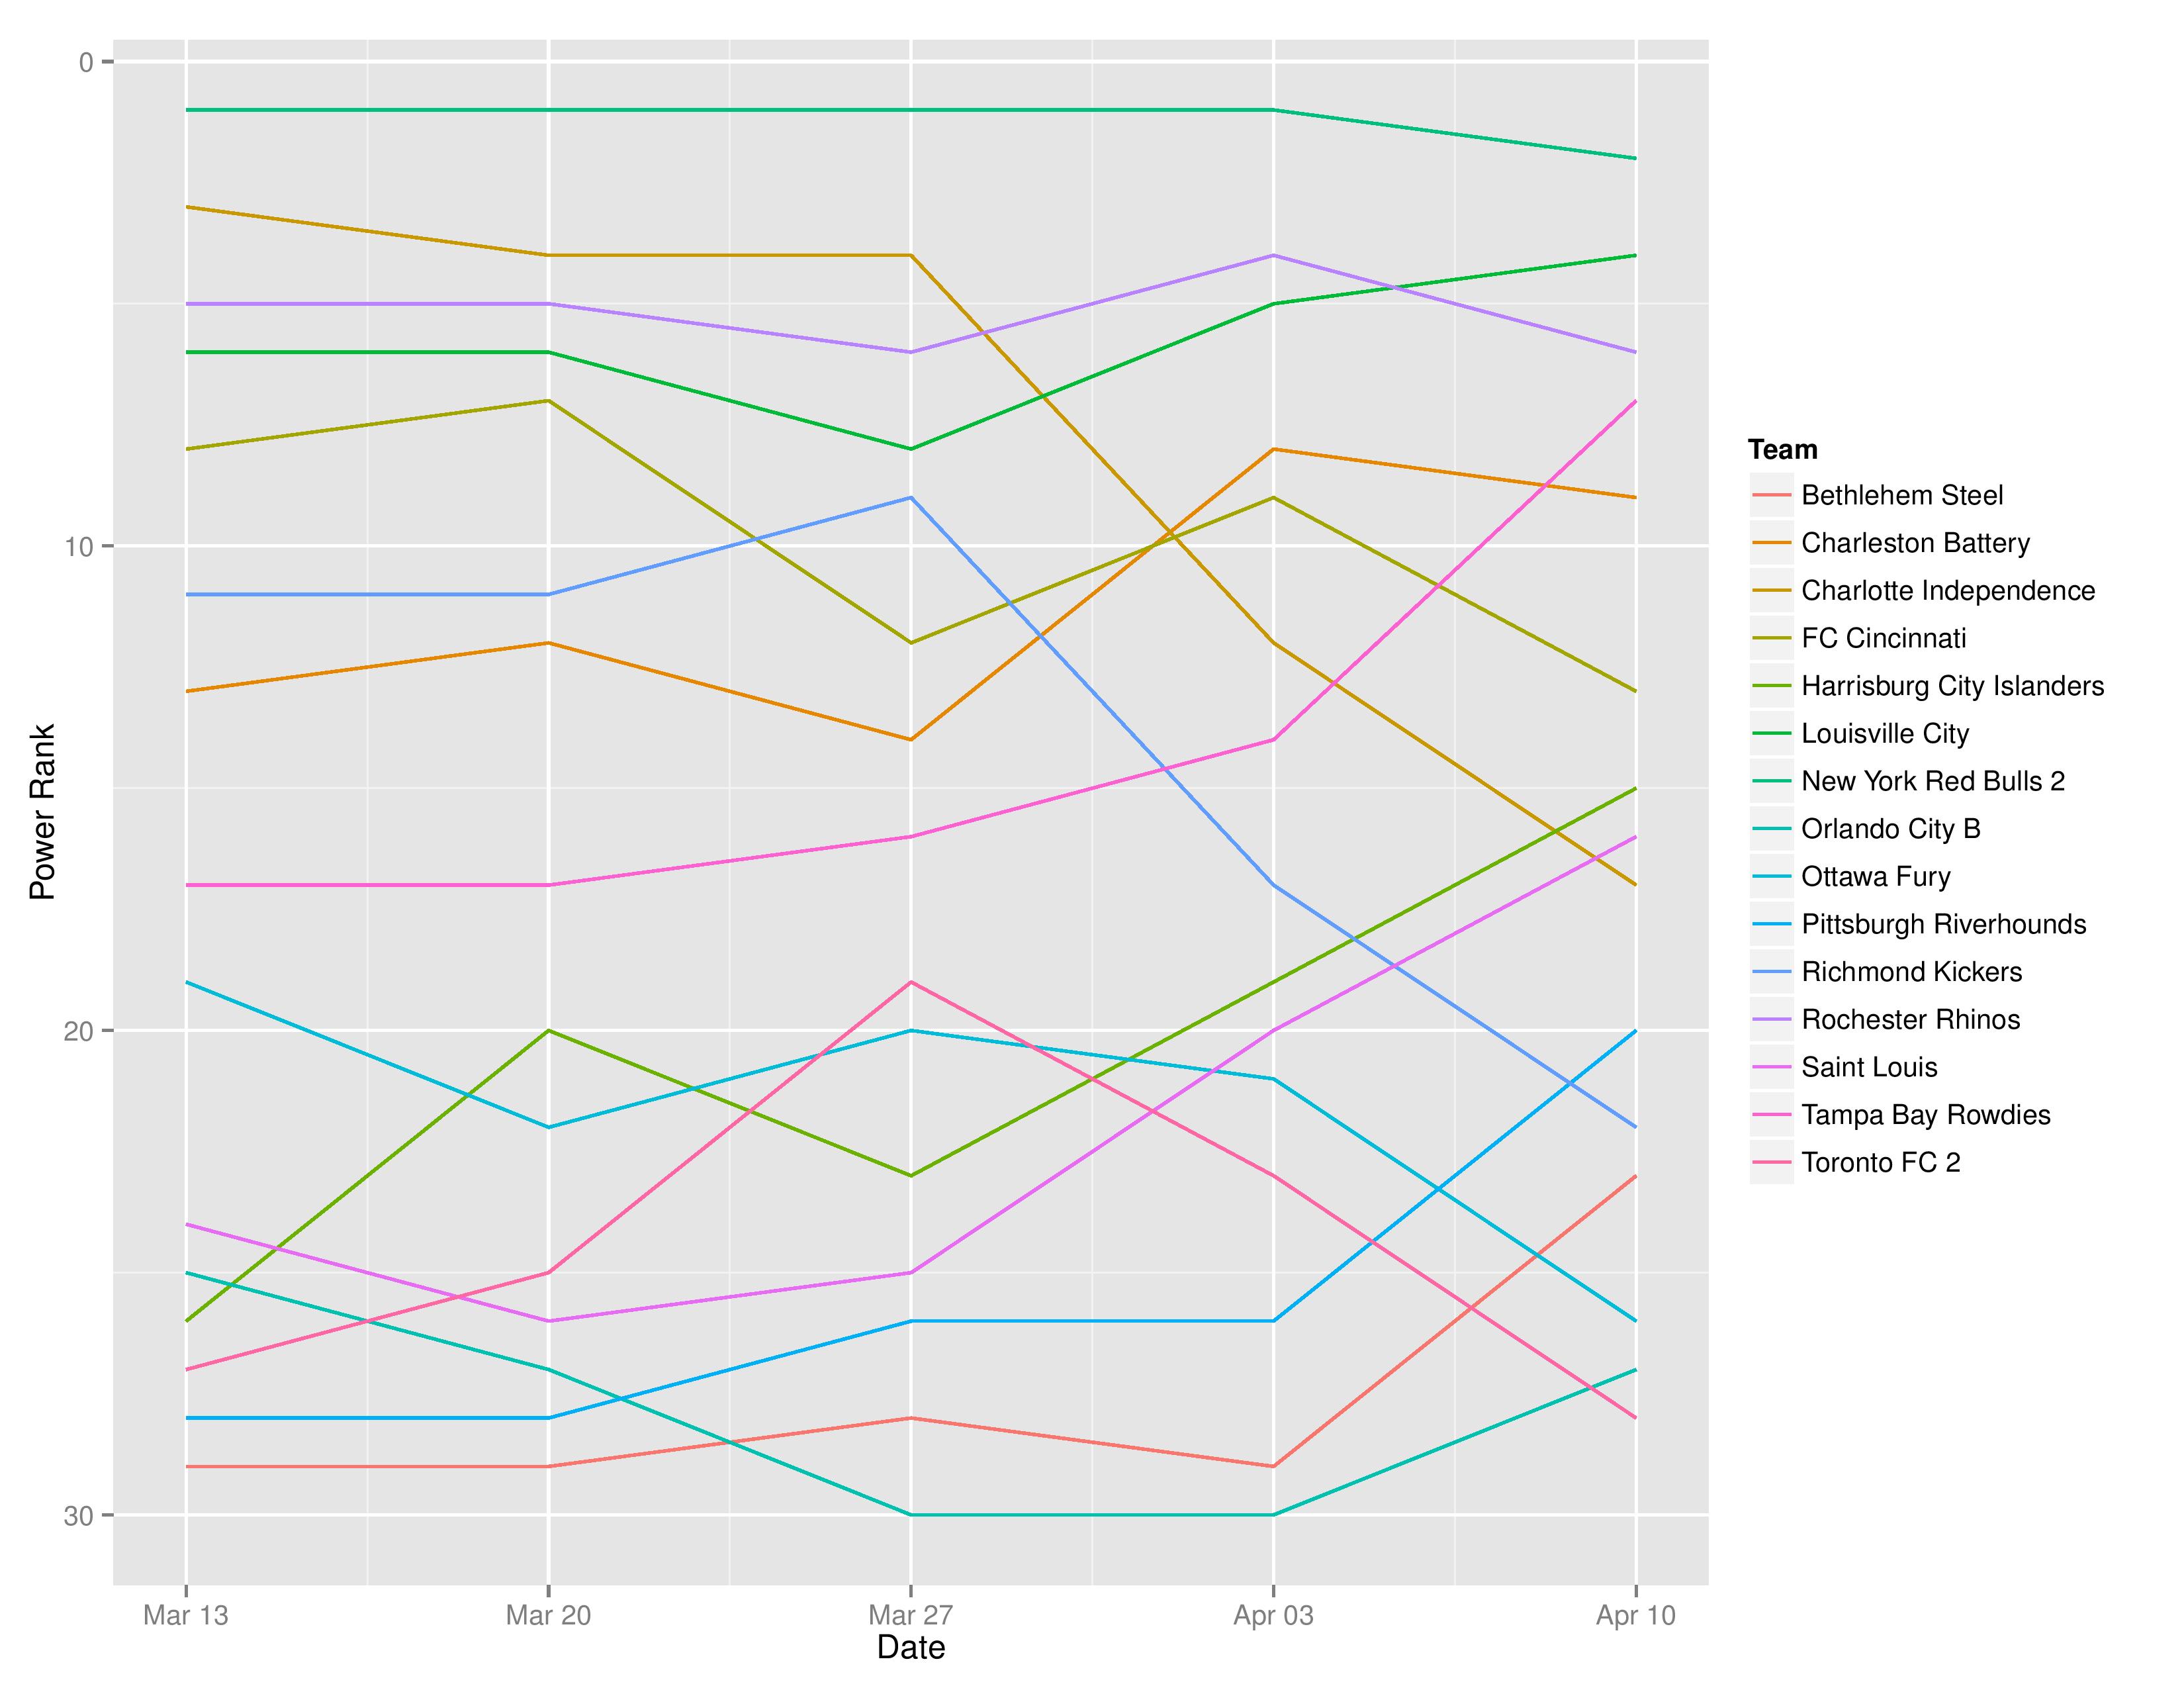
The following shows the evolution of SEBA’s power rankings for the USL East over time.
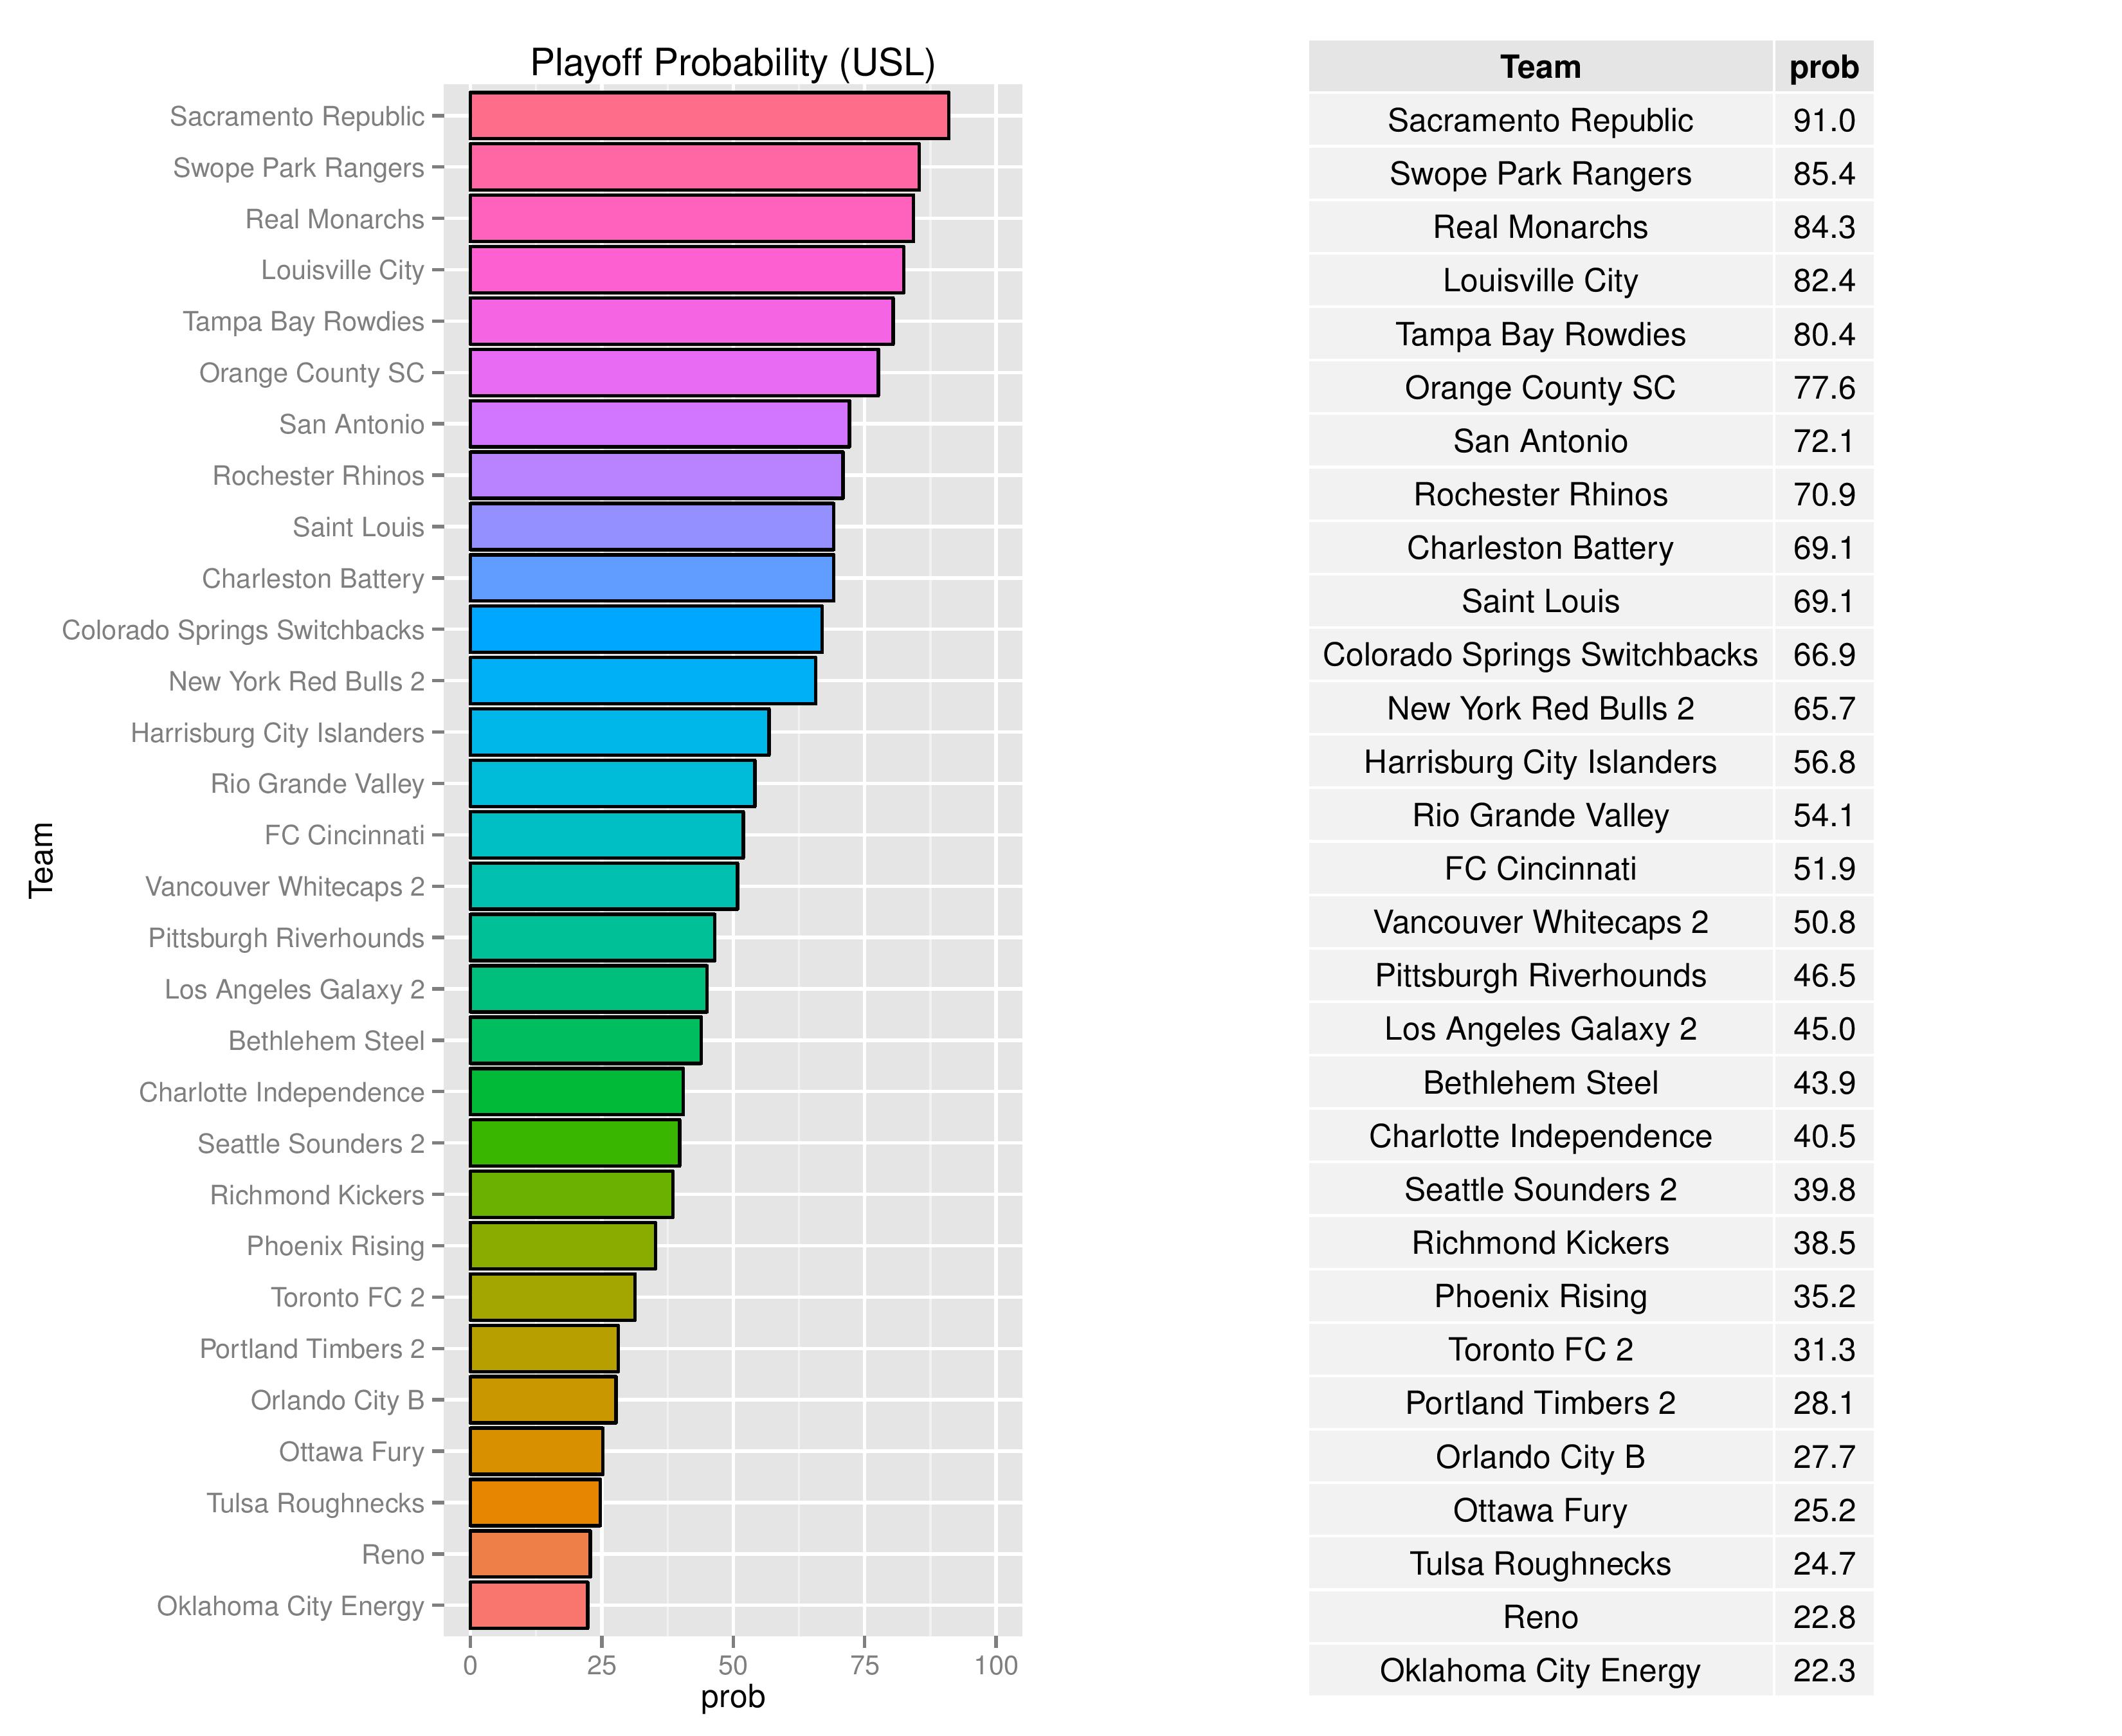
Playoffs probability and more
Bethlehem’s playoff odds increased from 37% to 43.9% and Harrisburg City’s odds increased from 42.7% to 56.8% in making the playoffs.
Bethlehem’s chances at winning the Regular Season Title remained at 0.9% while Harrisburg City increased from 1.3% to 1.9%.

Bethlehem’s odds at becoming the USL Champion remained at 1.8% while Harrisburg City’s increased to 3.0% from 2.2%:

The USOC odds for USL clubs alone are as follows. Harrisburg decreased to 0.7% odds from 0.8%. Bethlehem, being Philadelphia-controlled, is not eligible for the U.S. Open Cup.

Over time, we can see how the odds for different prizes change for Bethlehem and Harrisburg.


The following are probabilities for each category of outcomes for Bethlehem.

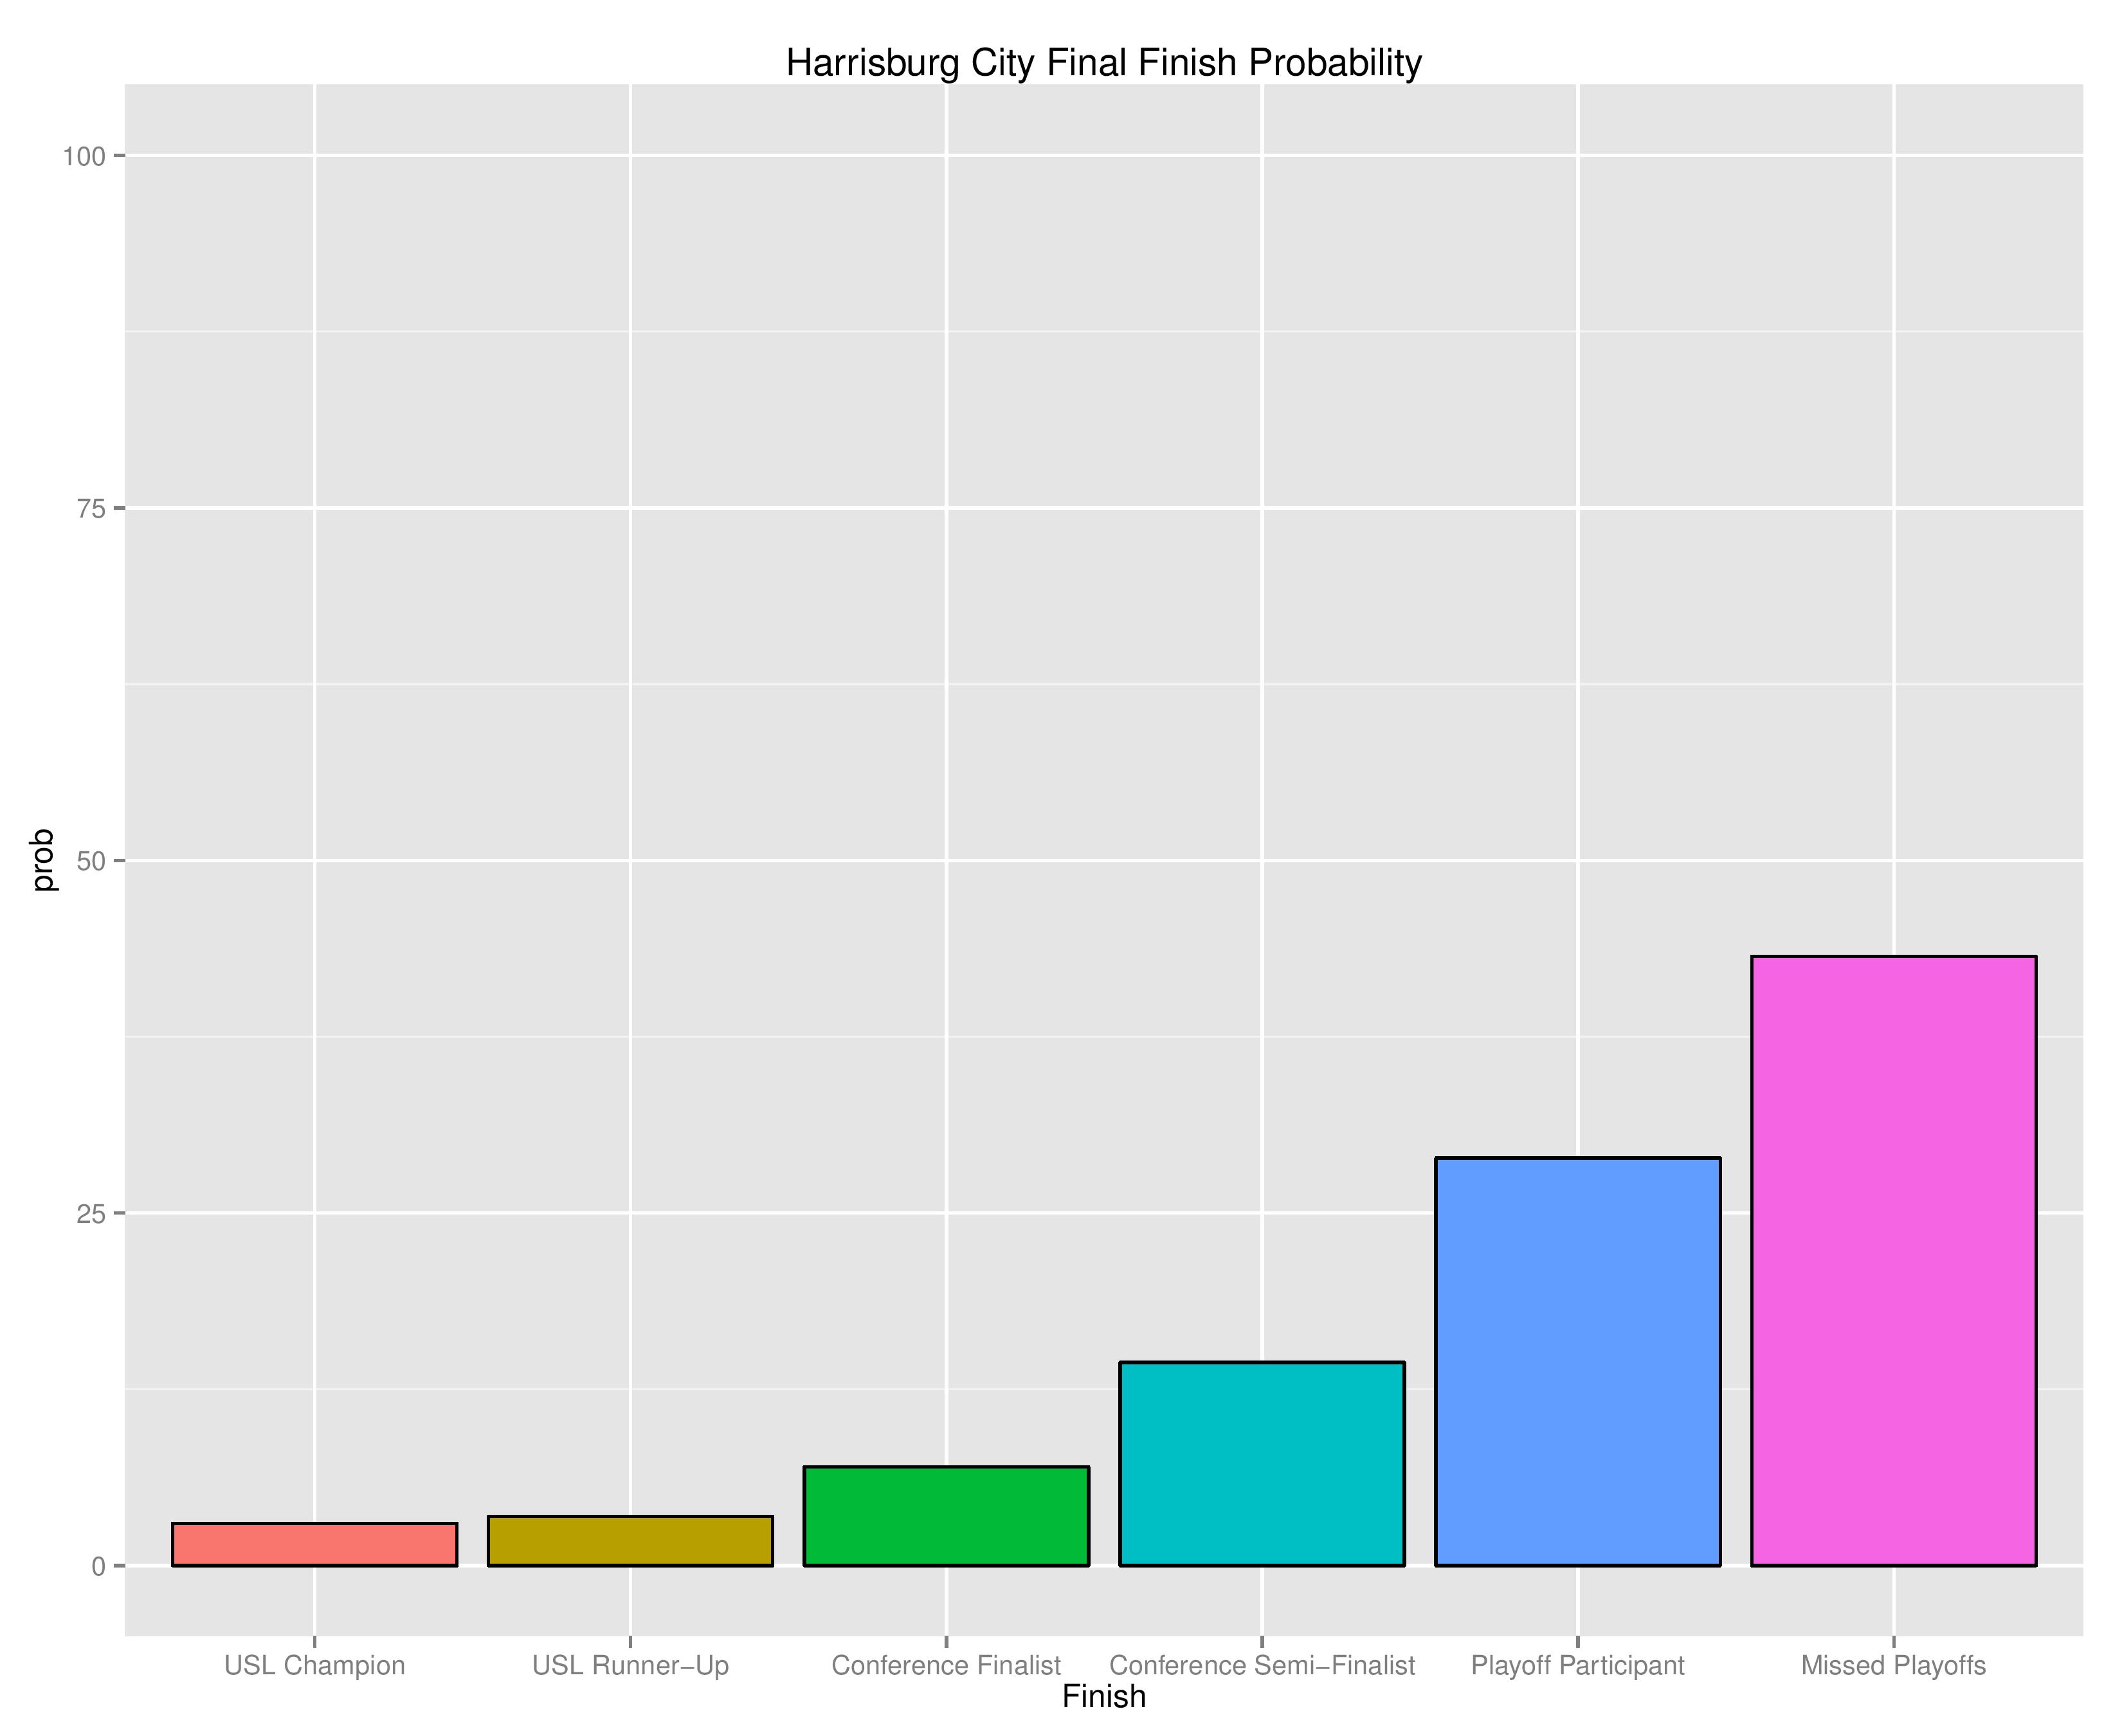
The following are probabilities for each category of outcomes for Harrisburg City.
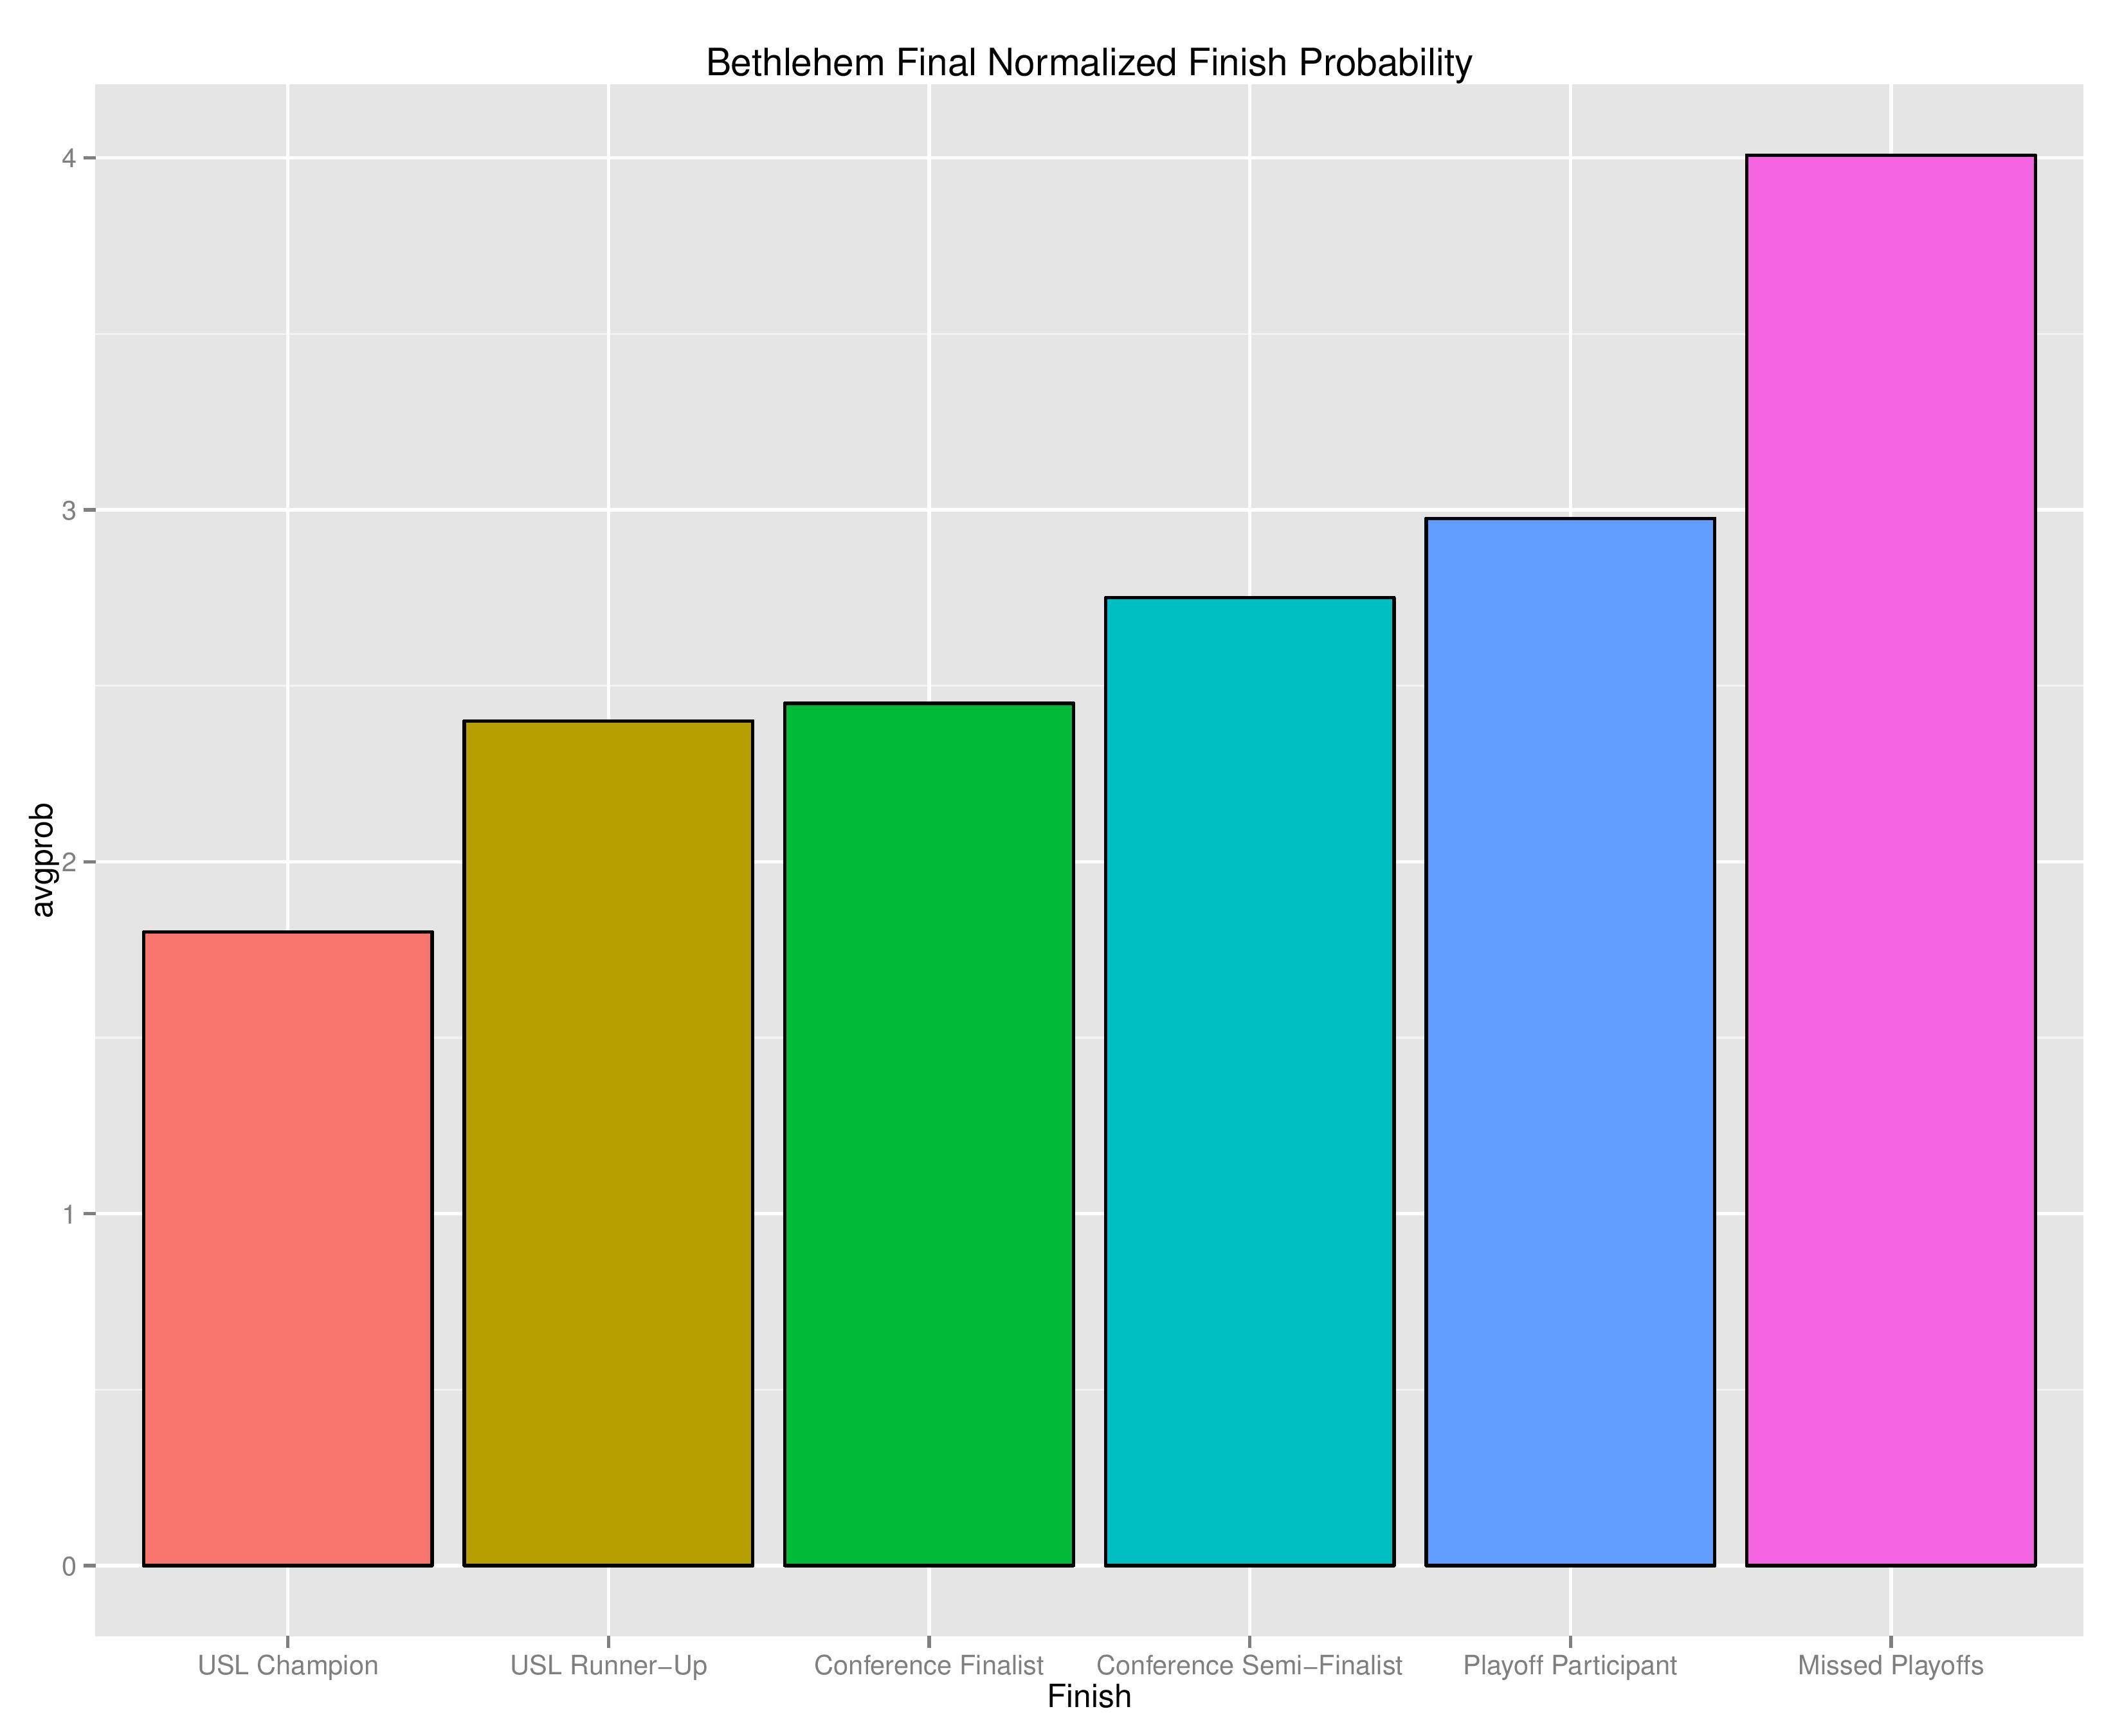
The following shows the relative probability of the prior categories. If the projection system were entirely random, these bars would be even, despite that “Missed Playoffs” is inherently 14 times more likely than “USL Champion.” The chart outlines where the club is headed. We begin with Bethlehem Steel.

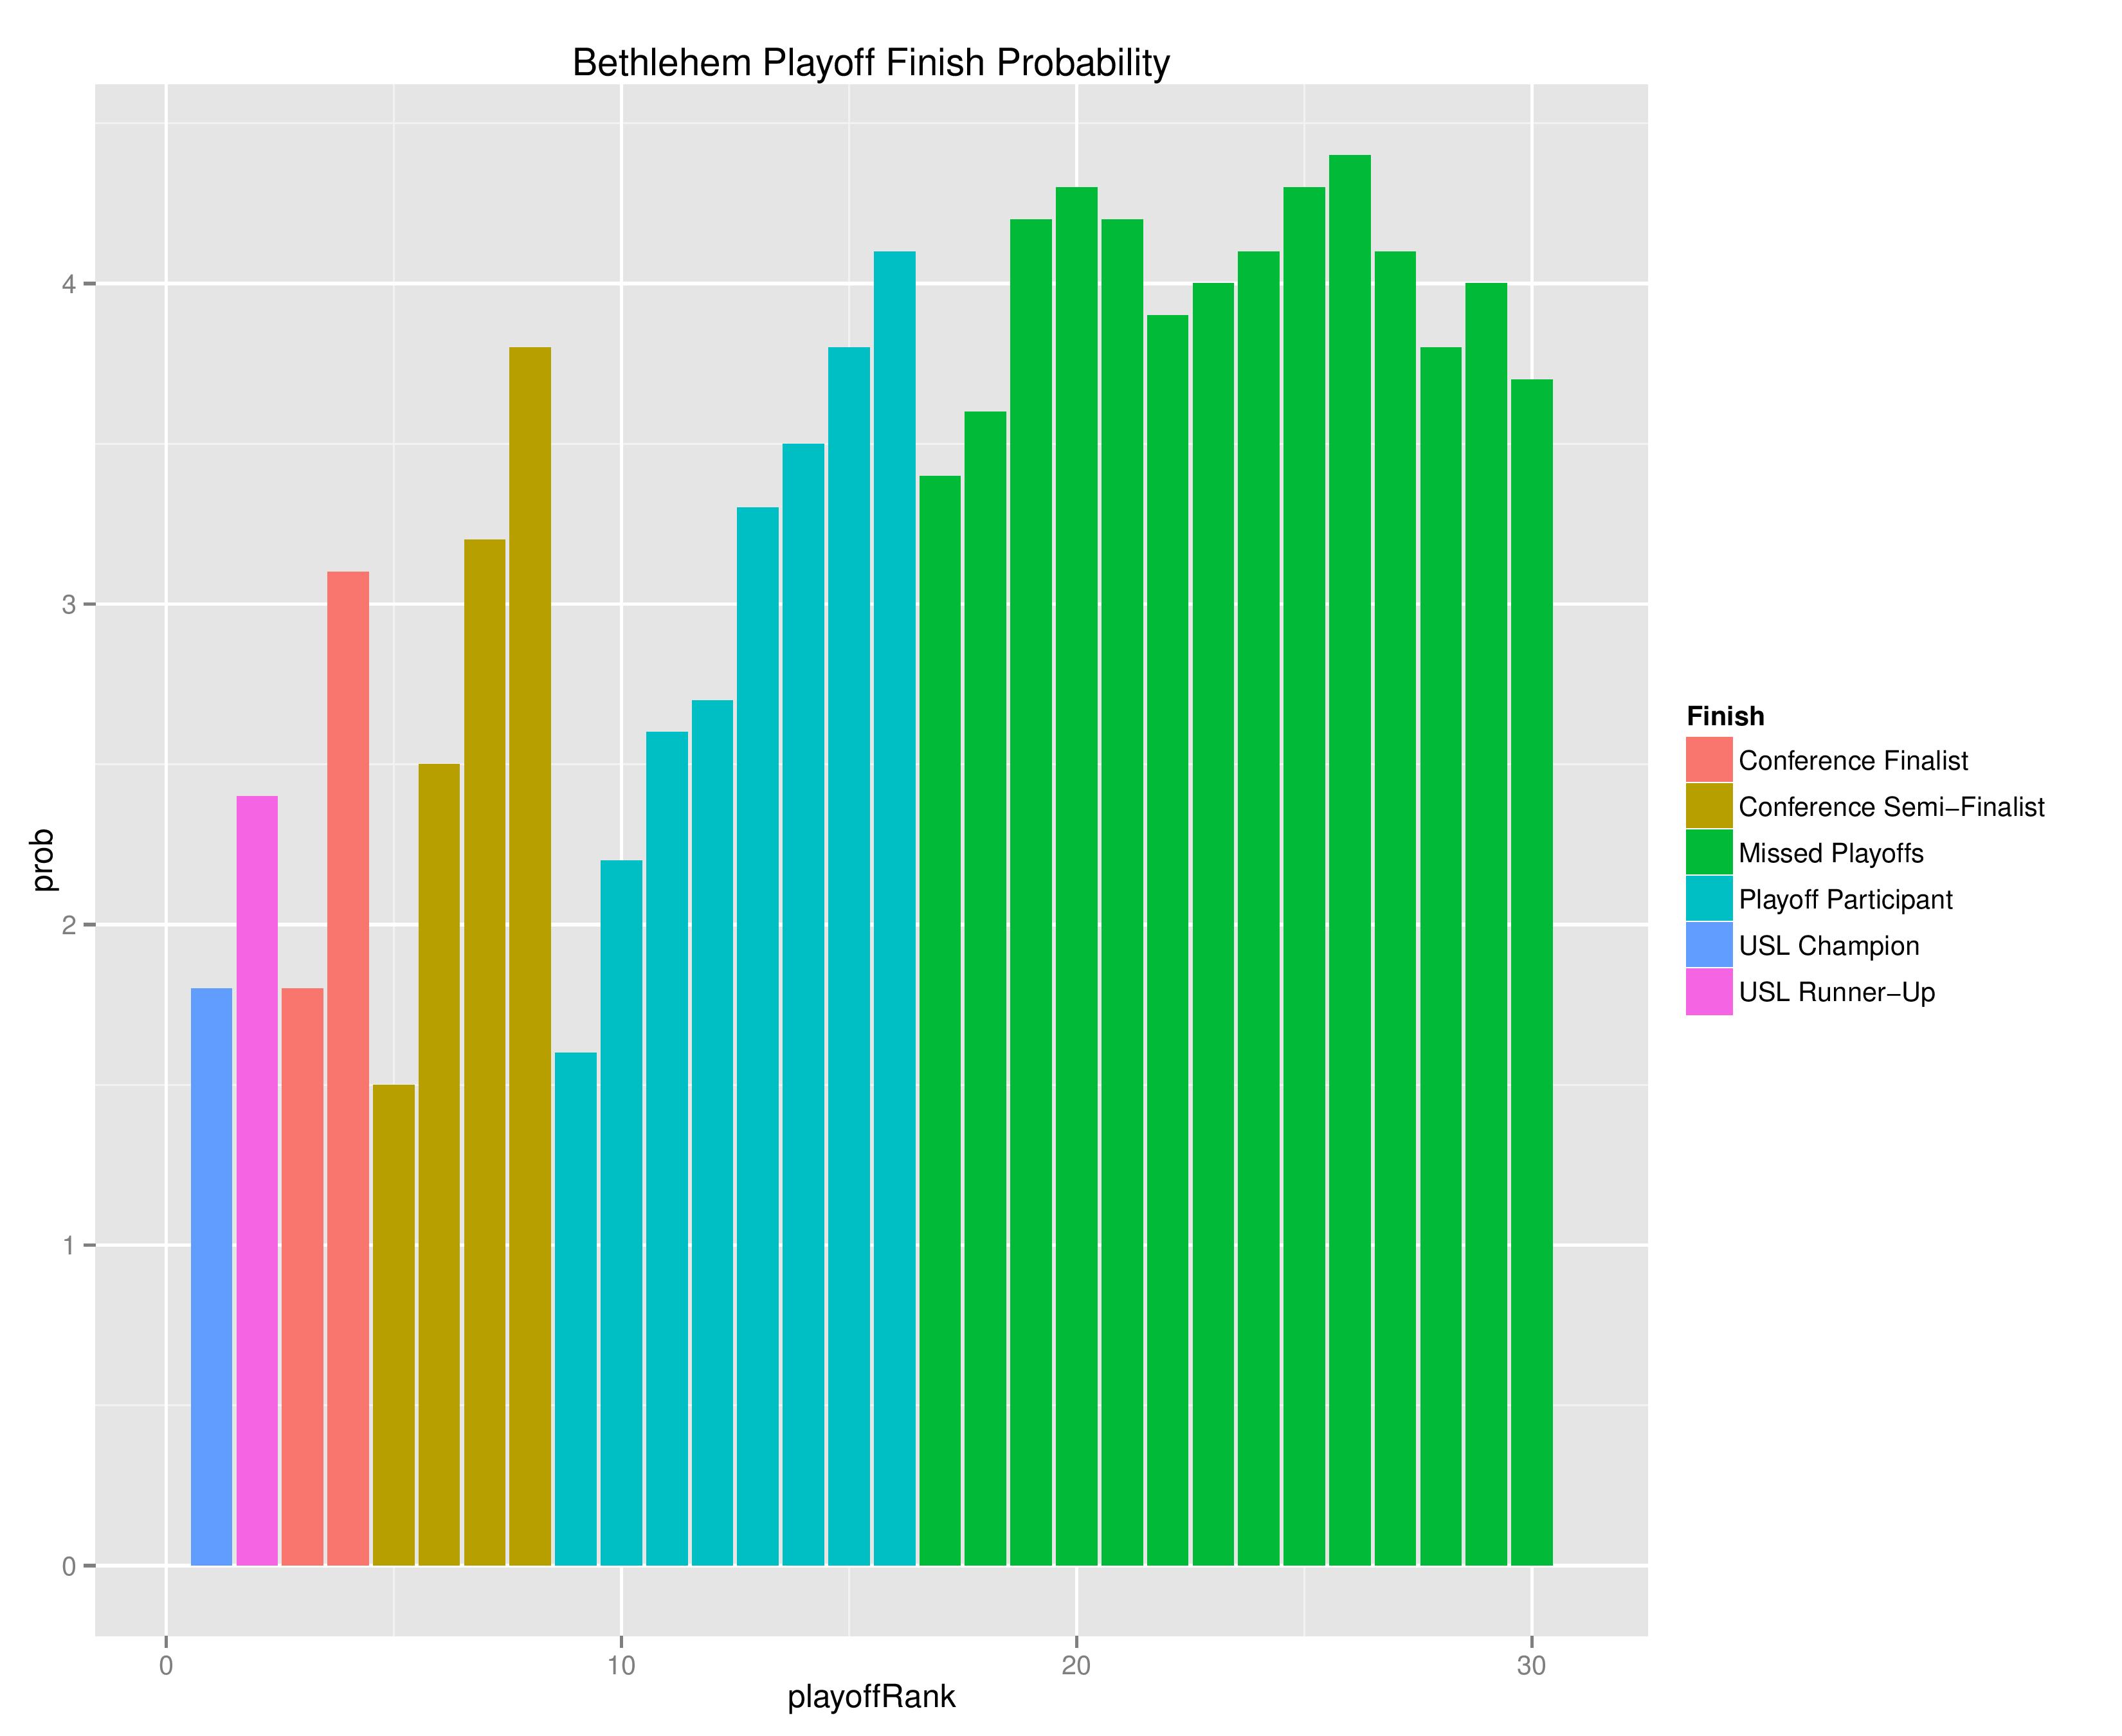
The following shows the probability of each post-playoff ranking finish.

The following shows the summary of the simulations in an easy table format.

As a new feature, we can also show how the Remaining Strength of Schedule affects each team.
The “Points Percentage Advantage” shown on the X-axis represents the percentage of points expected over the league average schedule. This “points expected” value is generated by simulating how all teams would perform with all remaining schedules (and therefore judges a schedule based upon how all teams would perform in that scenario).
In short, the higher the value, the easier the remaining schedule.
Remaining home field advantage will make a large contribution here. It can also be true that a better team has an ‘easier’ schedule simply because they do not have to play themselves. Likewise, a bad team may have a ‘harder’ schedule because they also do not play themselves.
The table following the chart also shares helpful context with these percentages.

Accompanying the advantage percentage in the following table is their current standings rank (right now ties are not properly calculated beyond pts/gd/gf), the remaining home matches, the remaining away matches, the current average points-per-game of future opponents (results-based, not model-based), and the average power ranking of future opponents according to SEBA.
The following shows the expectations for upcoming matches for both Bethlehem and Harrisburg:


NWSL
Having already produced a preseason forecast 2 weeks ago, I’m going to hold off on updated forecasts until after NWSL’s week one has finished (the forecast coming out on 4/19 will contain the next updates).
The SEBA Projection System is an acronym for a tortured collection of words in the Statistical Extrapolation Bayesian Analyzer Projection System. Check out the first season’s post to find out how it works (https://phillysoccerpage.net/2017/03/03/2017-initial-seba-projections/)

Hi Chris, I notice in your chart of probabilities of USL sides winning the USOC that you include Reno as eligible but do not list Rio Grande Valley.
.
Both are “hybrid” affiliates of MLS teams, Reno with San Jose and Rio Grande with Houston, as far as I have noticed.
.
including one but not the other seems odd. I would think either both are ineligible since they are controlled in their technical aspects by the MLS side, or both are eligible, not one is and one is not.
.
But then it is no surprise that soccer governance in the United States be inconsistent.
Good observation, and it was interesting exploring.
–
After some research, it turns out that Rio Grande’s disqualification was actually due to a rule change requested by Houston, themselves. http://www.ussoccer.com/stories/2016/03/28/22/09/160328-usoc-open-cup-committee-adds-new-adjustment-to-policy-regarding-team-eligibility
–
I’m not sure why Reno is eligible, as San Jose controls its technical direction. Maybe not its roster and gameday-lineup construbtion.
–
Initially, the rule was based upon the ownership of the lower-level club by a higher-level one, but it was changed at Houston’s request to include lower-level clubs whose roster is managed by the higher-level club.
–
As I remember it, the purpose of the rule was to prevent a dilution of talent in the USL entrance of the competition. For example, if Bethlehem played, the Union might not allow, for example, Austin Trusty or John McCarthy to play and become cup-tied to Bethlehem if Philadelphia feared they might need one of them in the later rounds of the tournament. Bethlehem, and other affiliated USL clubs, would probably be playing without a handful of its starters then, therefore diluting their competition.
I used to like these but they have gotten so depressing. Any chance you can run next week’s simulation with Messi playing at the number 10 for the Union?
.
Thanks as always for sharing.