Below are the updated season forecasts using data from games through April 2, 2017.
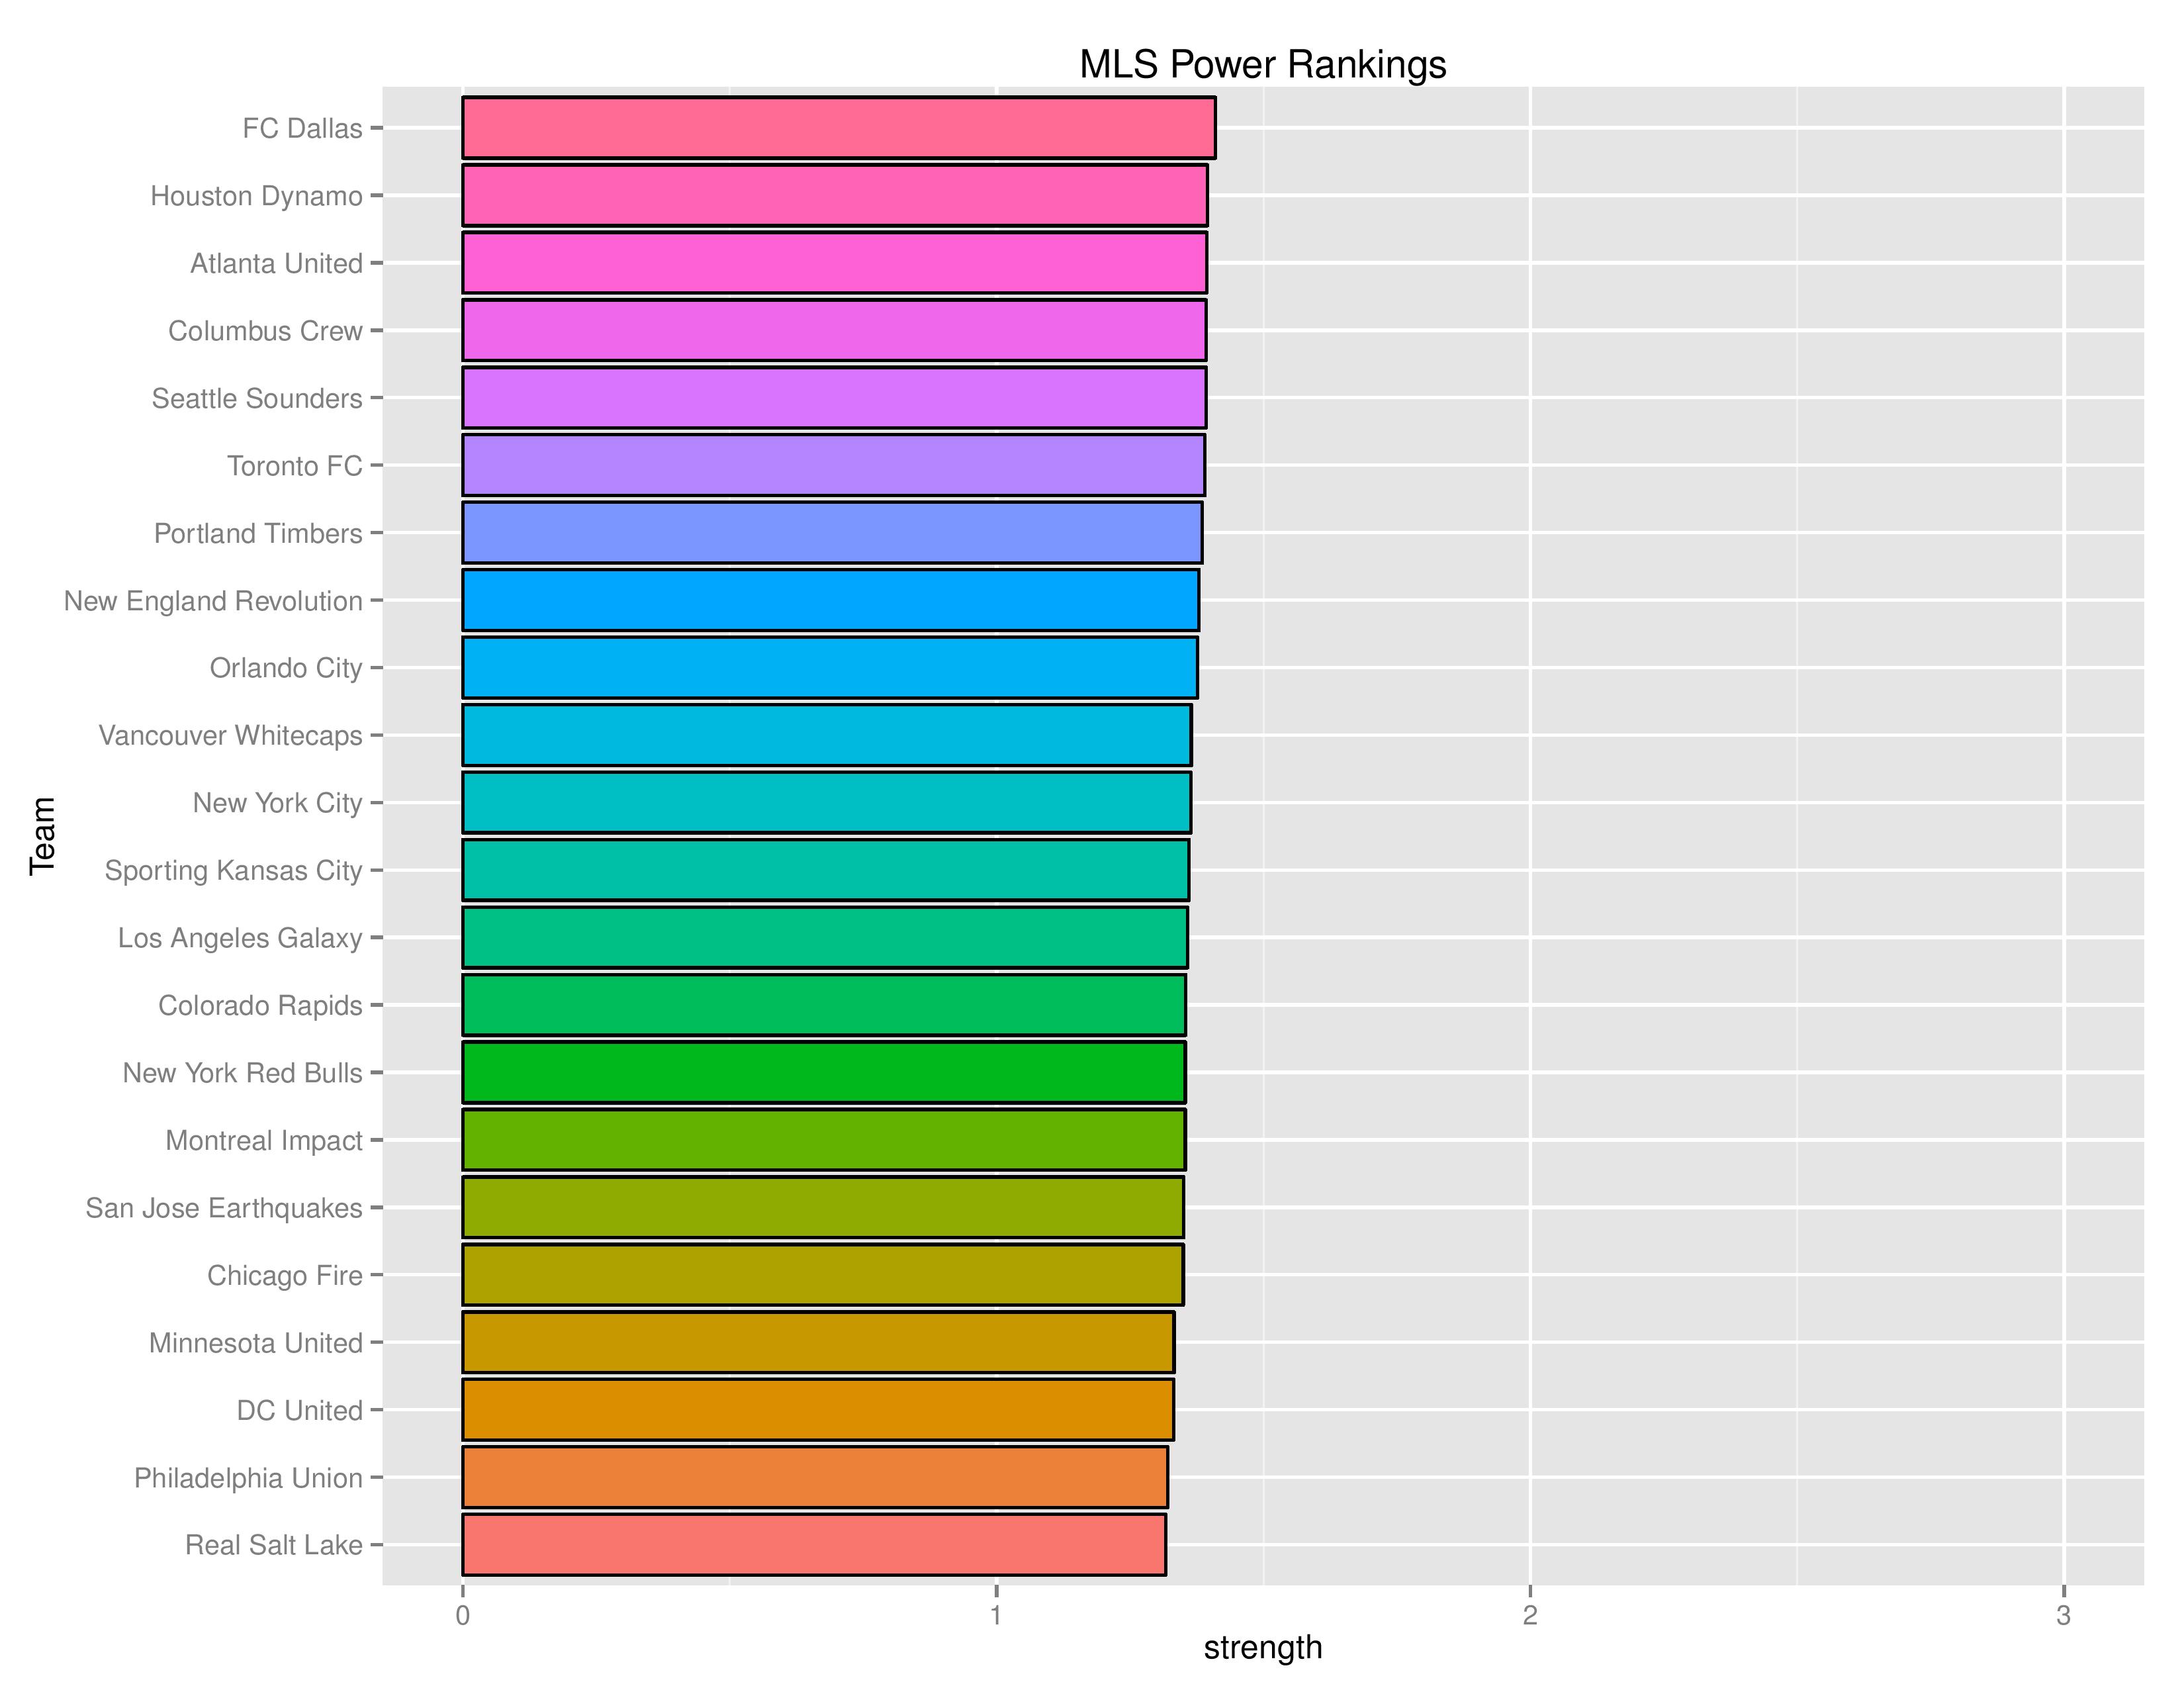
Power Rankings
The “Power Rankings” we concoct are the “strength” of the team according to its competitive expectations. They are computed by forecasting the expected points (3 x win-probability + 1 x draw-probability) against every MLS team, both home and away, and taking the average per team.
SEBA has the Union drop from 19th to 21st. ESPN also has Philadelphia ranked 21st.
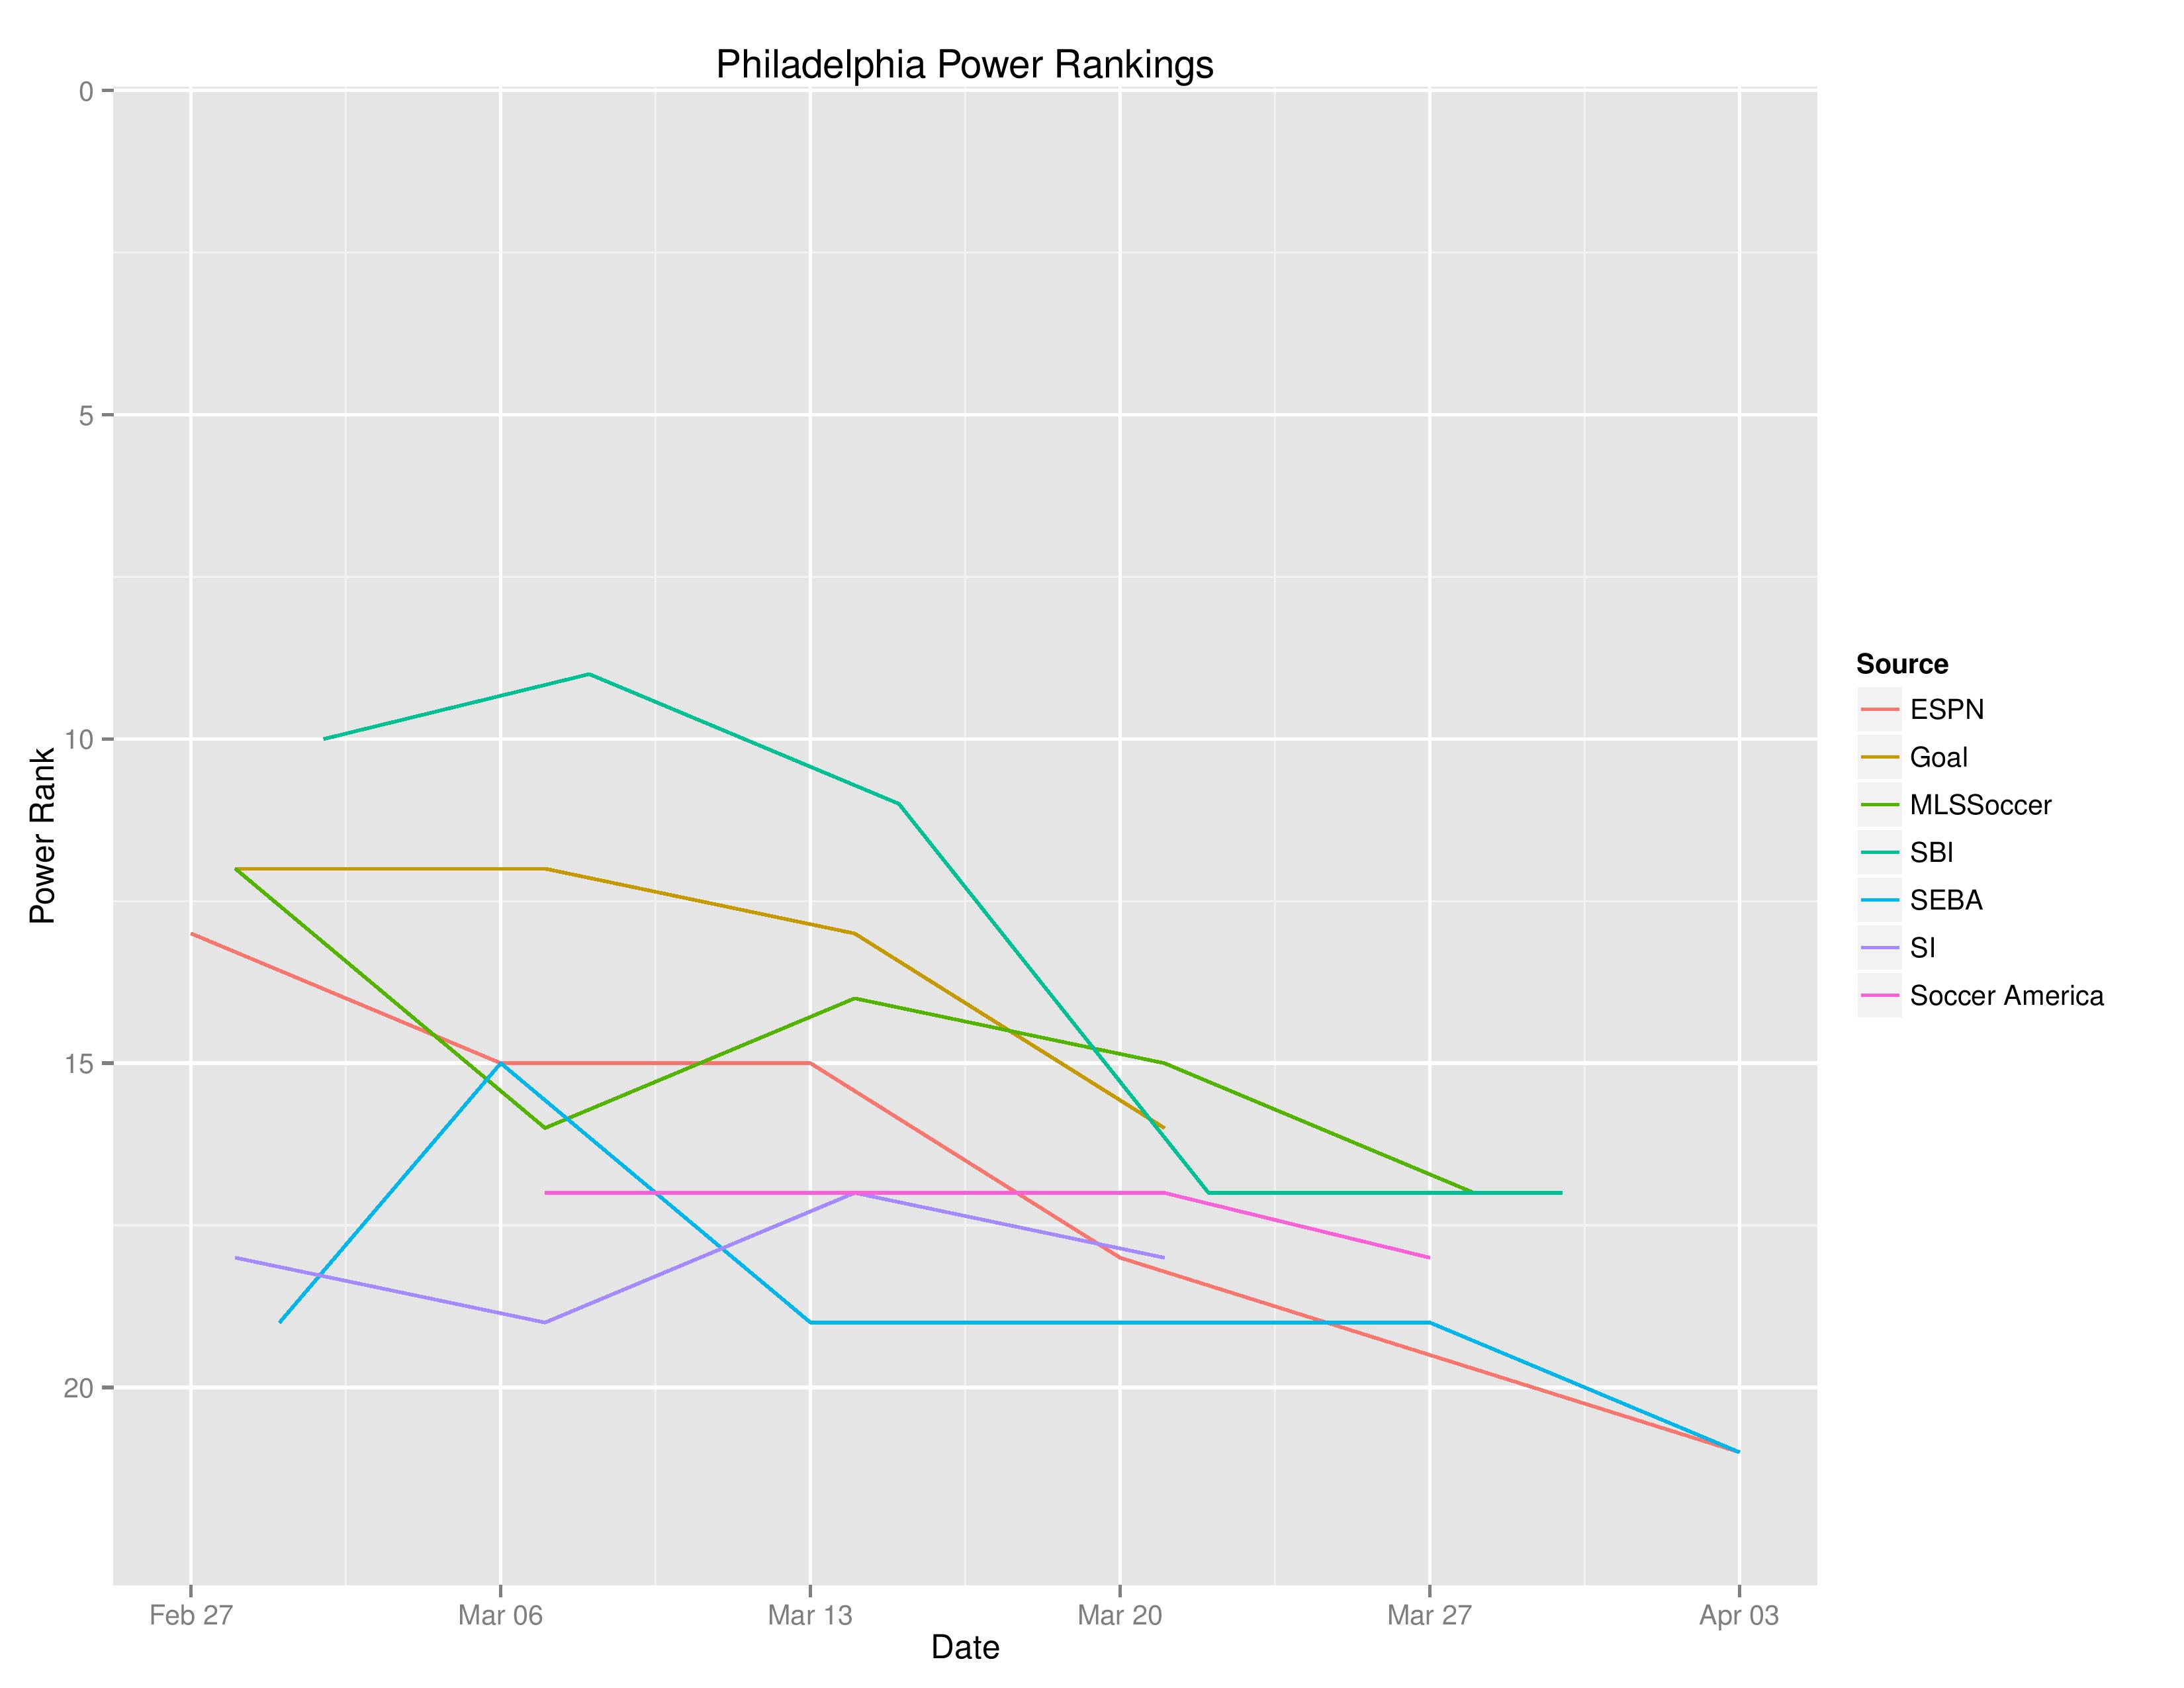
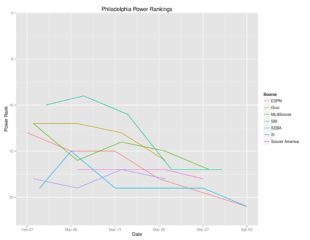
The following shows the evolution of SEBA’s power rankings for the MLS East over time.

Playoffs probability and more
Philadelphia’s playoffs odds have declined from 33.8% to 30.5%.

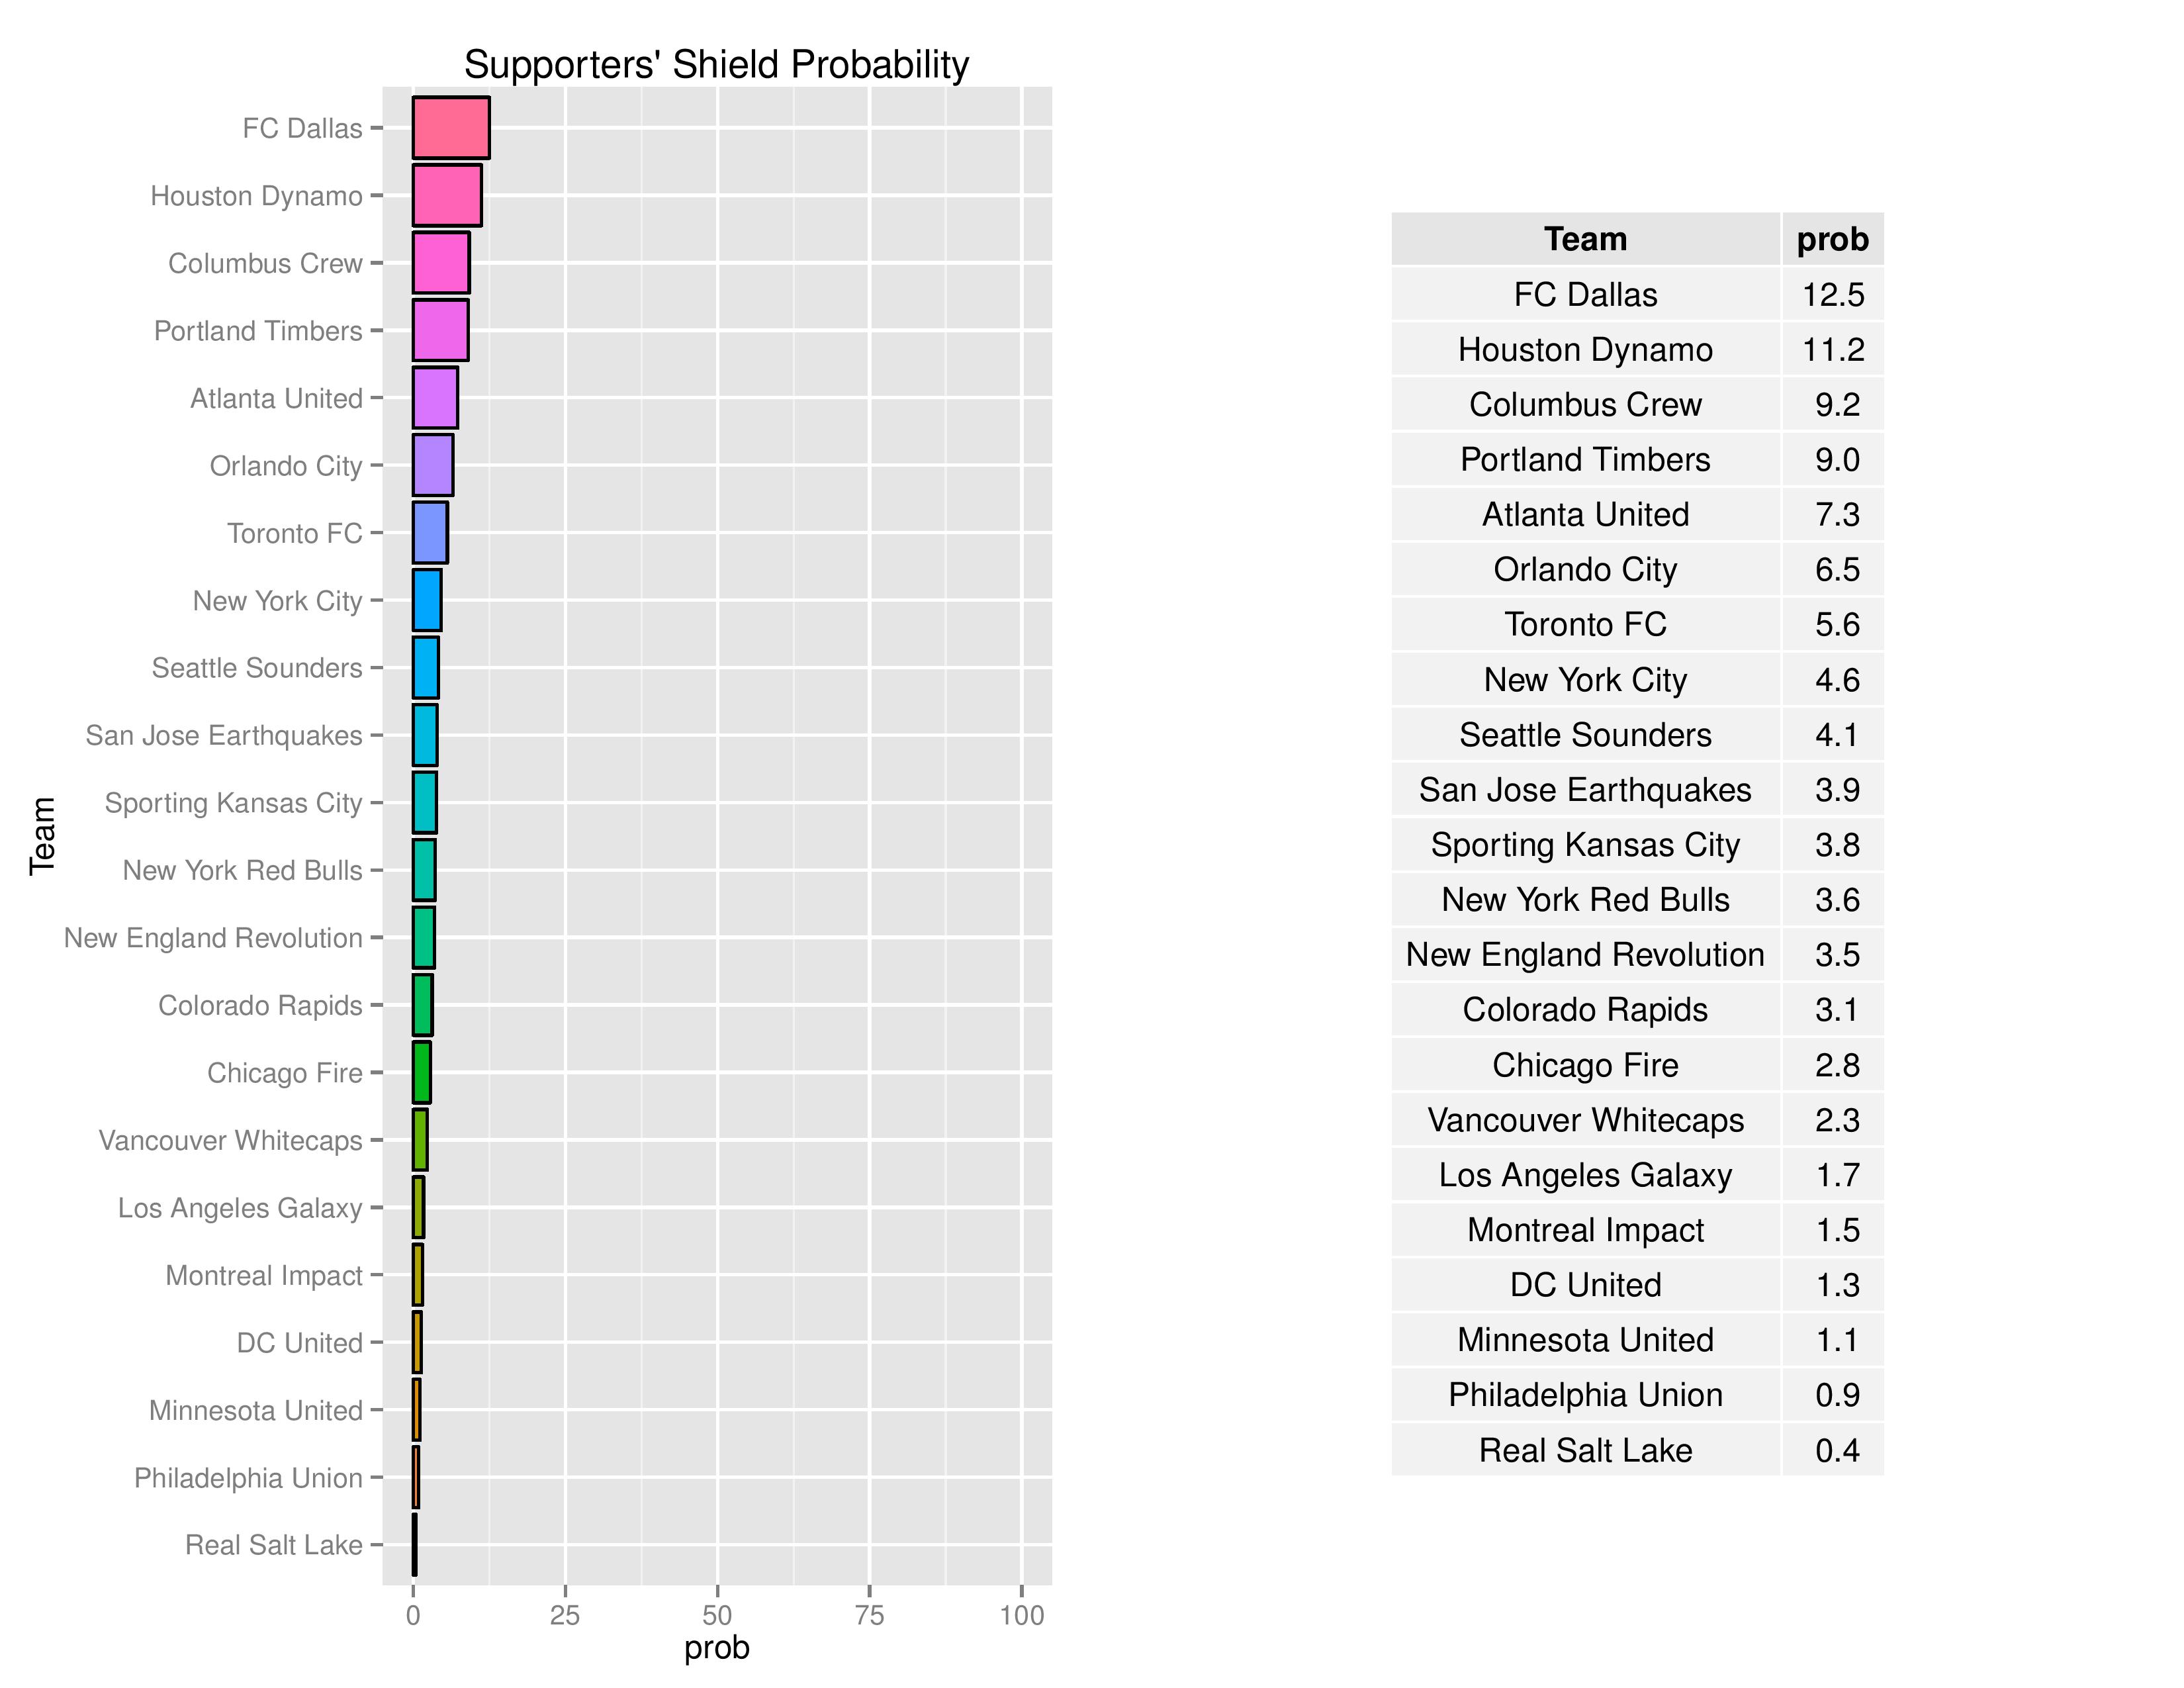
Philadelphia’s odds to win the Supporters’ Shield have declined from 1.1% to 0.9%.
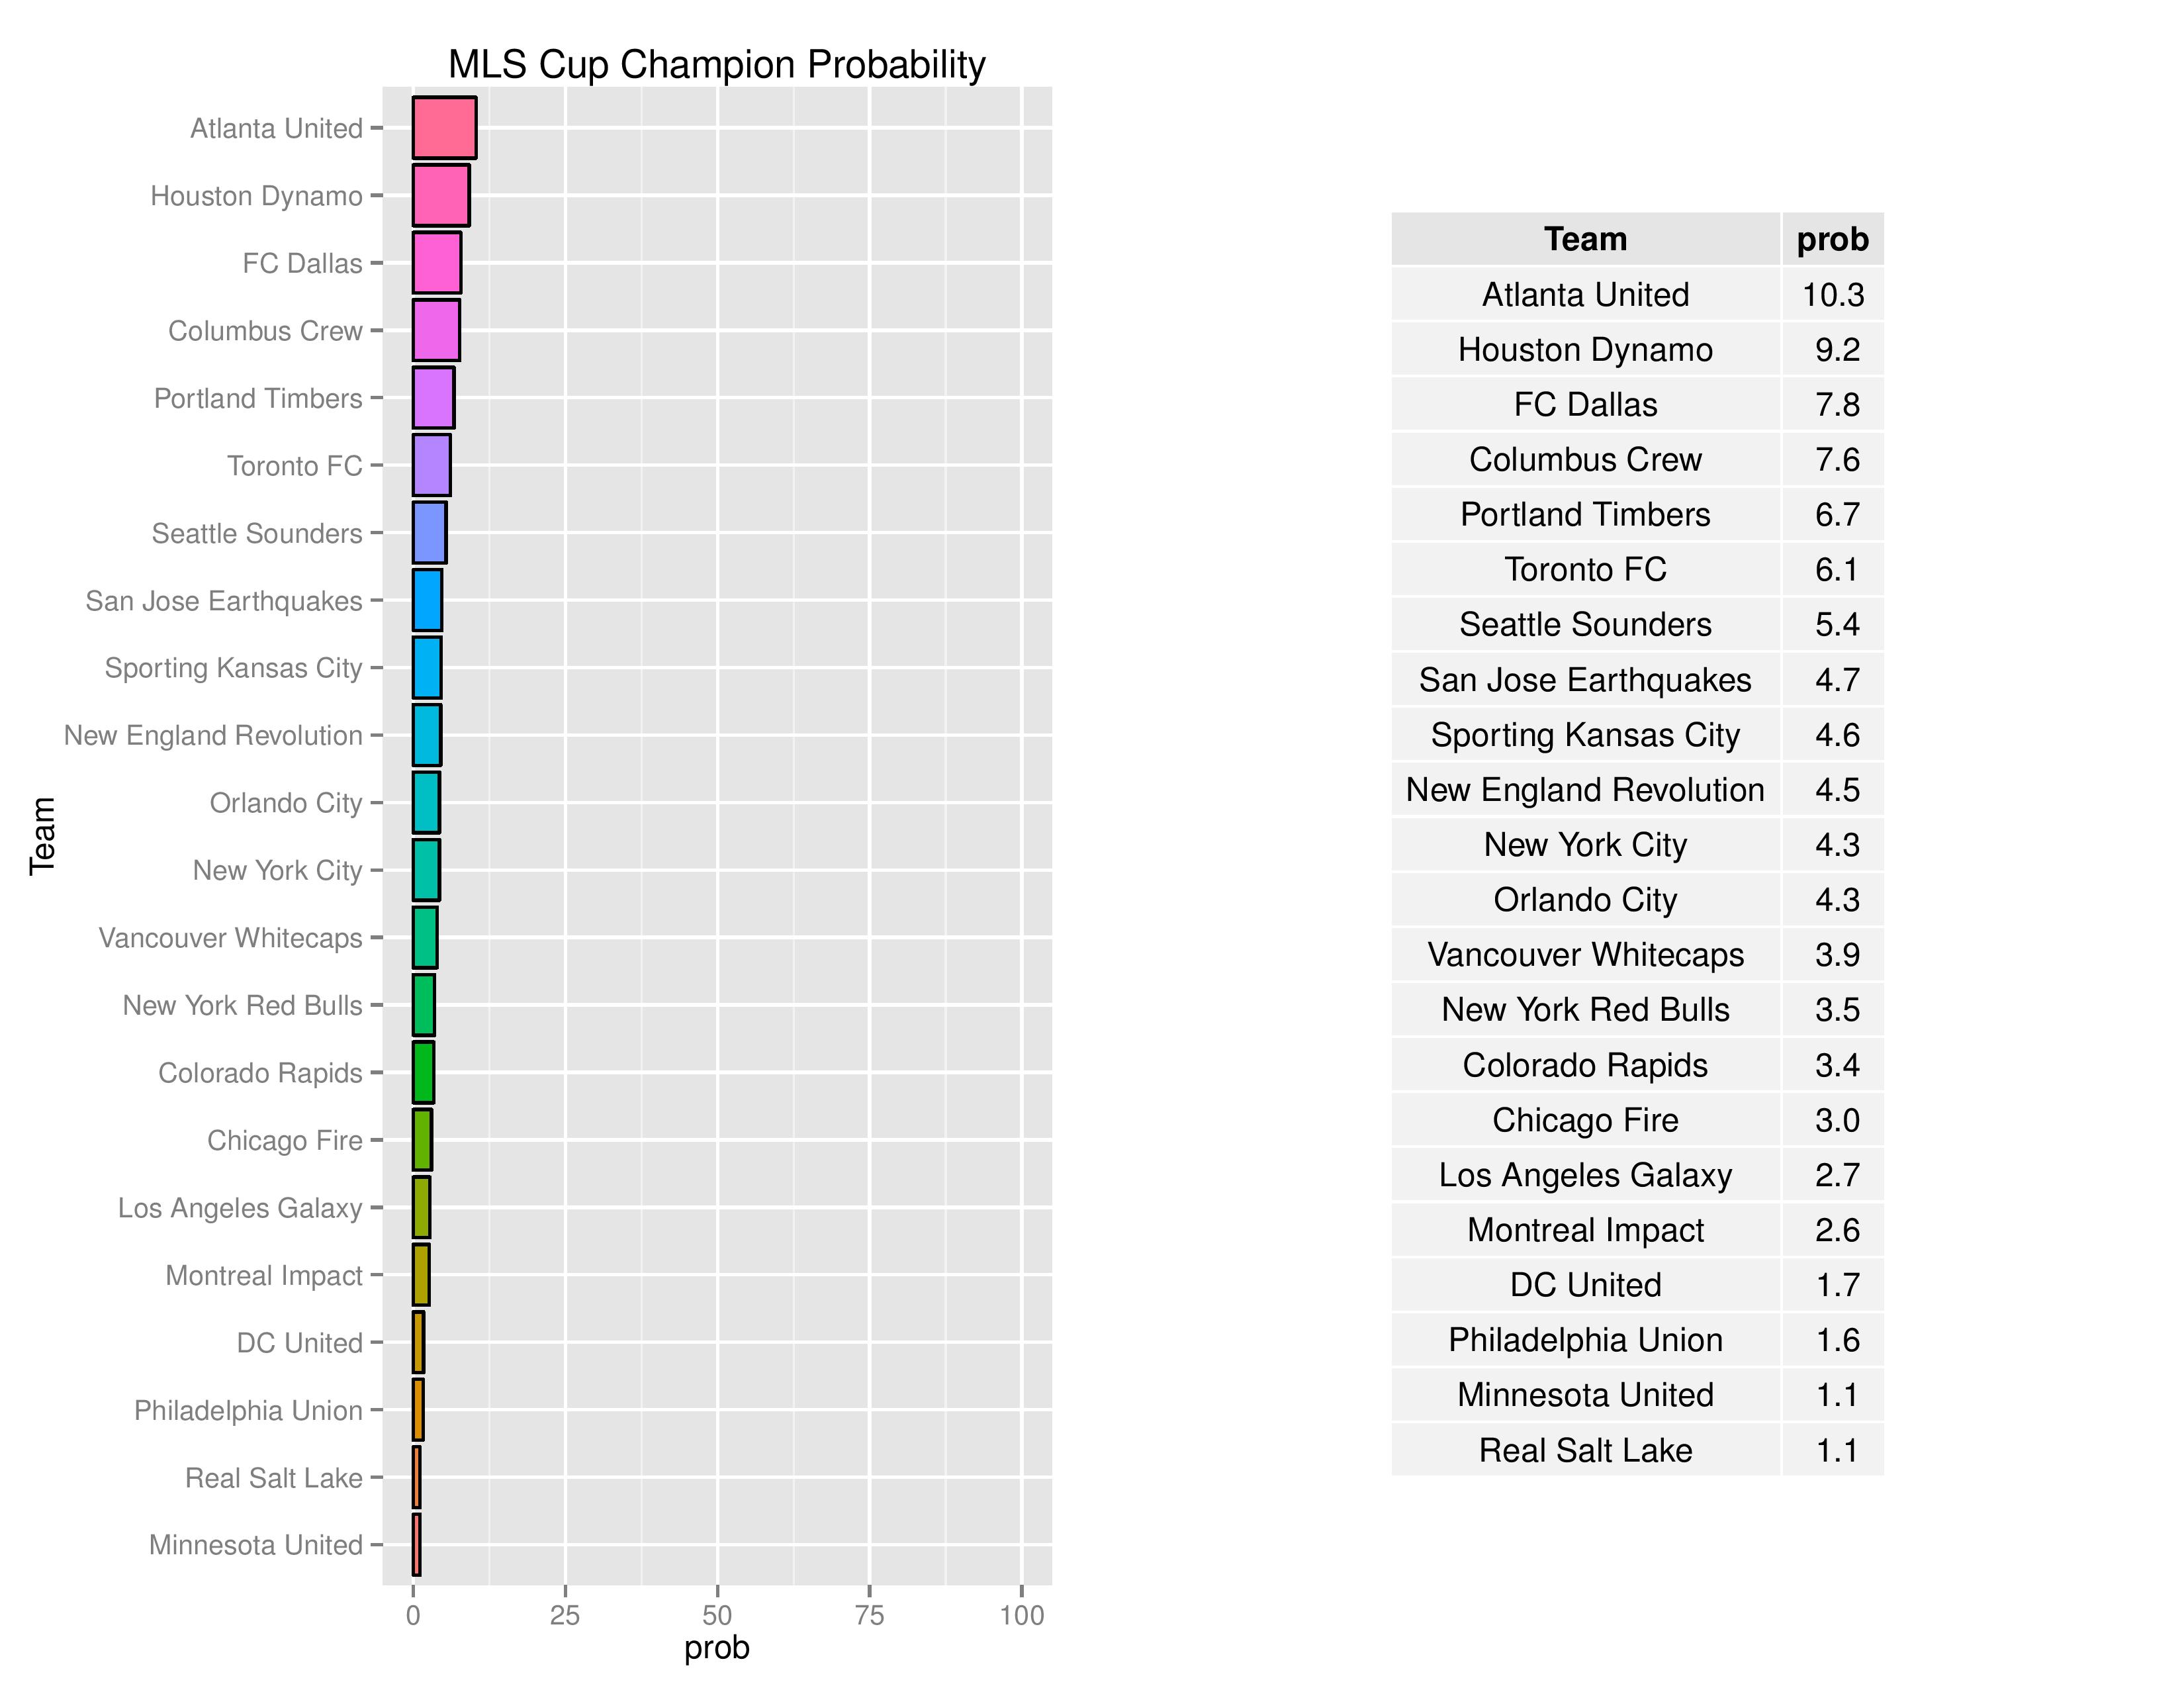
The Union’s chances of winning the MLS Cup have increased slightly from 1.5% to 1.6% from the last published forecast.
In part, clubs which have been obtaining large values for Goal Differential thus far are given an advantage in MLS Cup due to the 2-leg aggregate goal format of the conference semi-finals and conference finals. Atlanta is probably not likely to sustain as high a pattern of goal-scoring as they have been and therefore, their odds should decrease even if their power ranking remains the same.
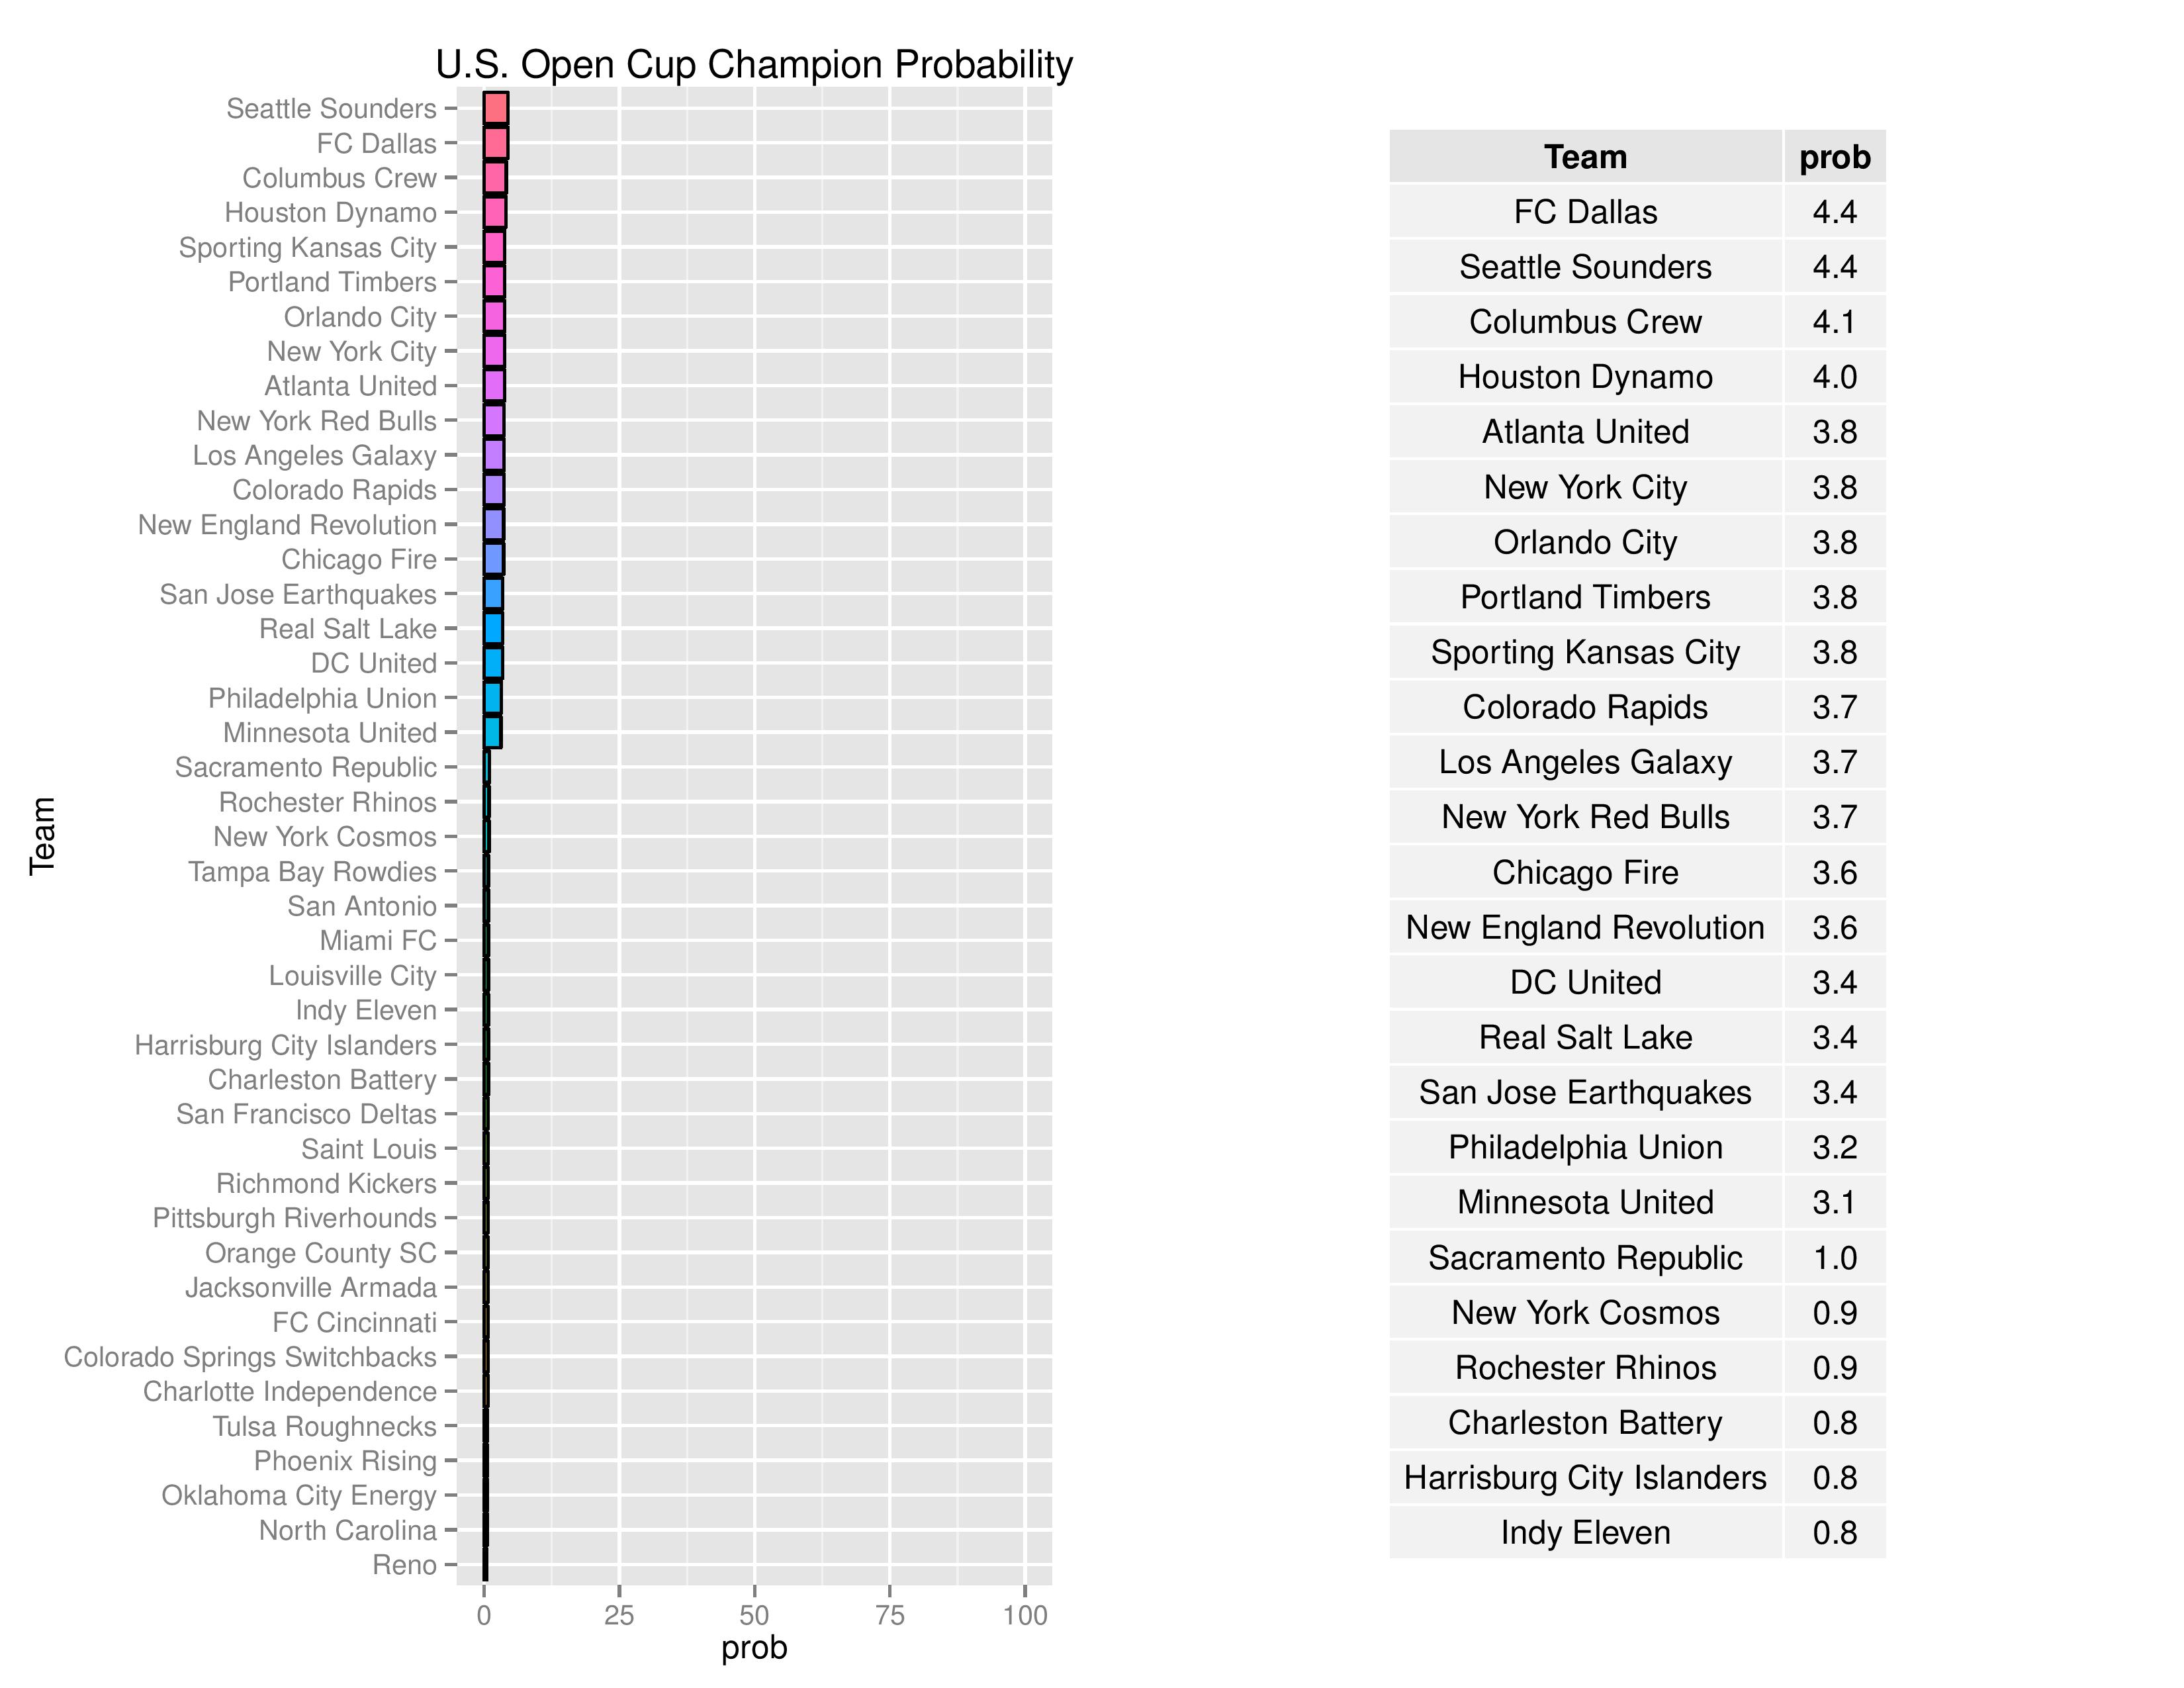
Philadelphia’s odds of winning the U.S. Open Cup have declined from 3.6% to 3.2%.
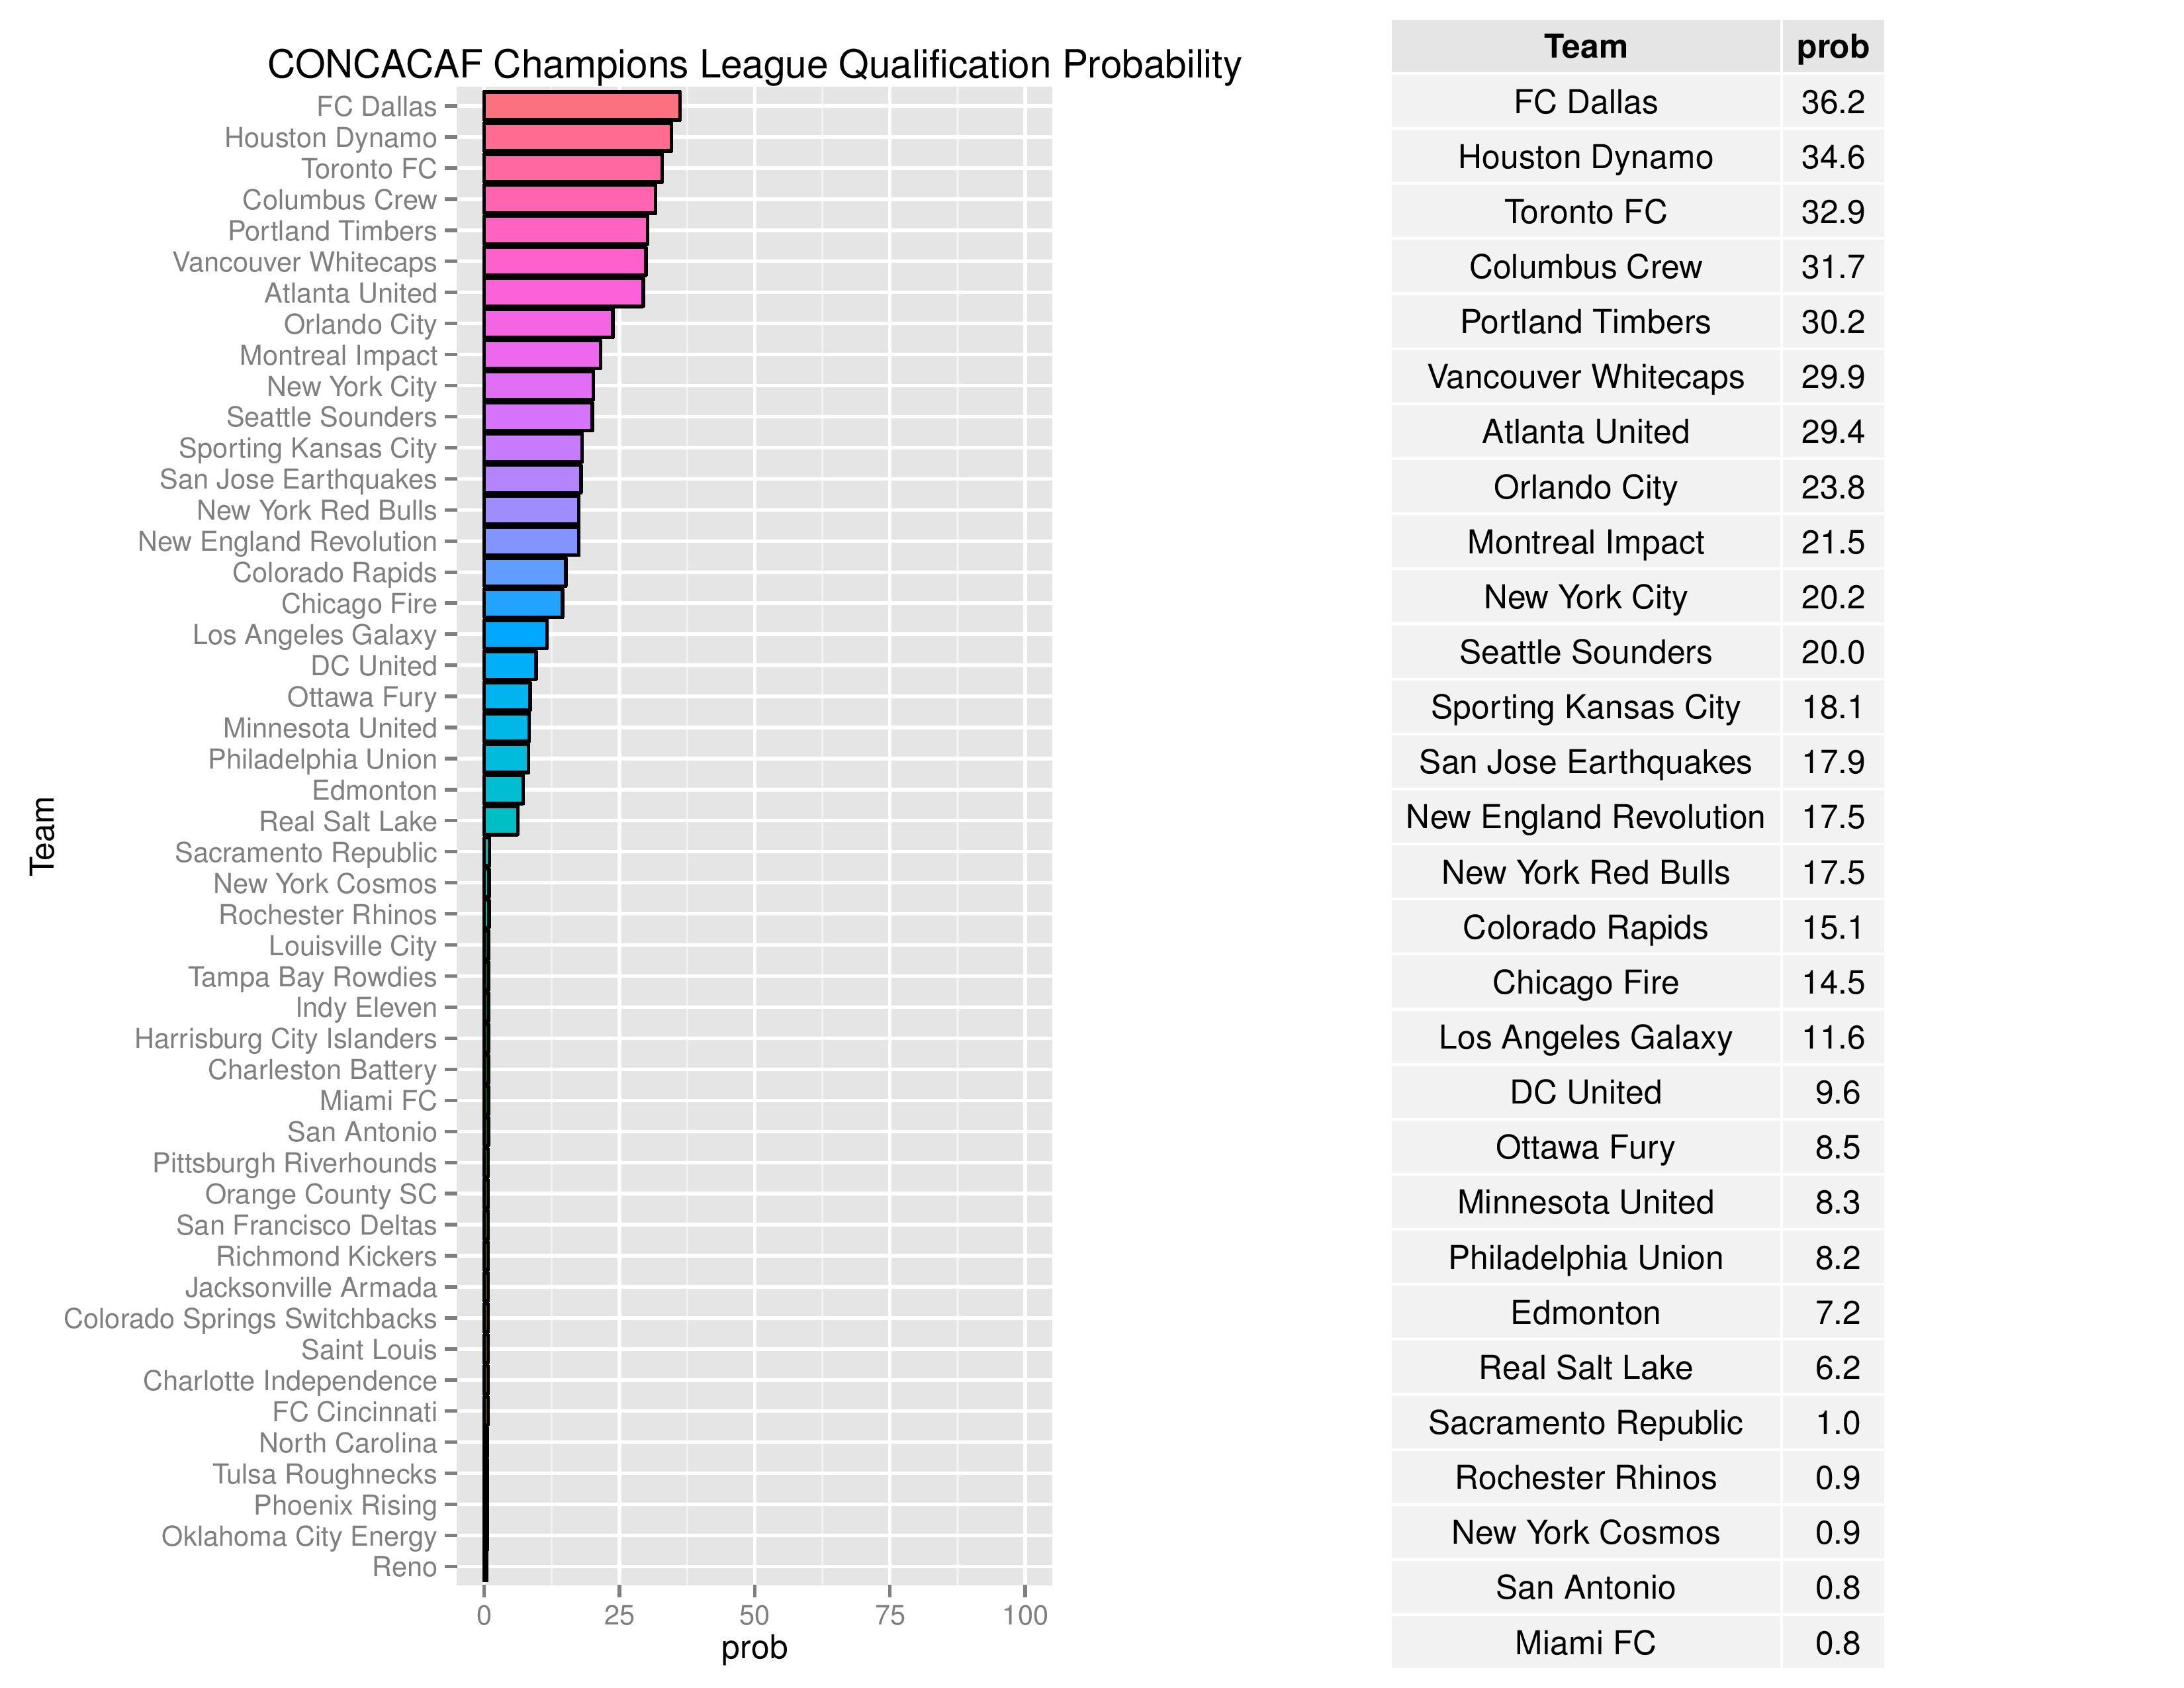
Philadelphia’s chances for qualifying for the 2018-2019 edition of the CONCACAF Champions League have dropped from 8.7% to 8.2%.
Over time, we can see how Philadelphia’s odds for different prizes have changed.
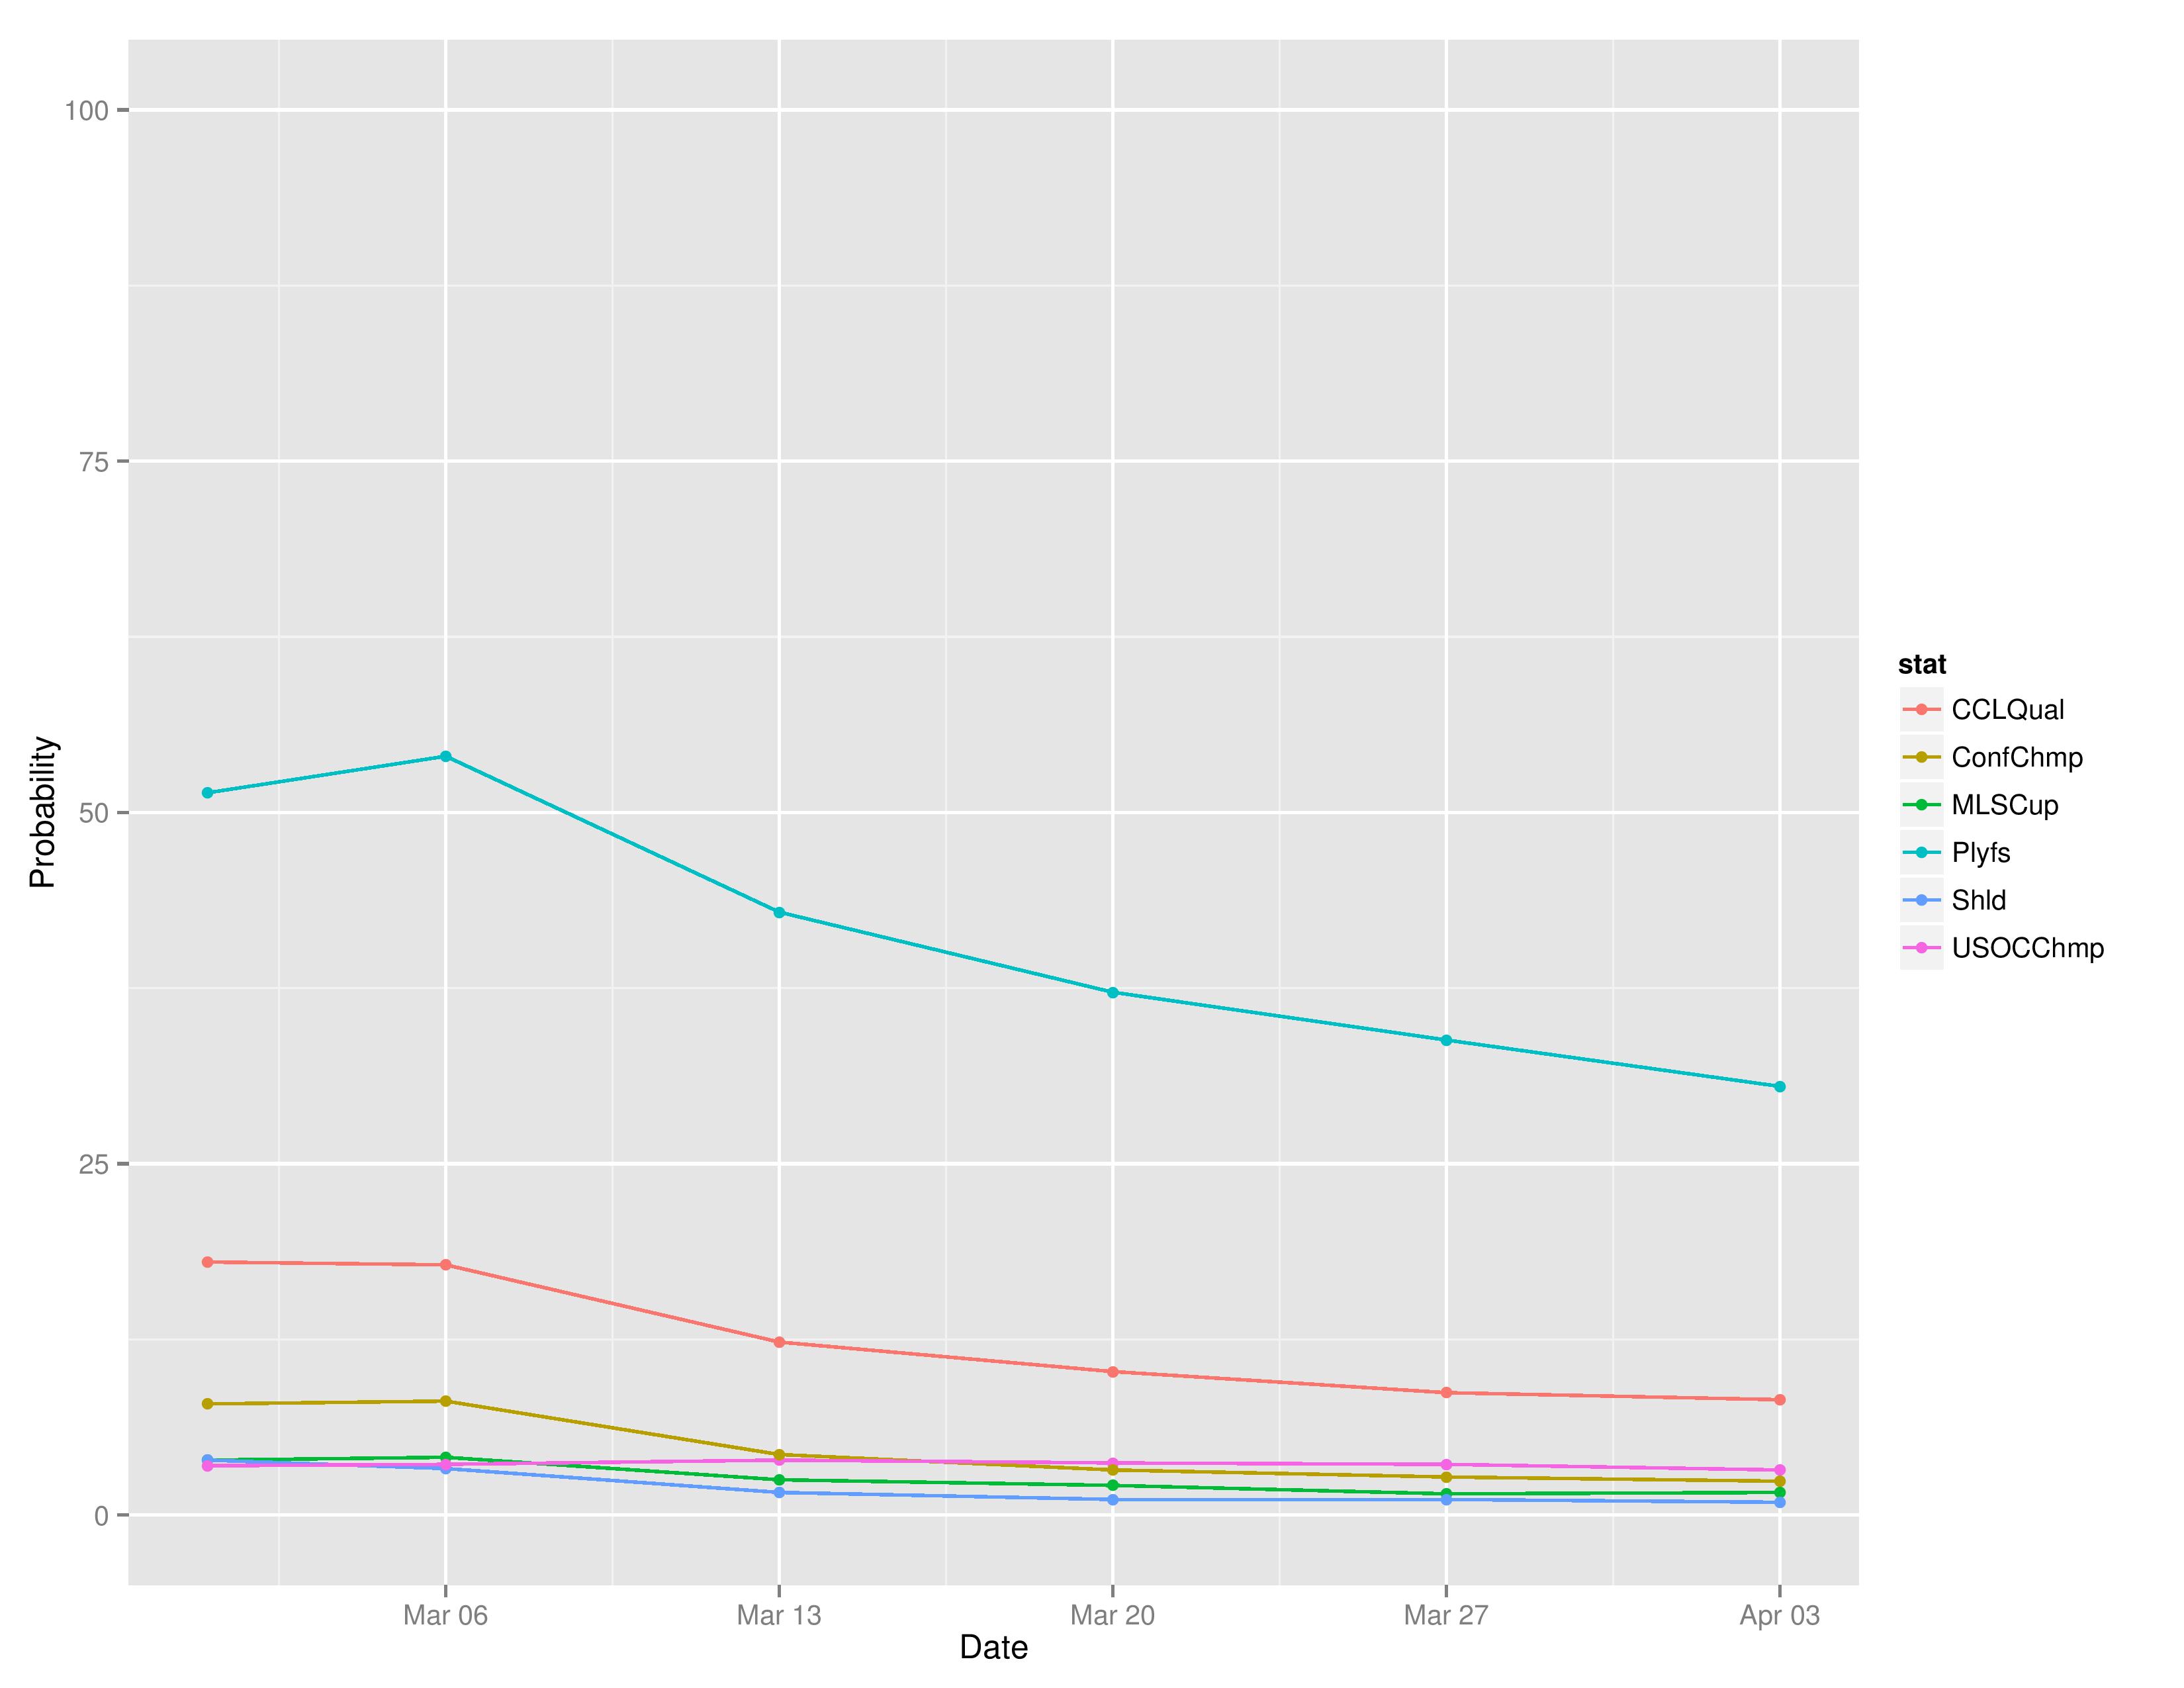
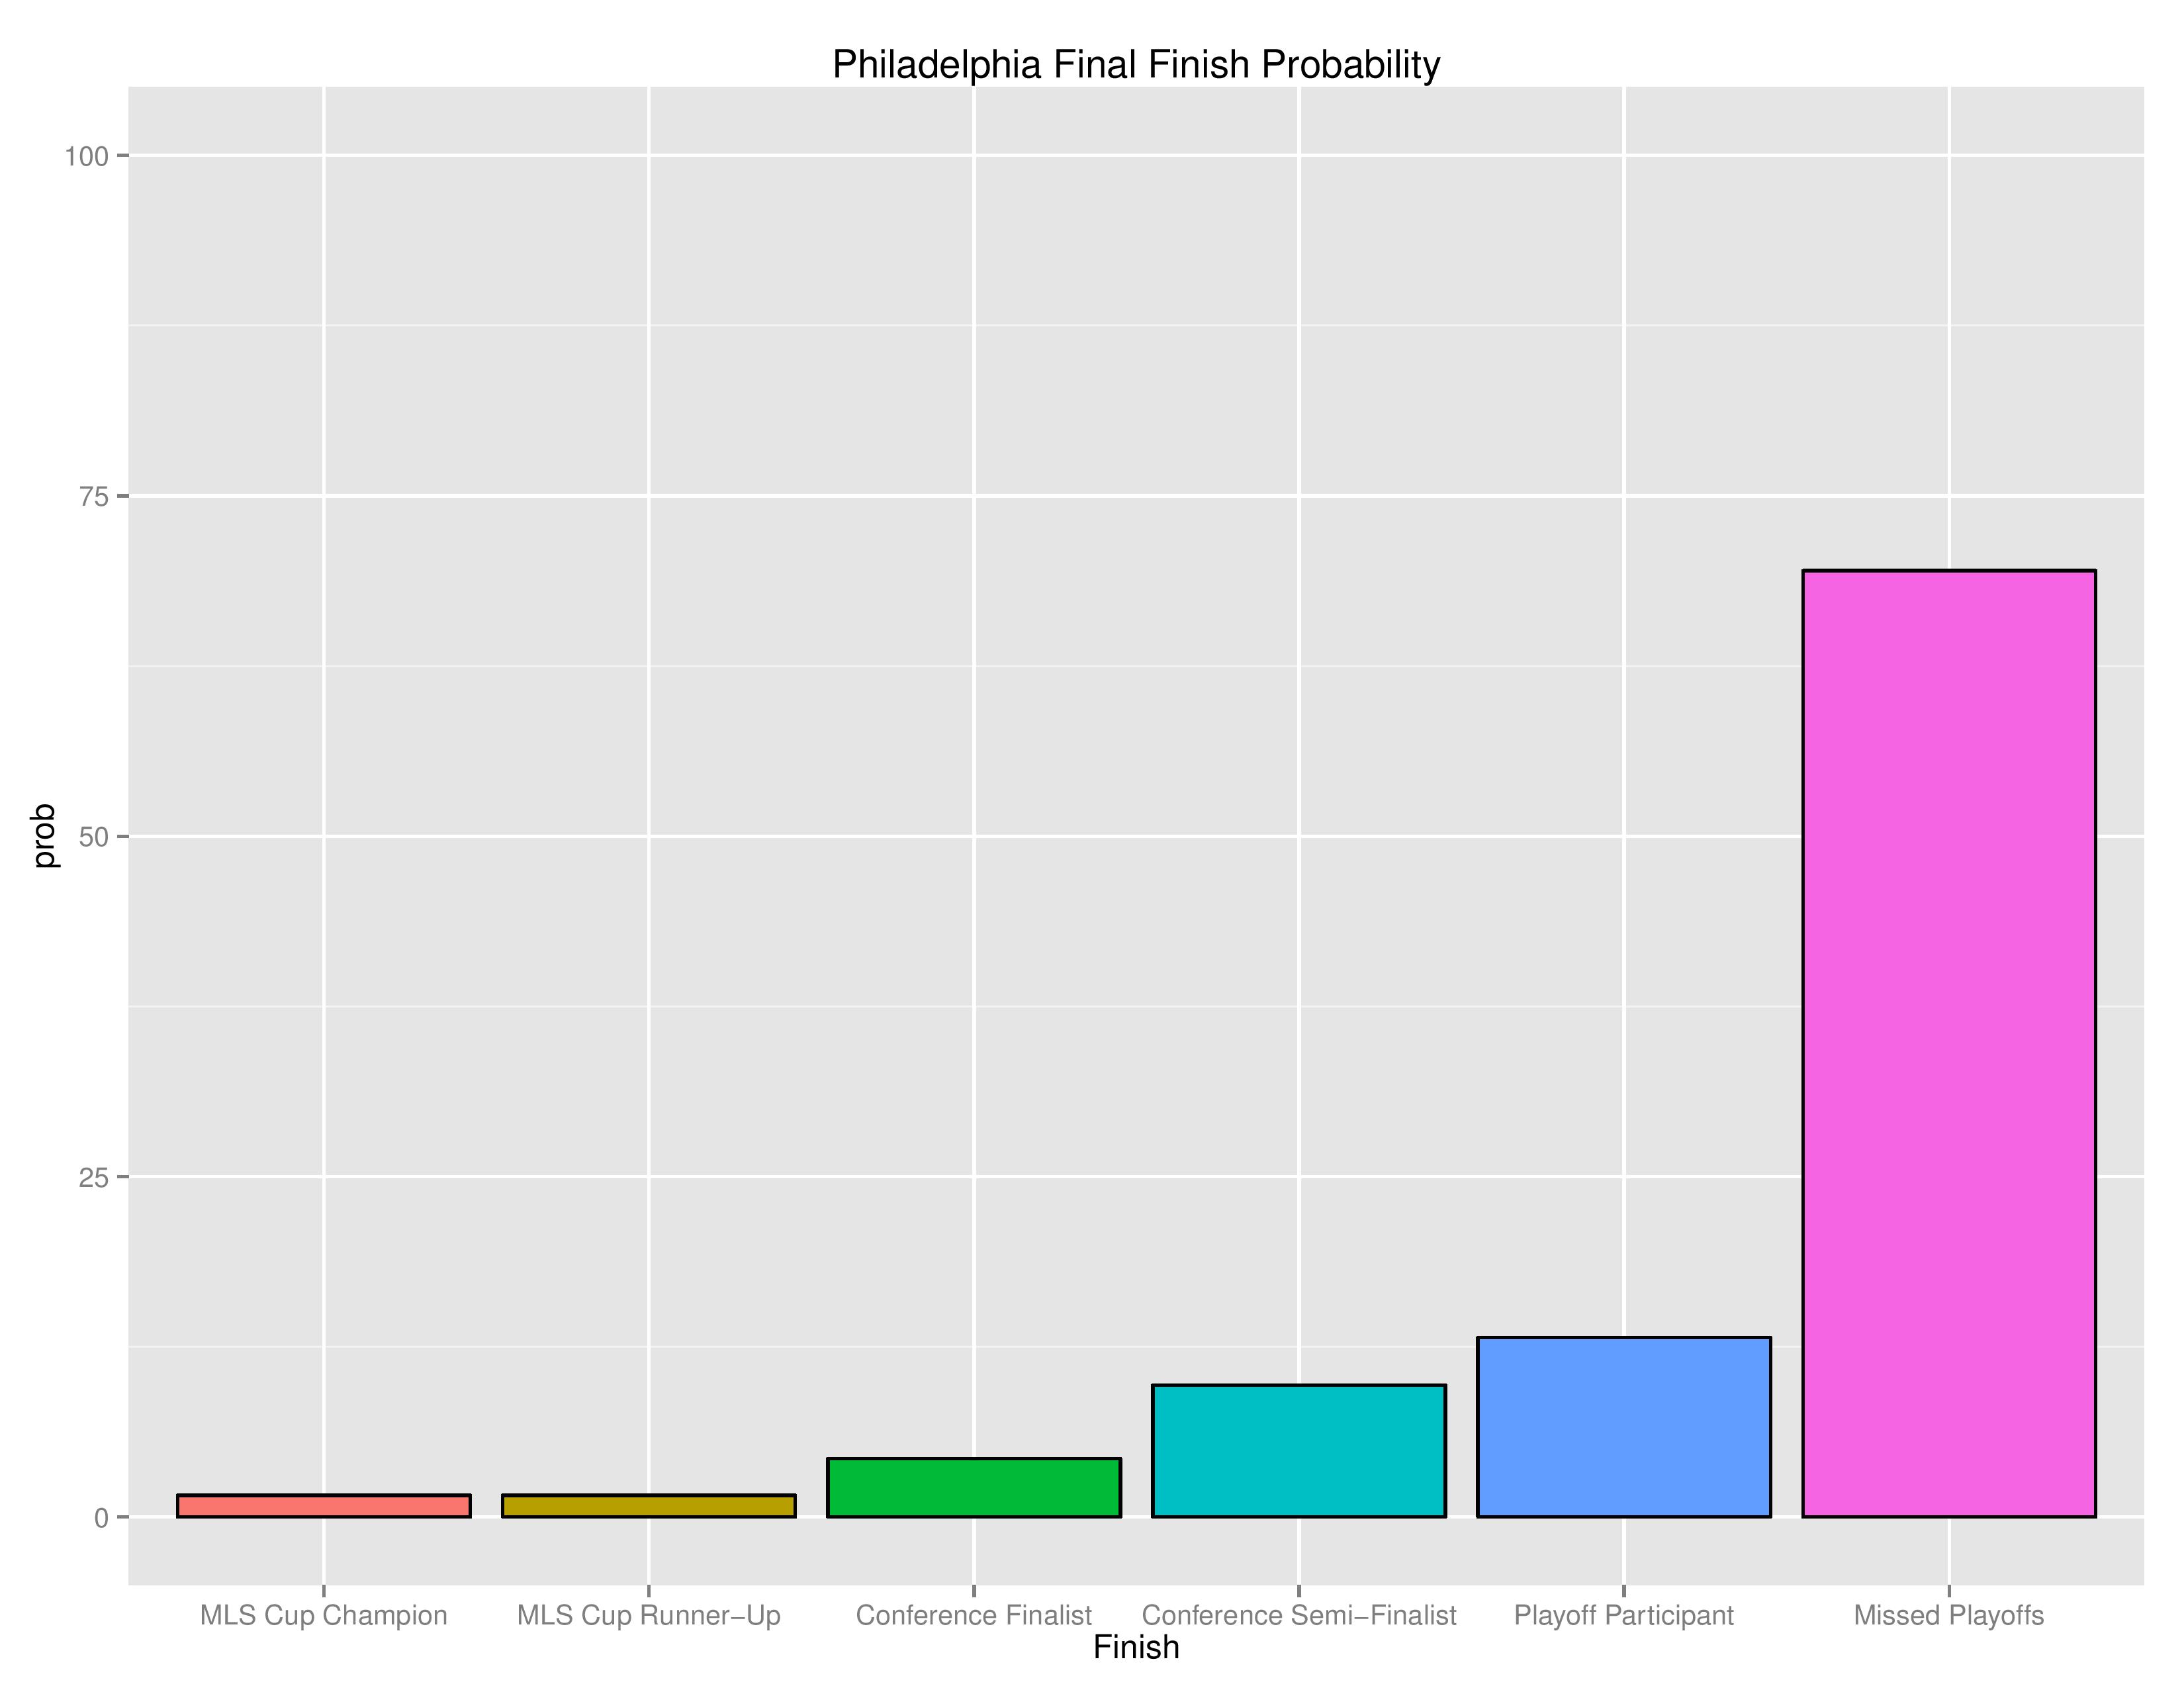
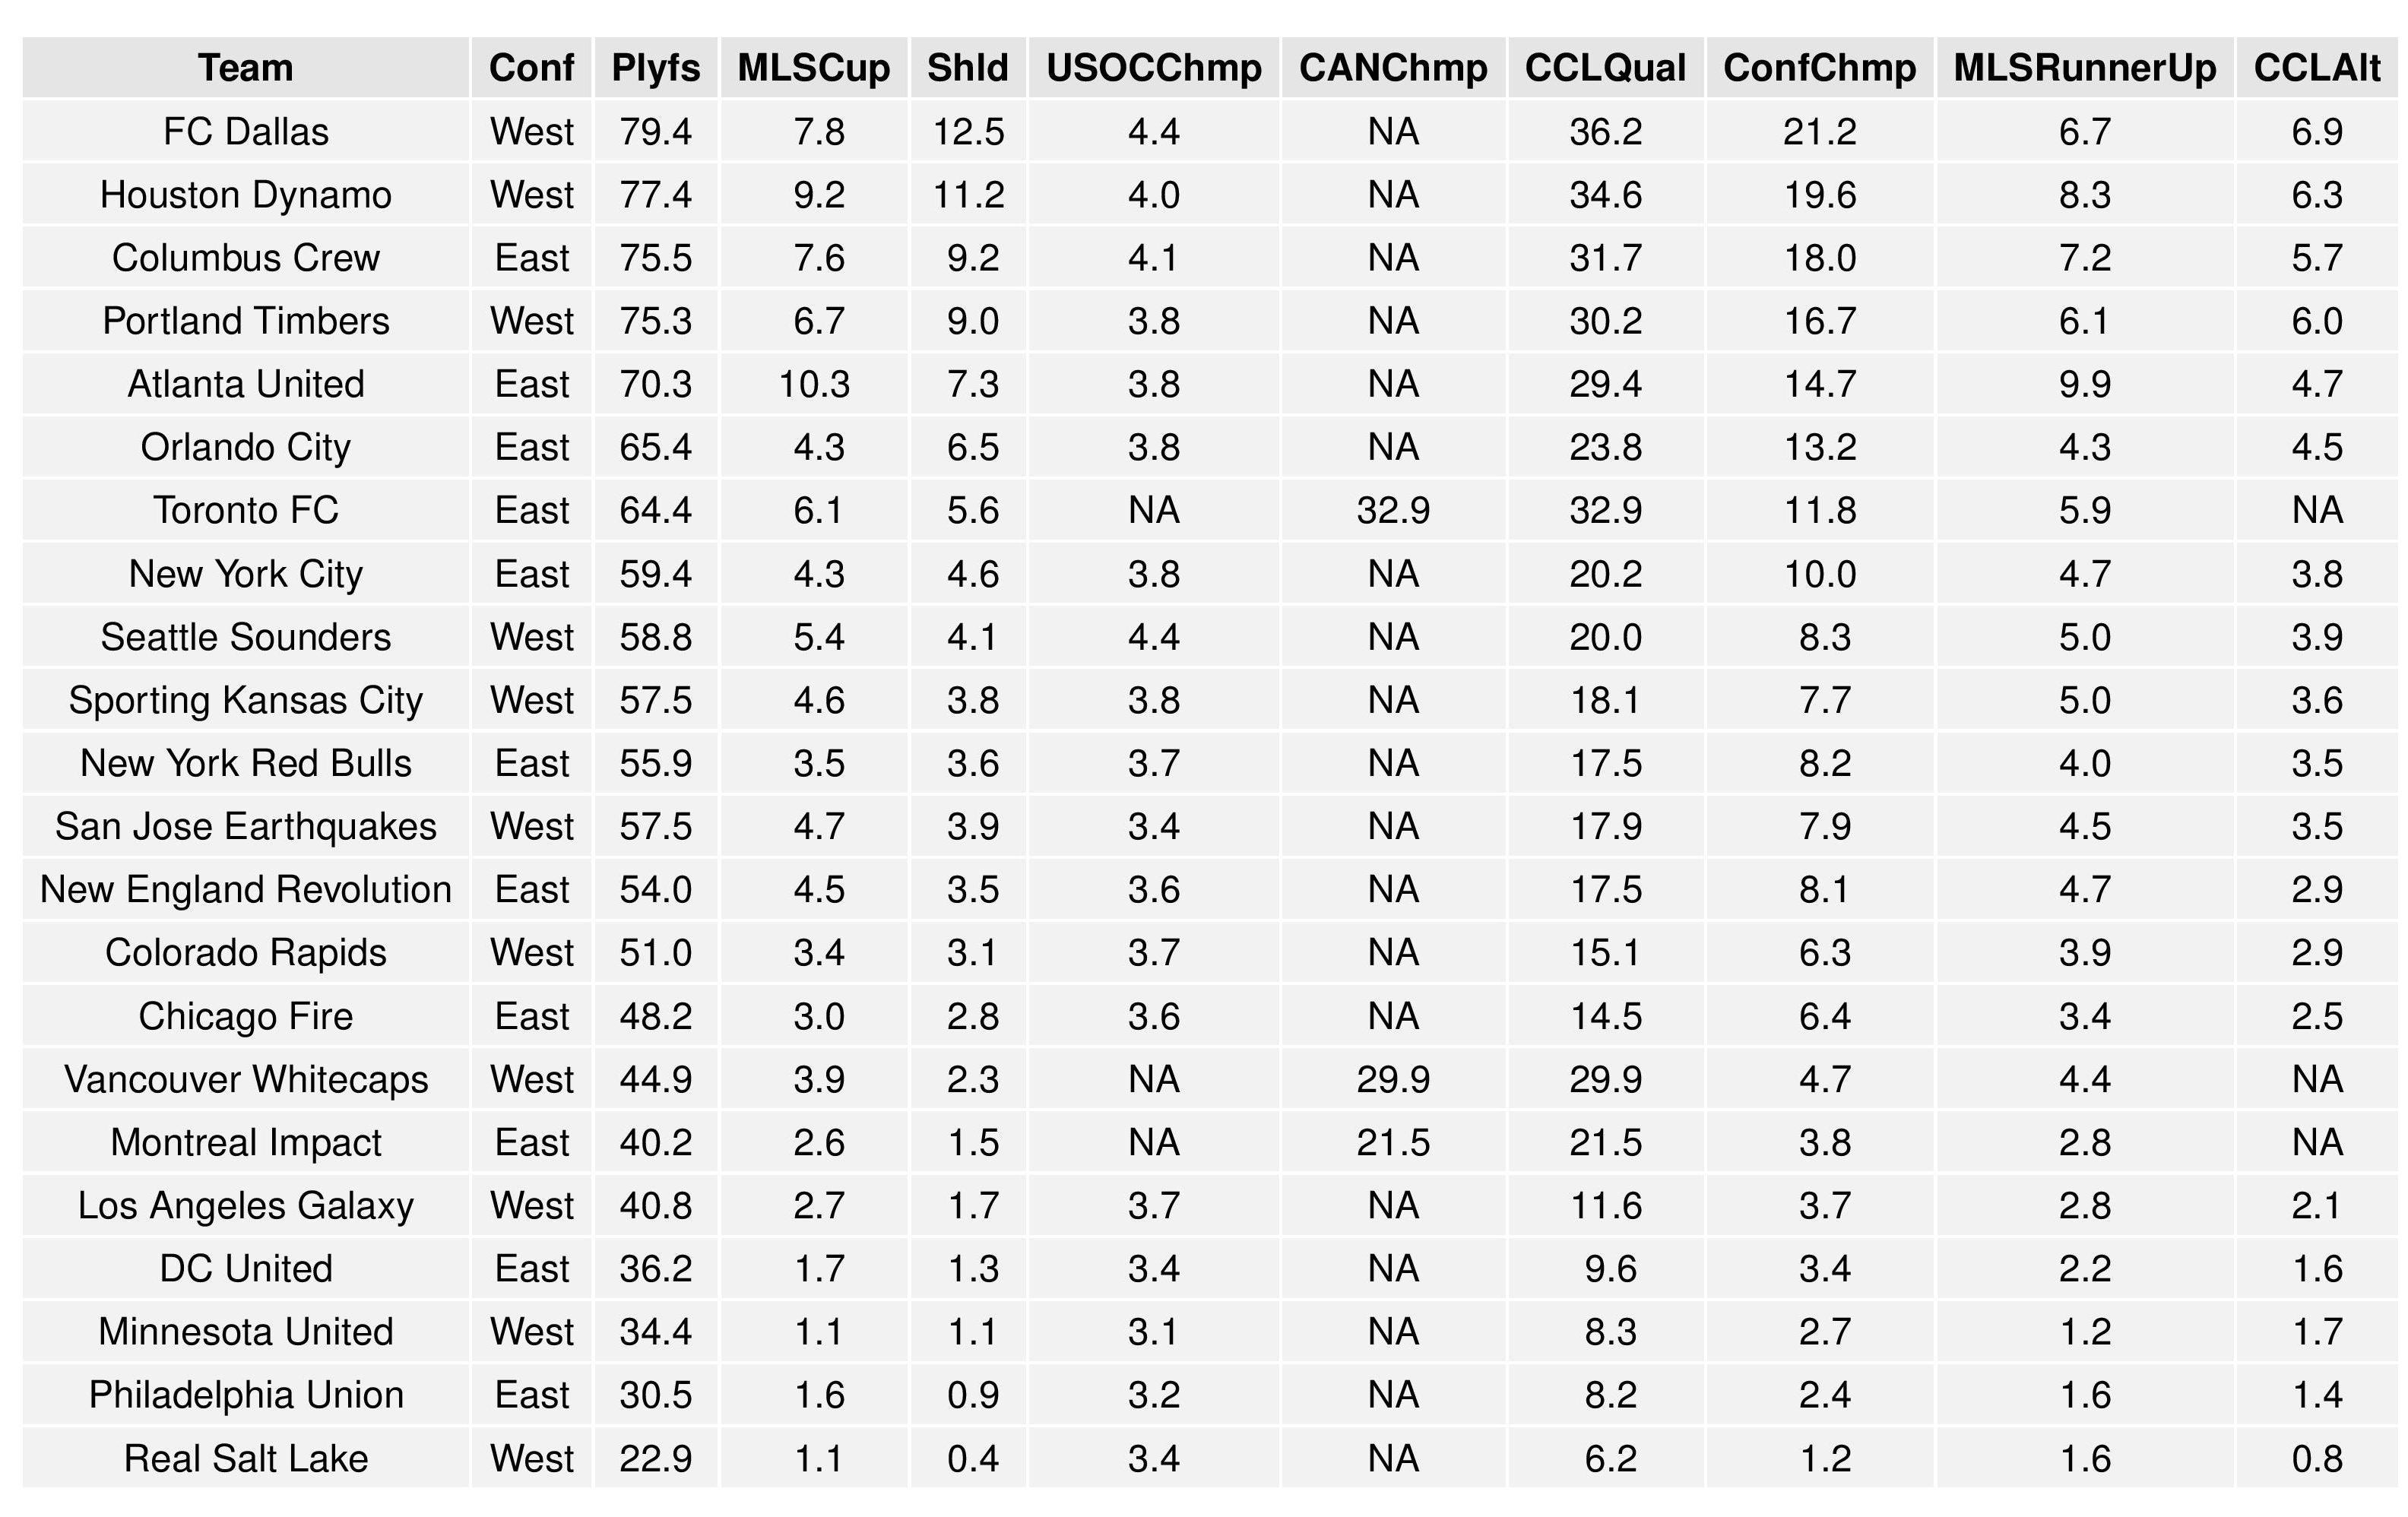
The following are probabilities for each category of outcomes for Philadelphia.
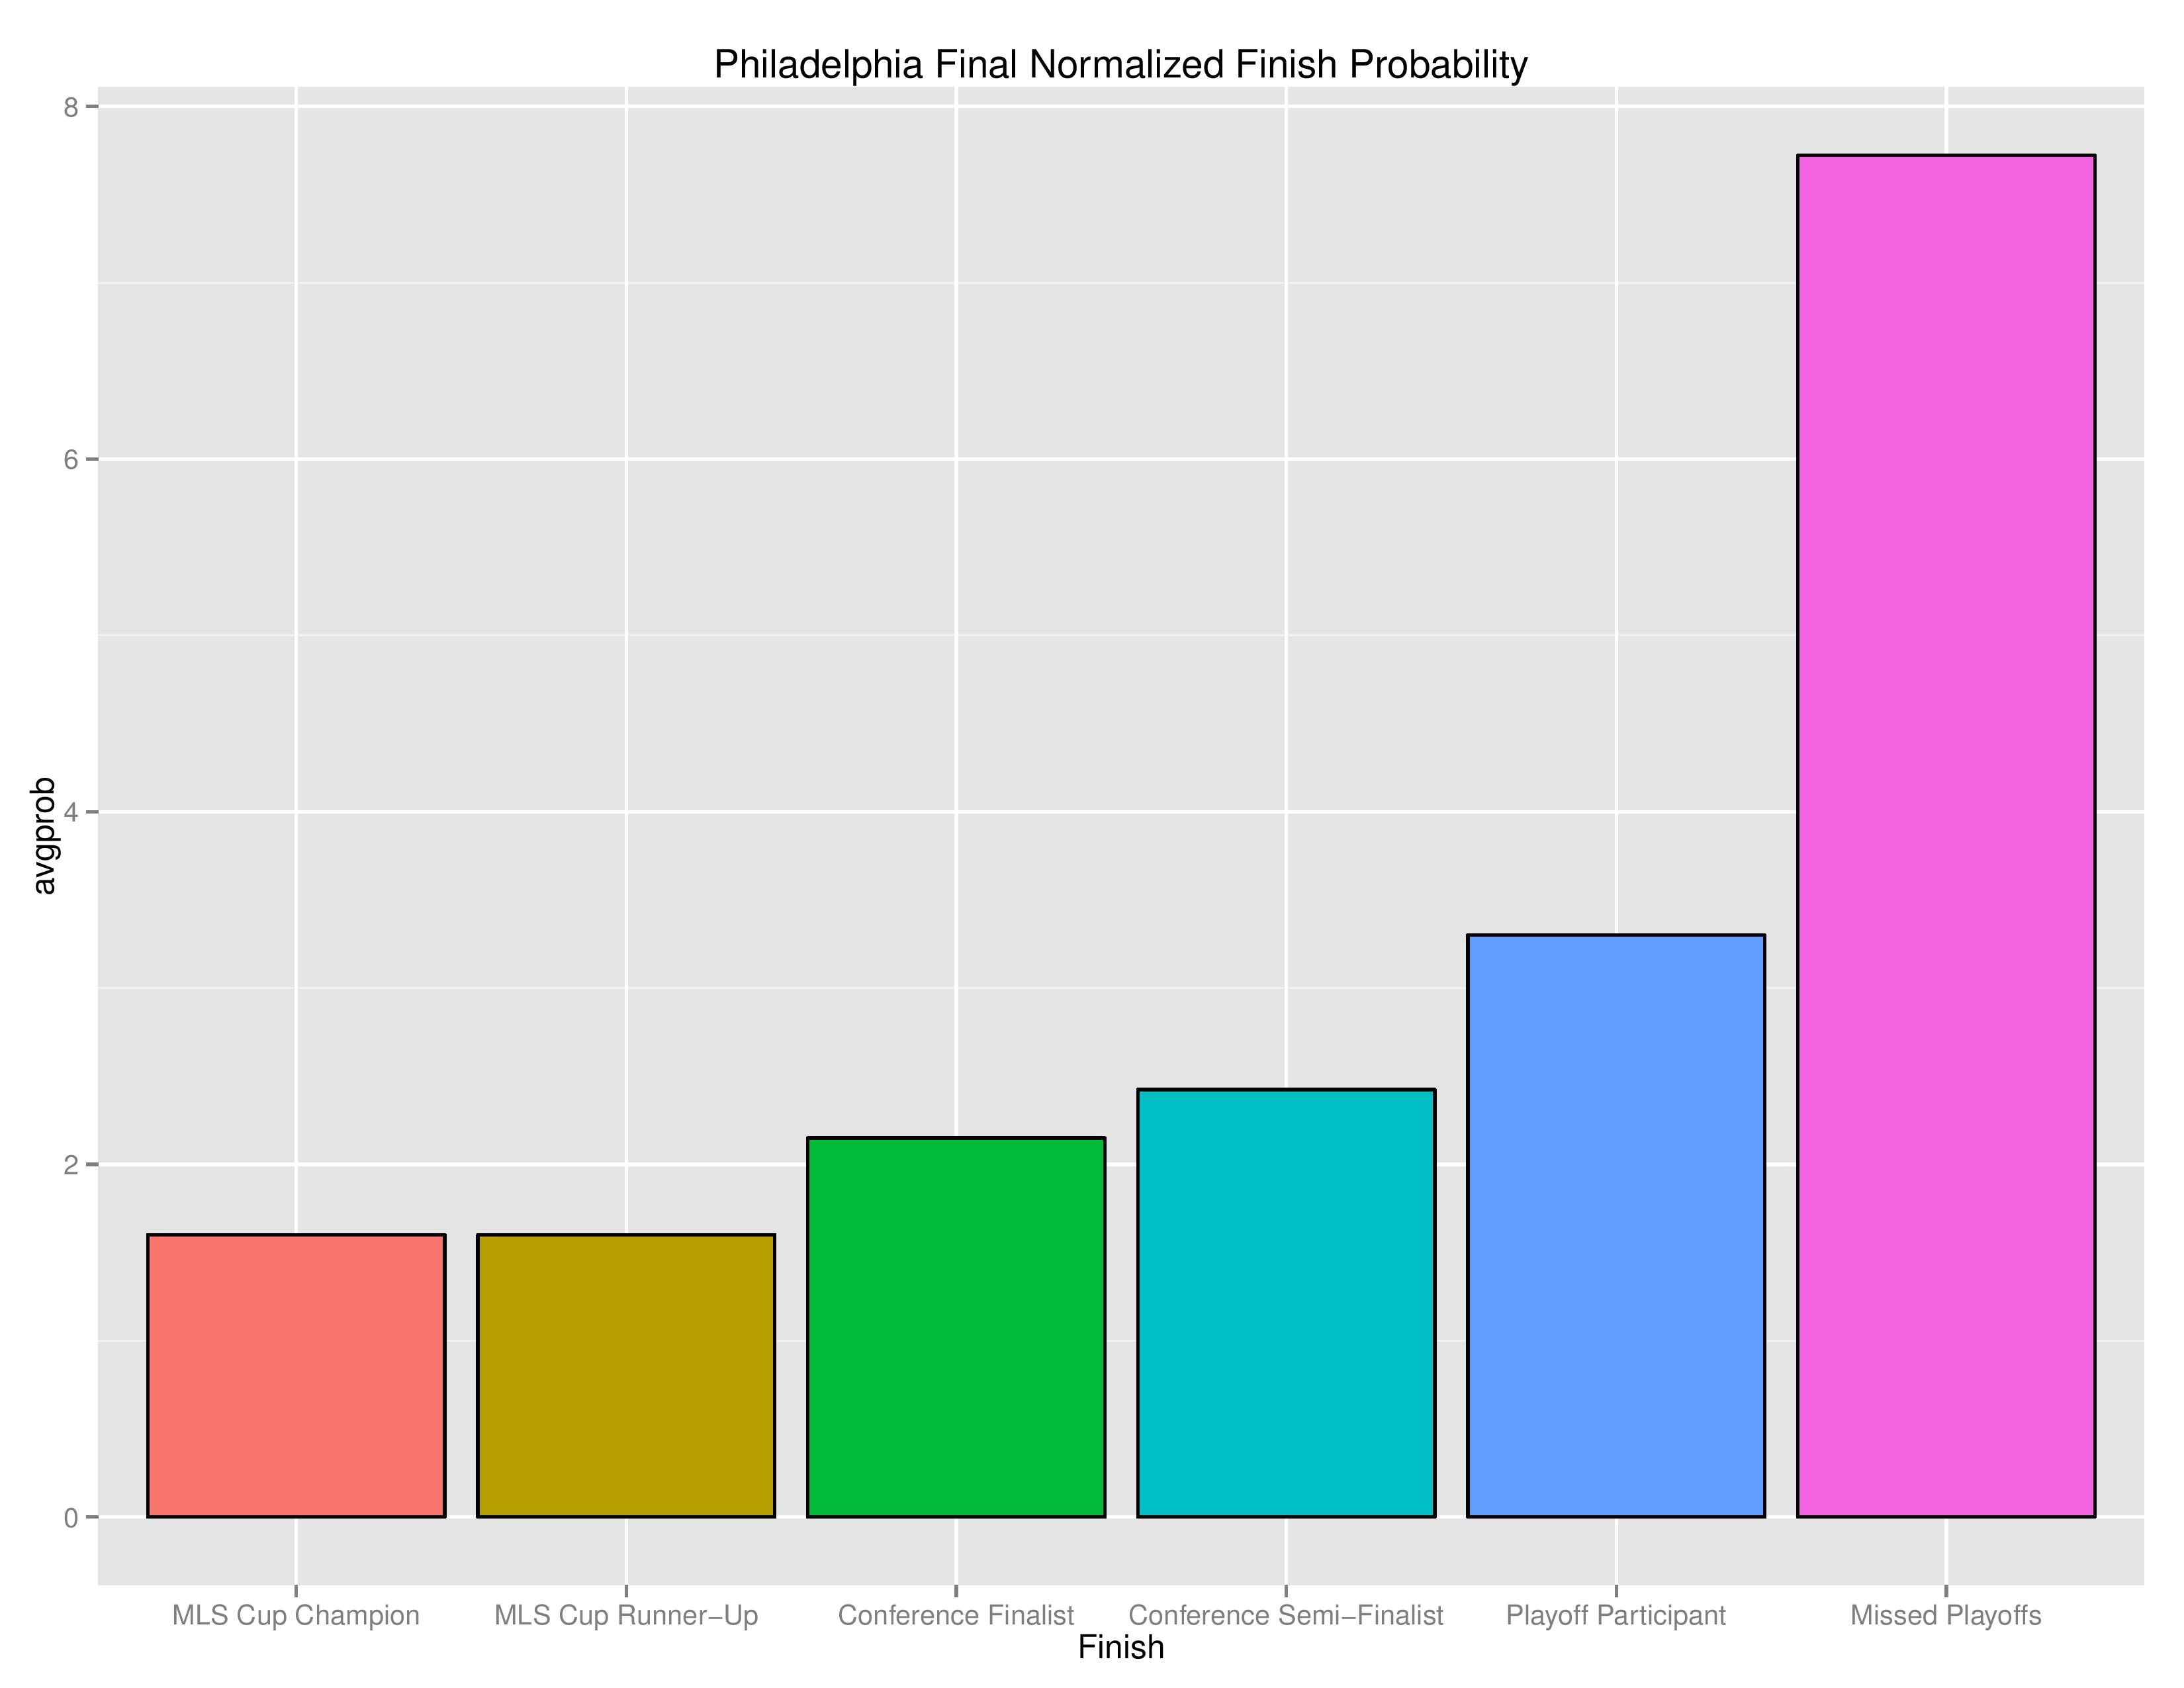
The following shows the relative probability of the prior categories. If the projection system were entirely random, these bars would be even, despite that “Missed Playoffs” is inherently 10 times more likely than “MLS Cup Champion.” The chart outlines where the club is headed.
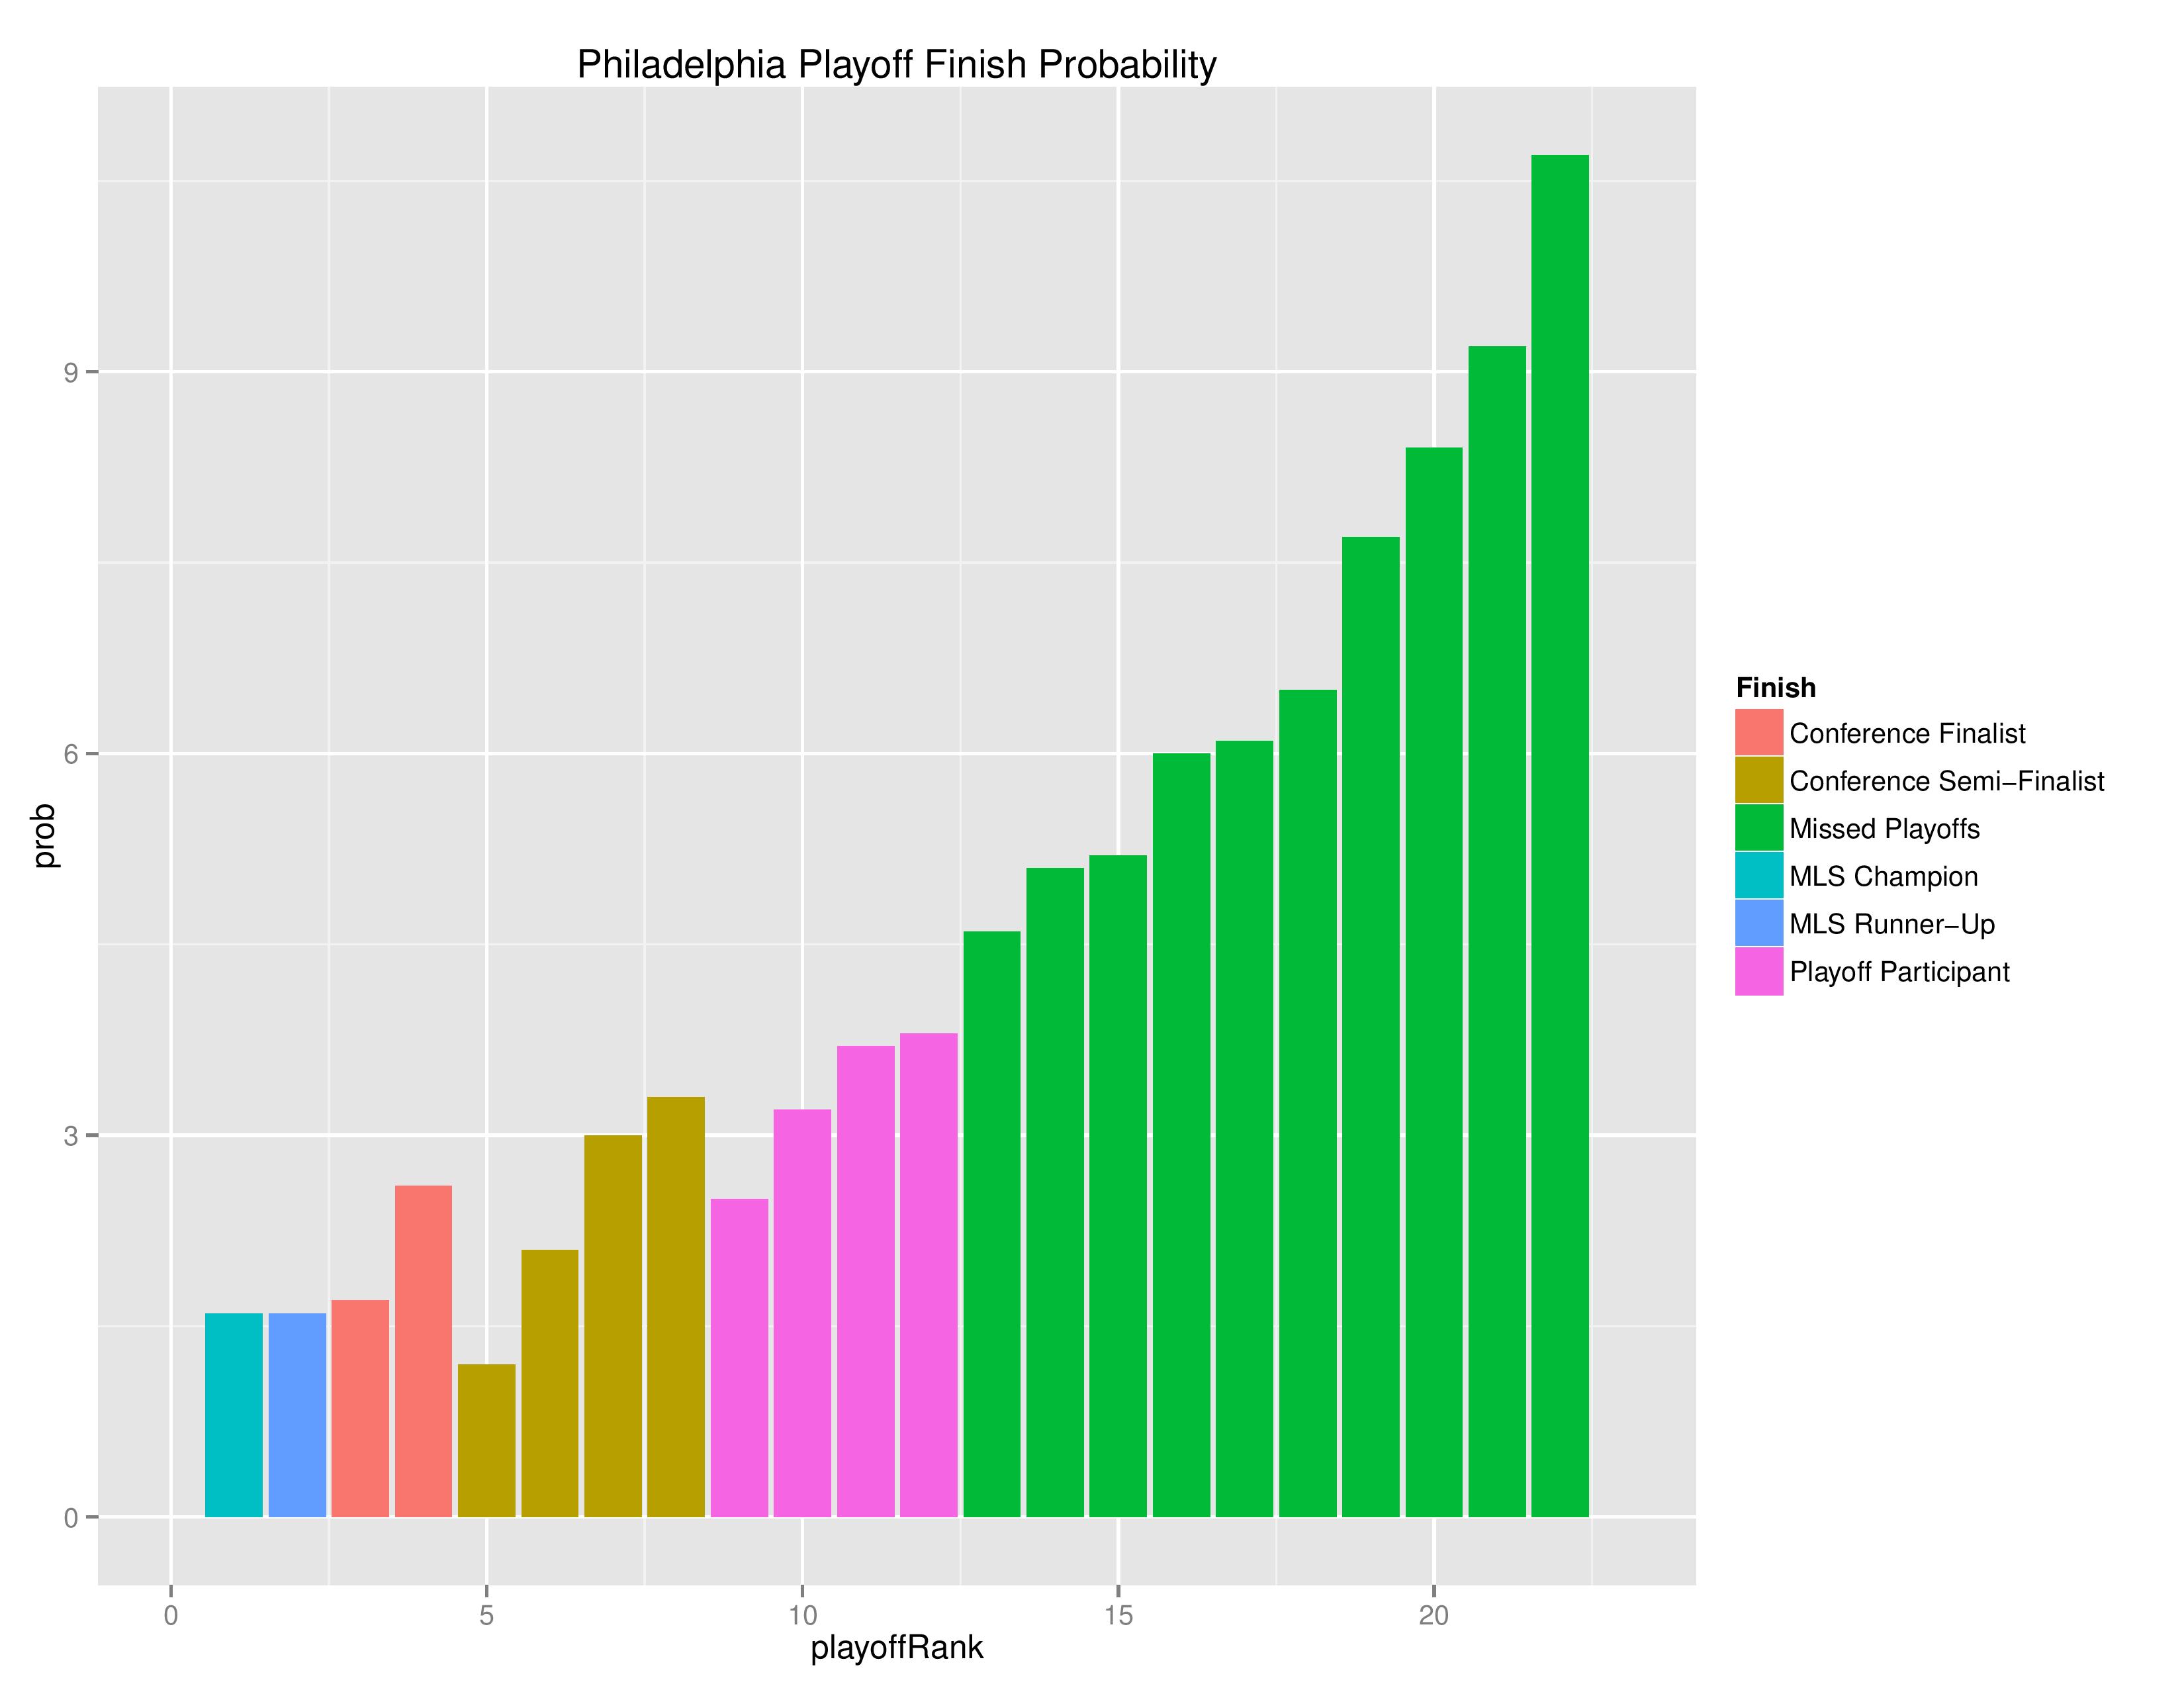
The following shows the probability of each post-playoff ranking finish.
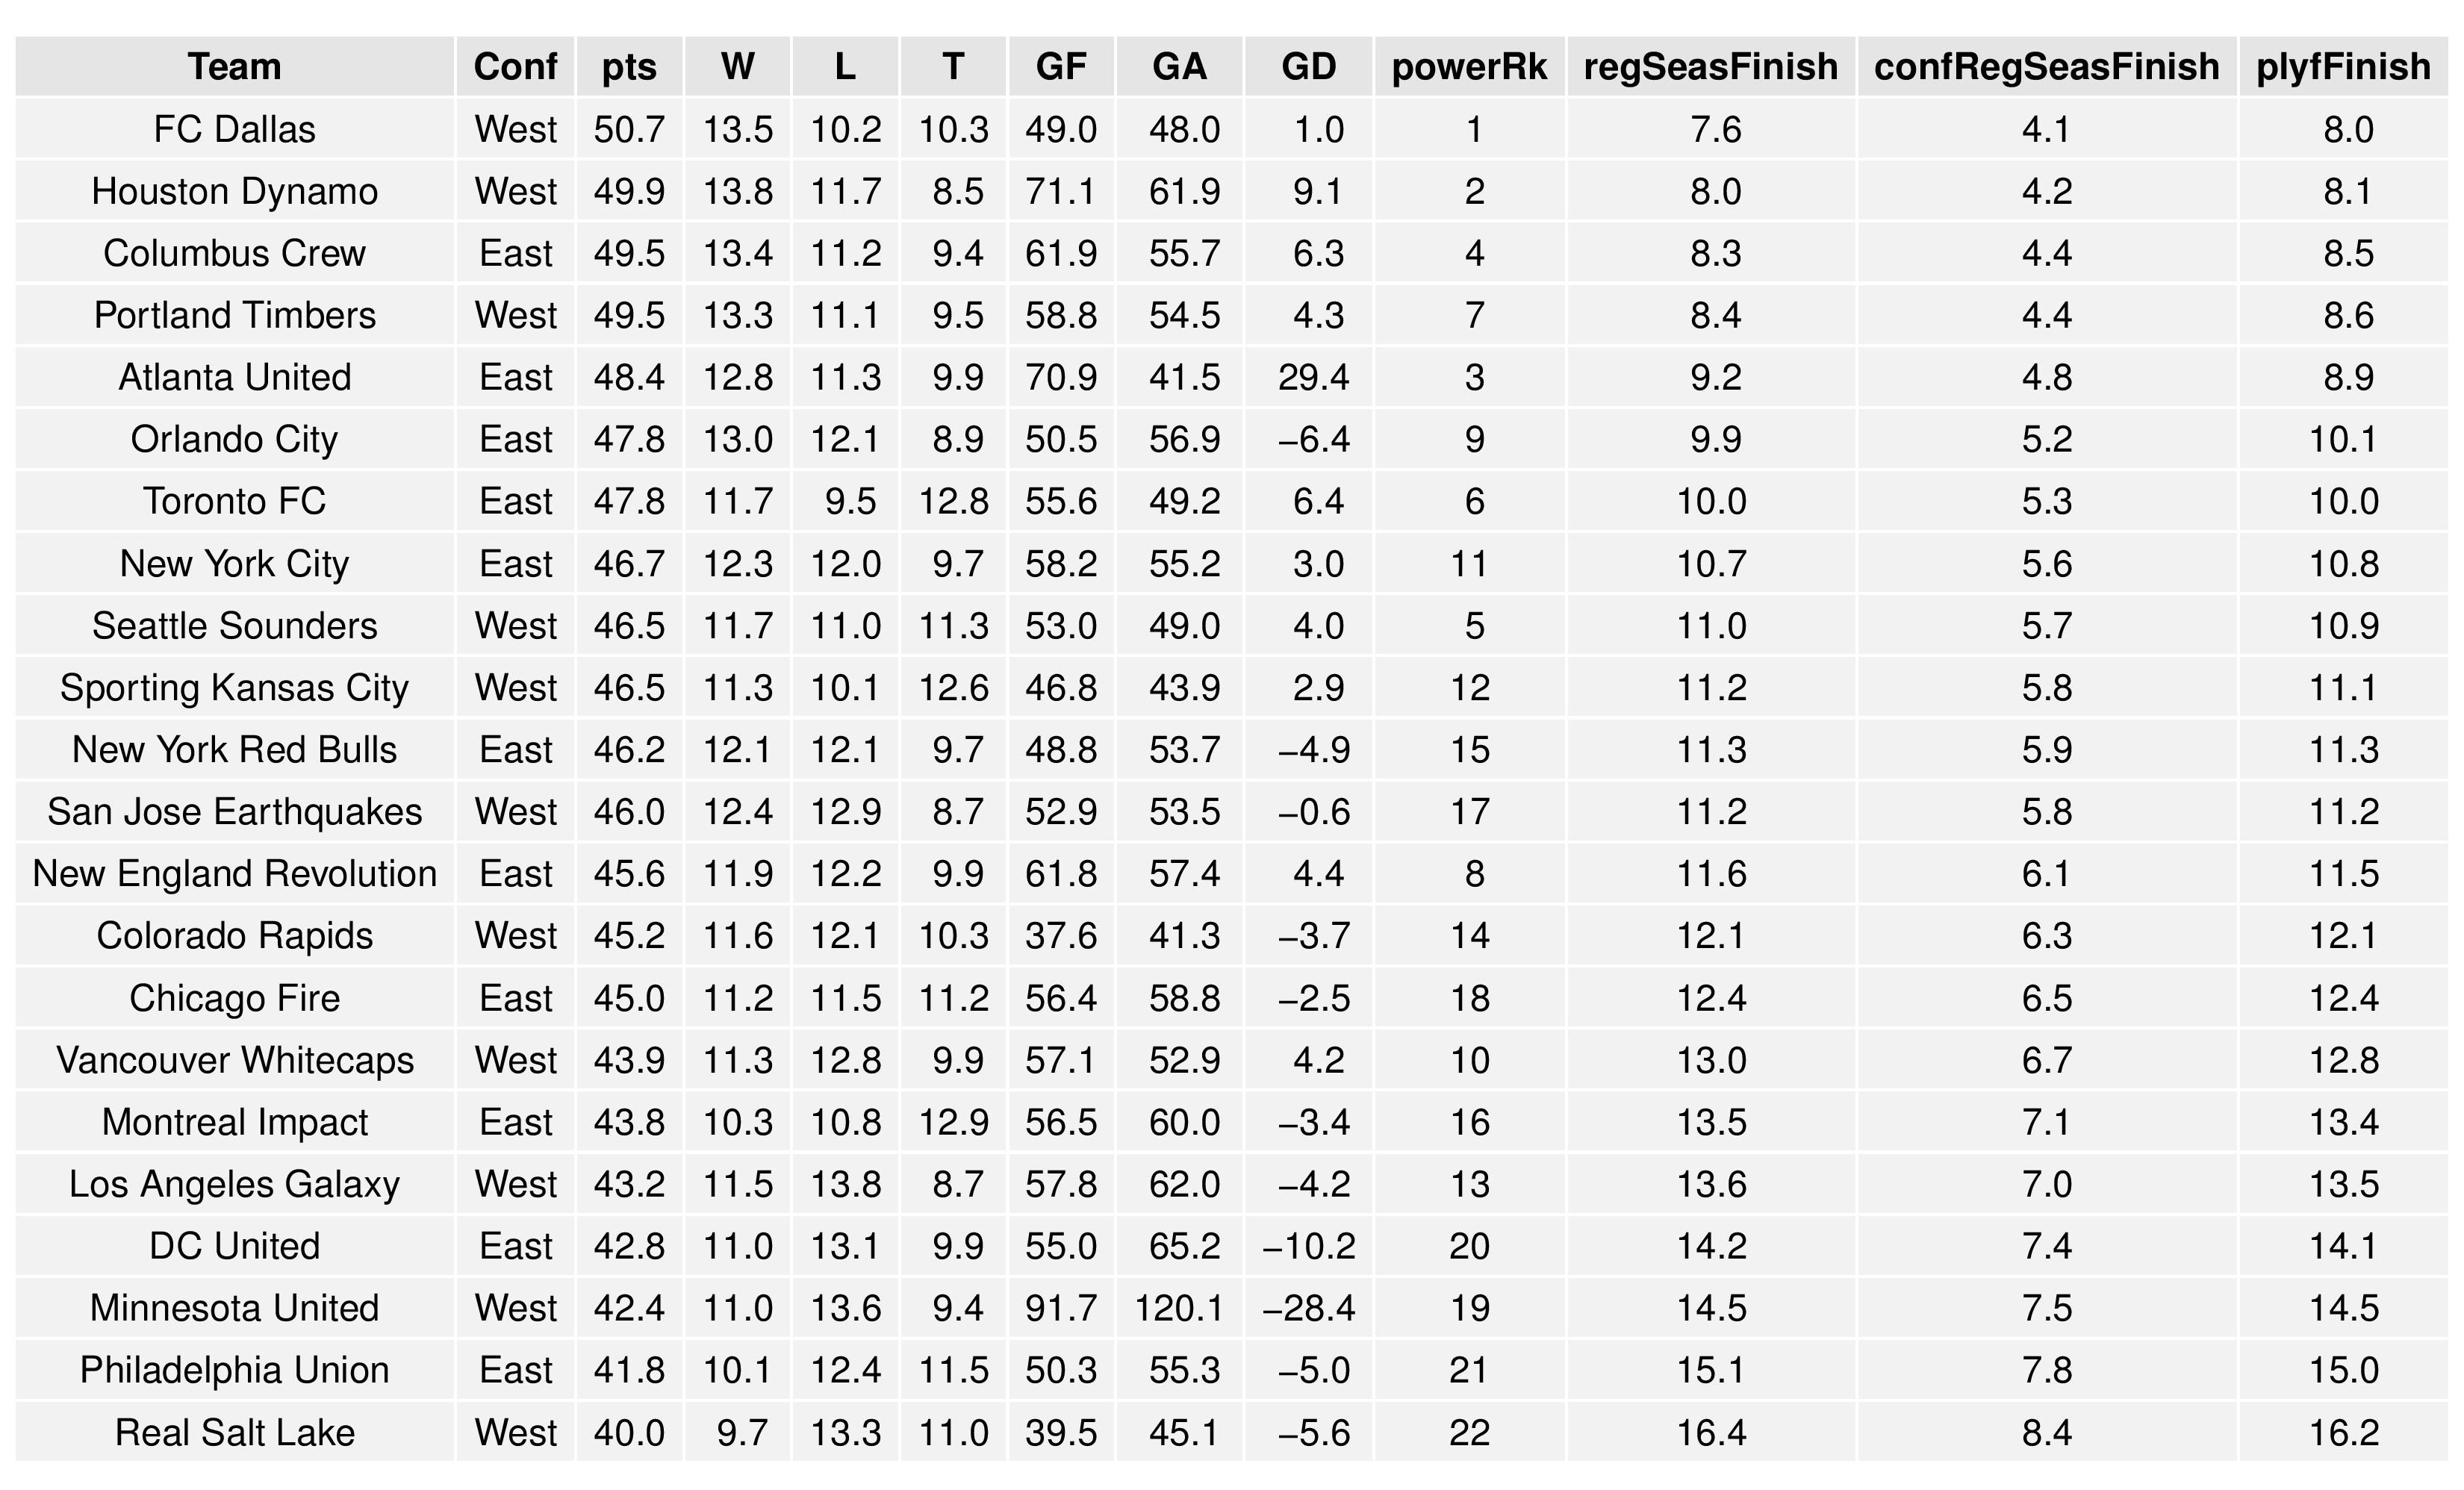
The following shows the summary of the simulations in an easy table format.
(Being expansion clubs, Minnesota’s and Atlanta’s goal data offer a small sample size and are therefore rather unlikely to be fulfilled at the moment. That will change soon).
Additionally, you may be wondering why power rankings don’t necessarily correspond with projected finish. While some of it is due to strength-of-schedule, there is likely another explanation making a larger contribution. As you can see from the power rankings chart earlier in the article, the model does not currently have enough evidence to judge the skill of teams as significantly different from one another (and doesn’t often see as large an impact even with a larger data set). Therefore, projecting the outcome of the season is fairly reliant upon points-in-hand and home field advantage. While individual simulations can vary significantly from points-in-hand, when all simulations are averaged as below, they are more likely to swing based upon the points-in-hand. At the moment, some clubs who are deemed worse have obtained points-in-hand, particularly in comparison to their home-field-advantage-expectations.
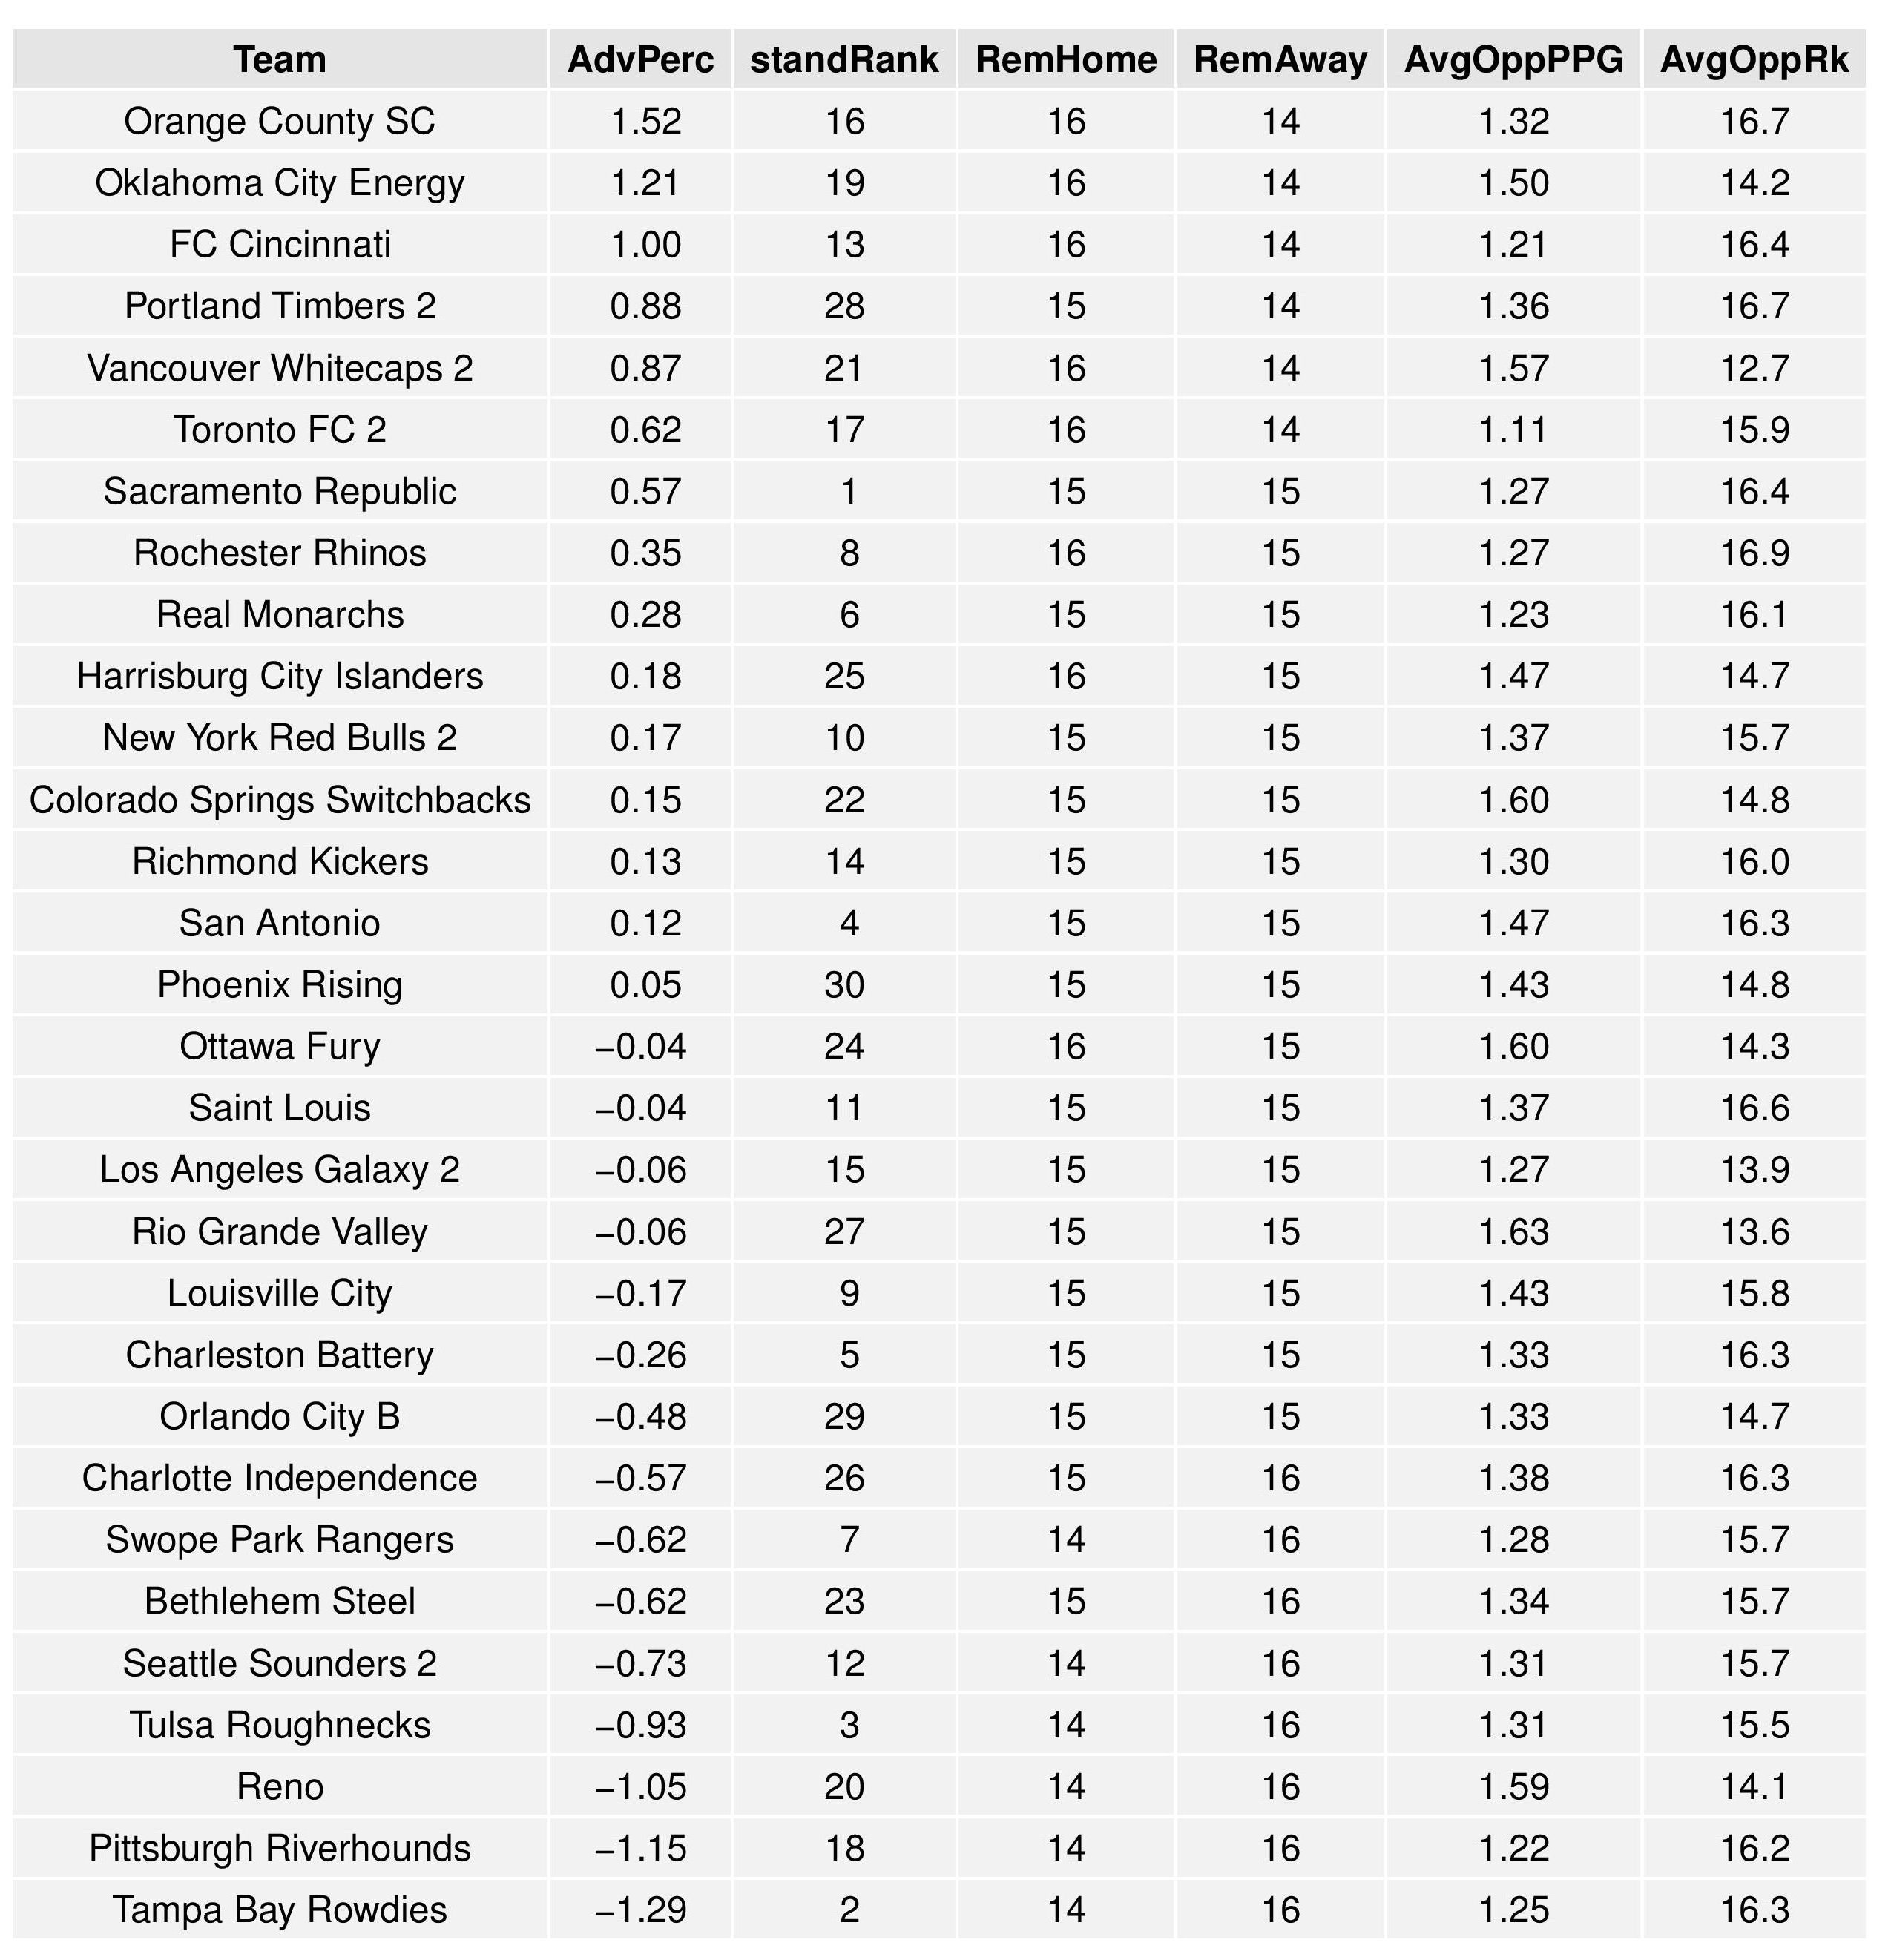
Next we show how the Remaining Strength of Schedule affects each team.
The “Points Percentage Advantage” shown on the X-axis represents the percentage of points expected over the league average schedule. This “points expected” value is generated by simulating how all teams would perform with all remaining schedules (and therefore judges a schedule based upon how all teams would perform in that scenario).
In short, the higher the value, the easier the remaining schedule.
Remaining home field advantage will be important here. It might also be true that a better team has an ‘easier’ schedule simply because they do not have to play themselves. Likewise, a bad team may have a ‘harder’ schedule because they also do not play themselves.
The table following the chart also shares helpful context with these percentages.

Accompanying the advantage percentage in the following table is their current standings rank (right now ties are not properly calculated beyond pts/gd/gf; I may fix that, but maybe not for a while), the remaining home matches, the remaining away matches, the current average points-per-game of future opponents (results-based, not model-based), and the average power ranking of future opponents according to SEBA.

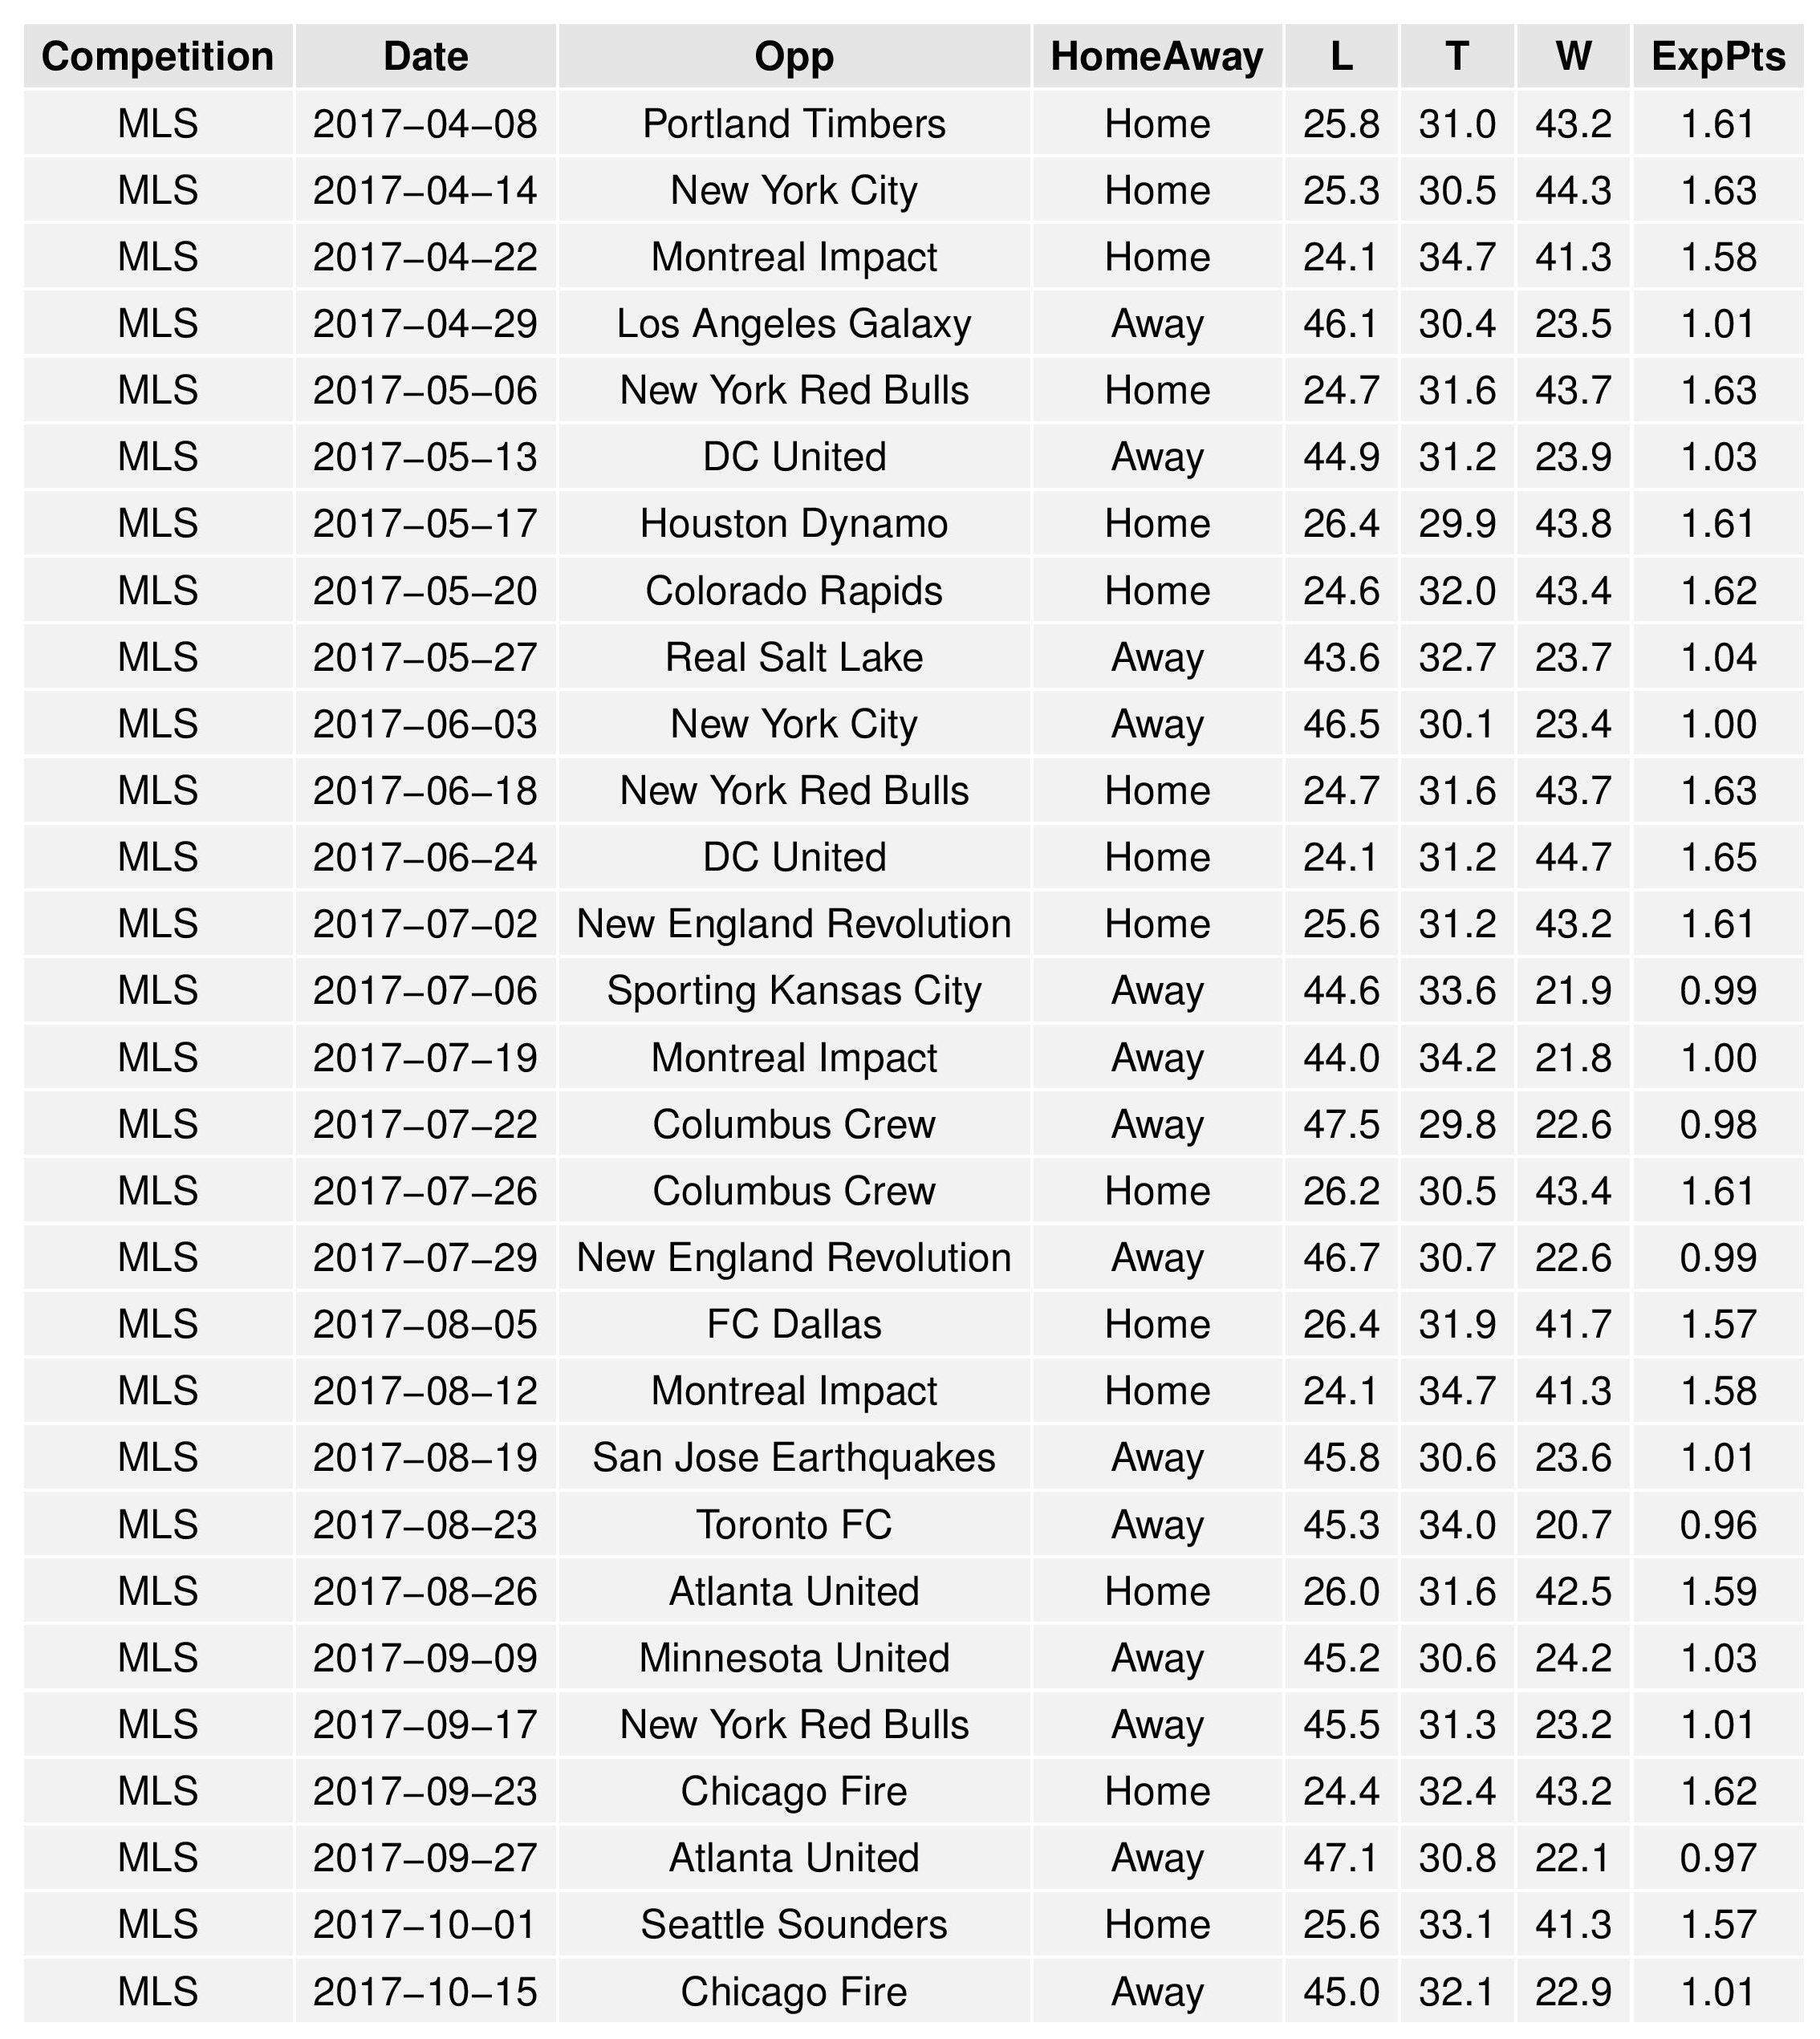
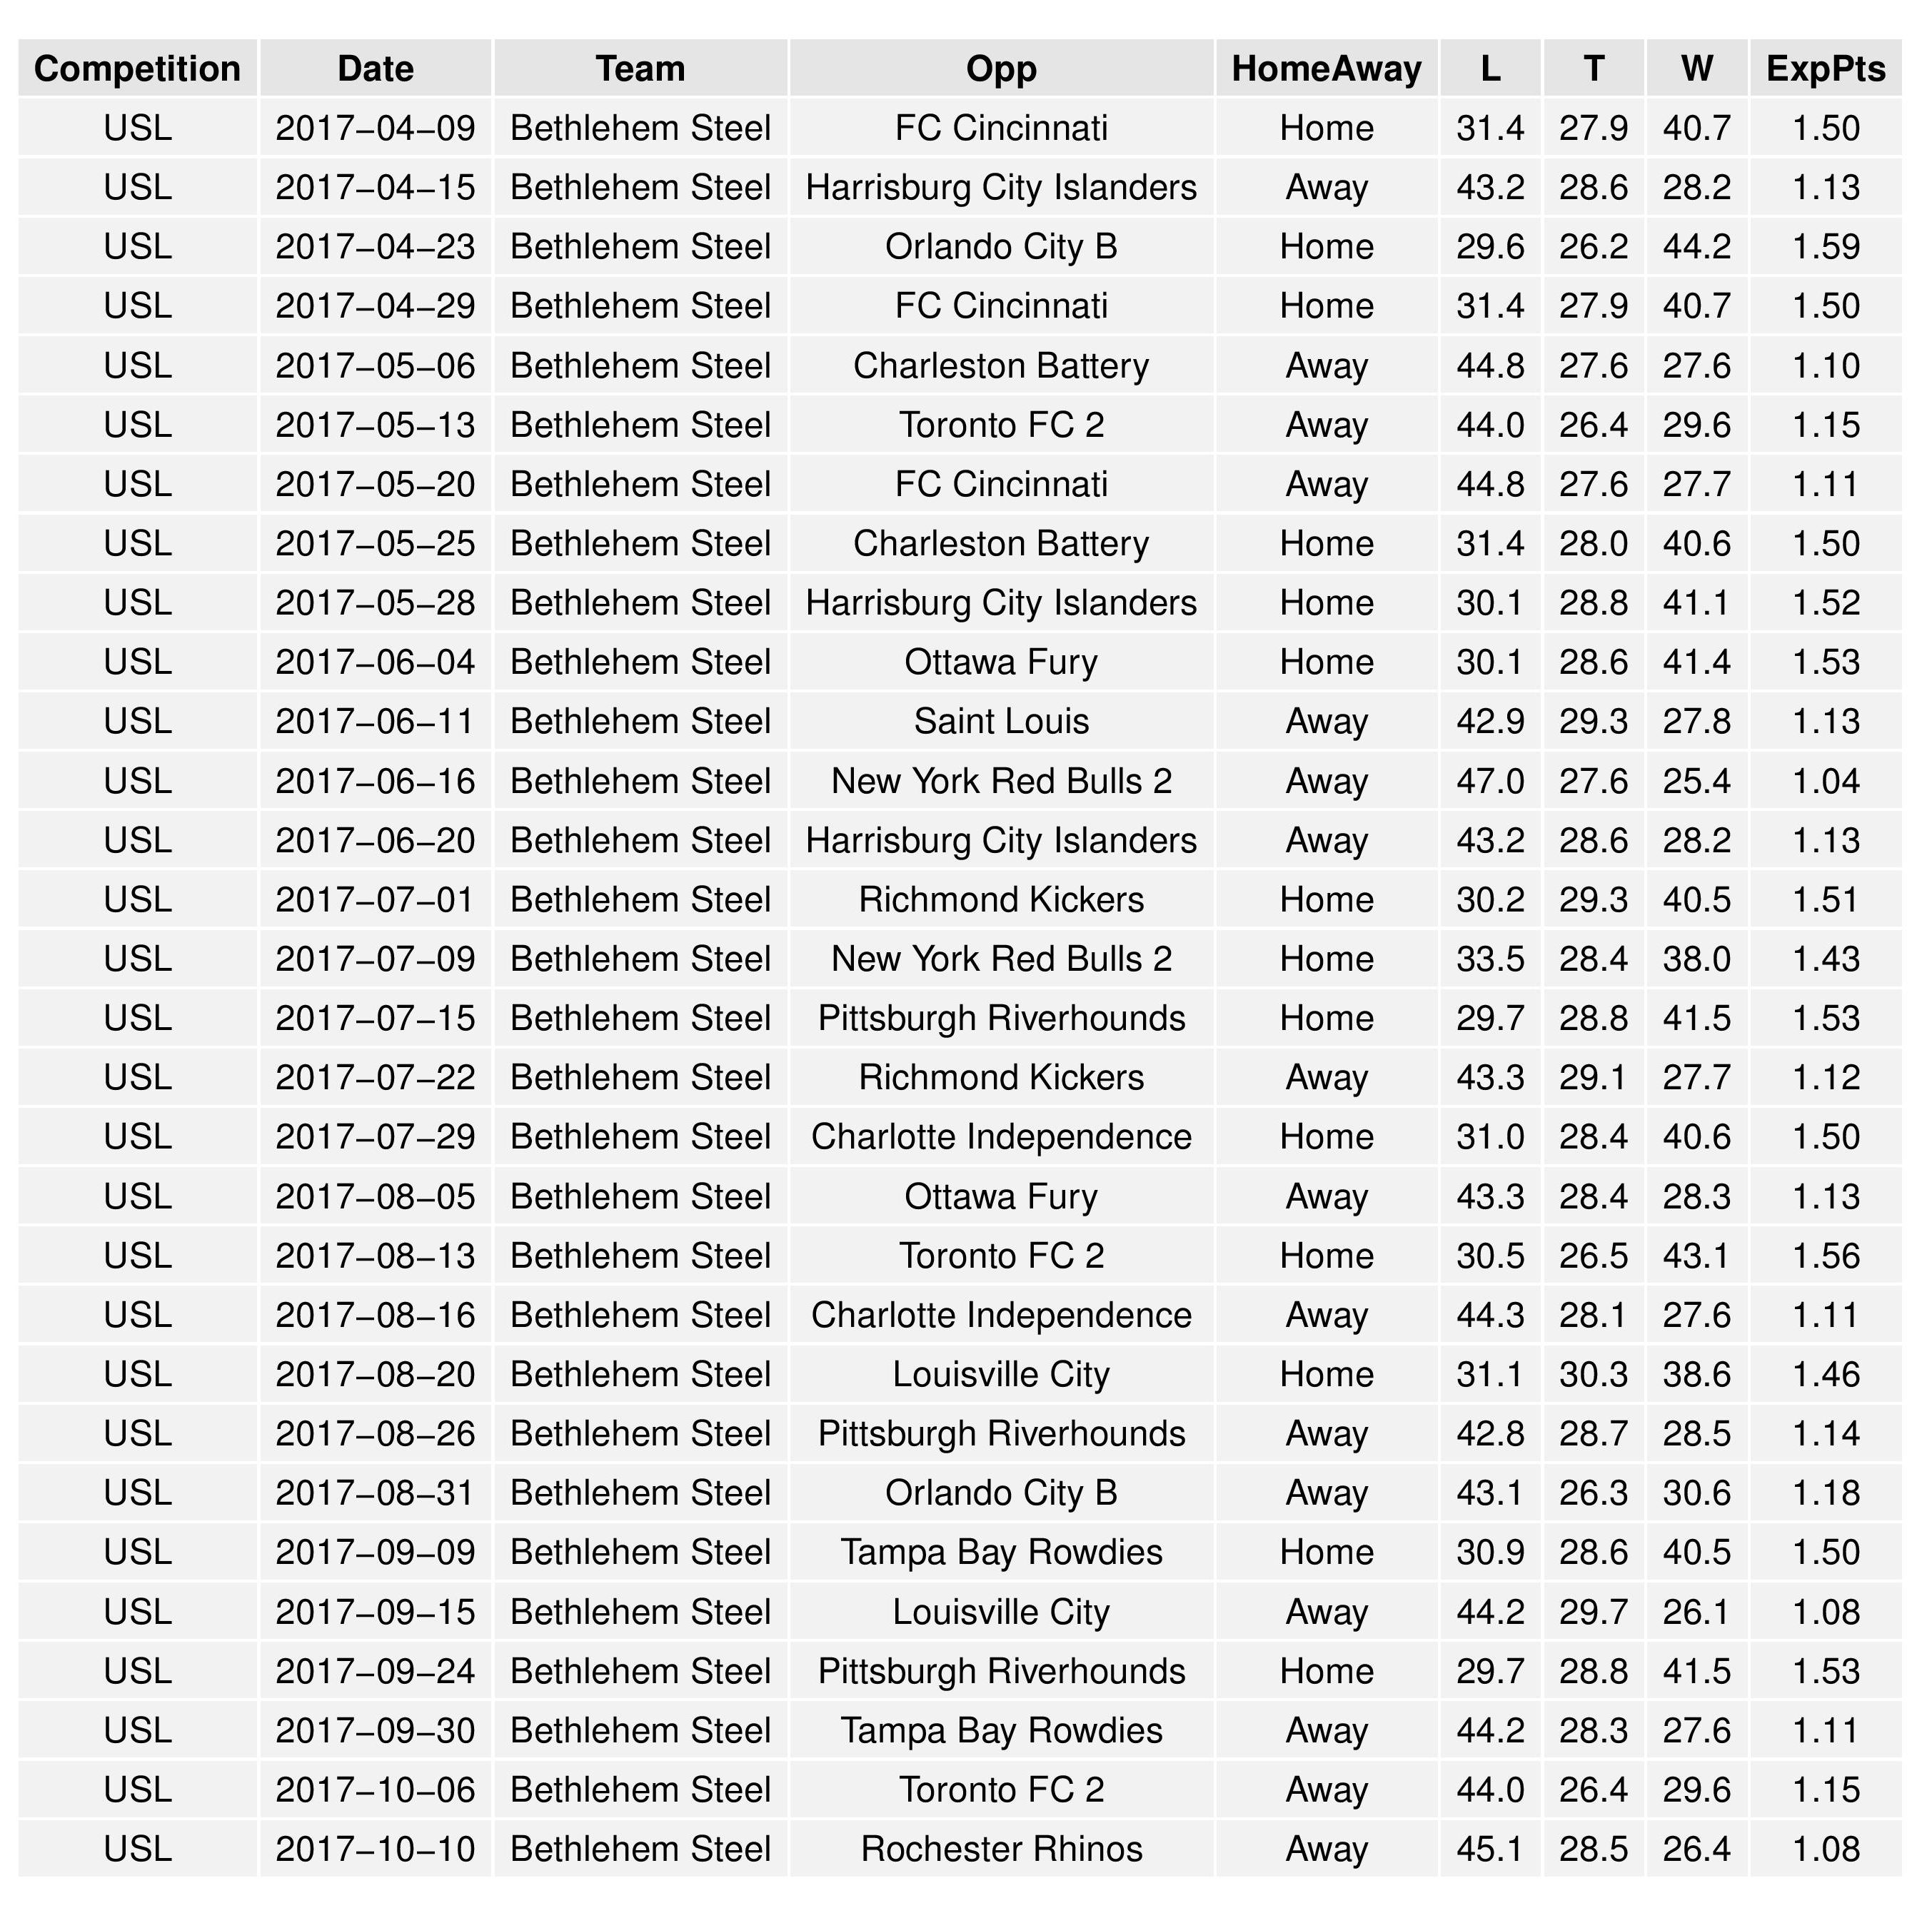
The following shows the expectations for upcoming Philadelphia matches:
USL
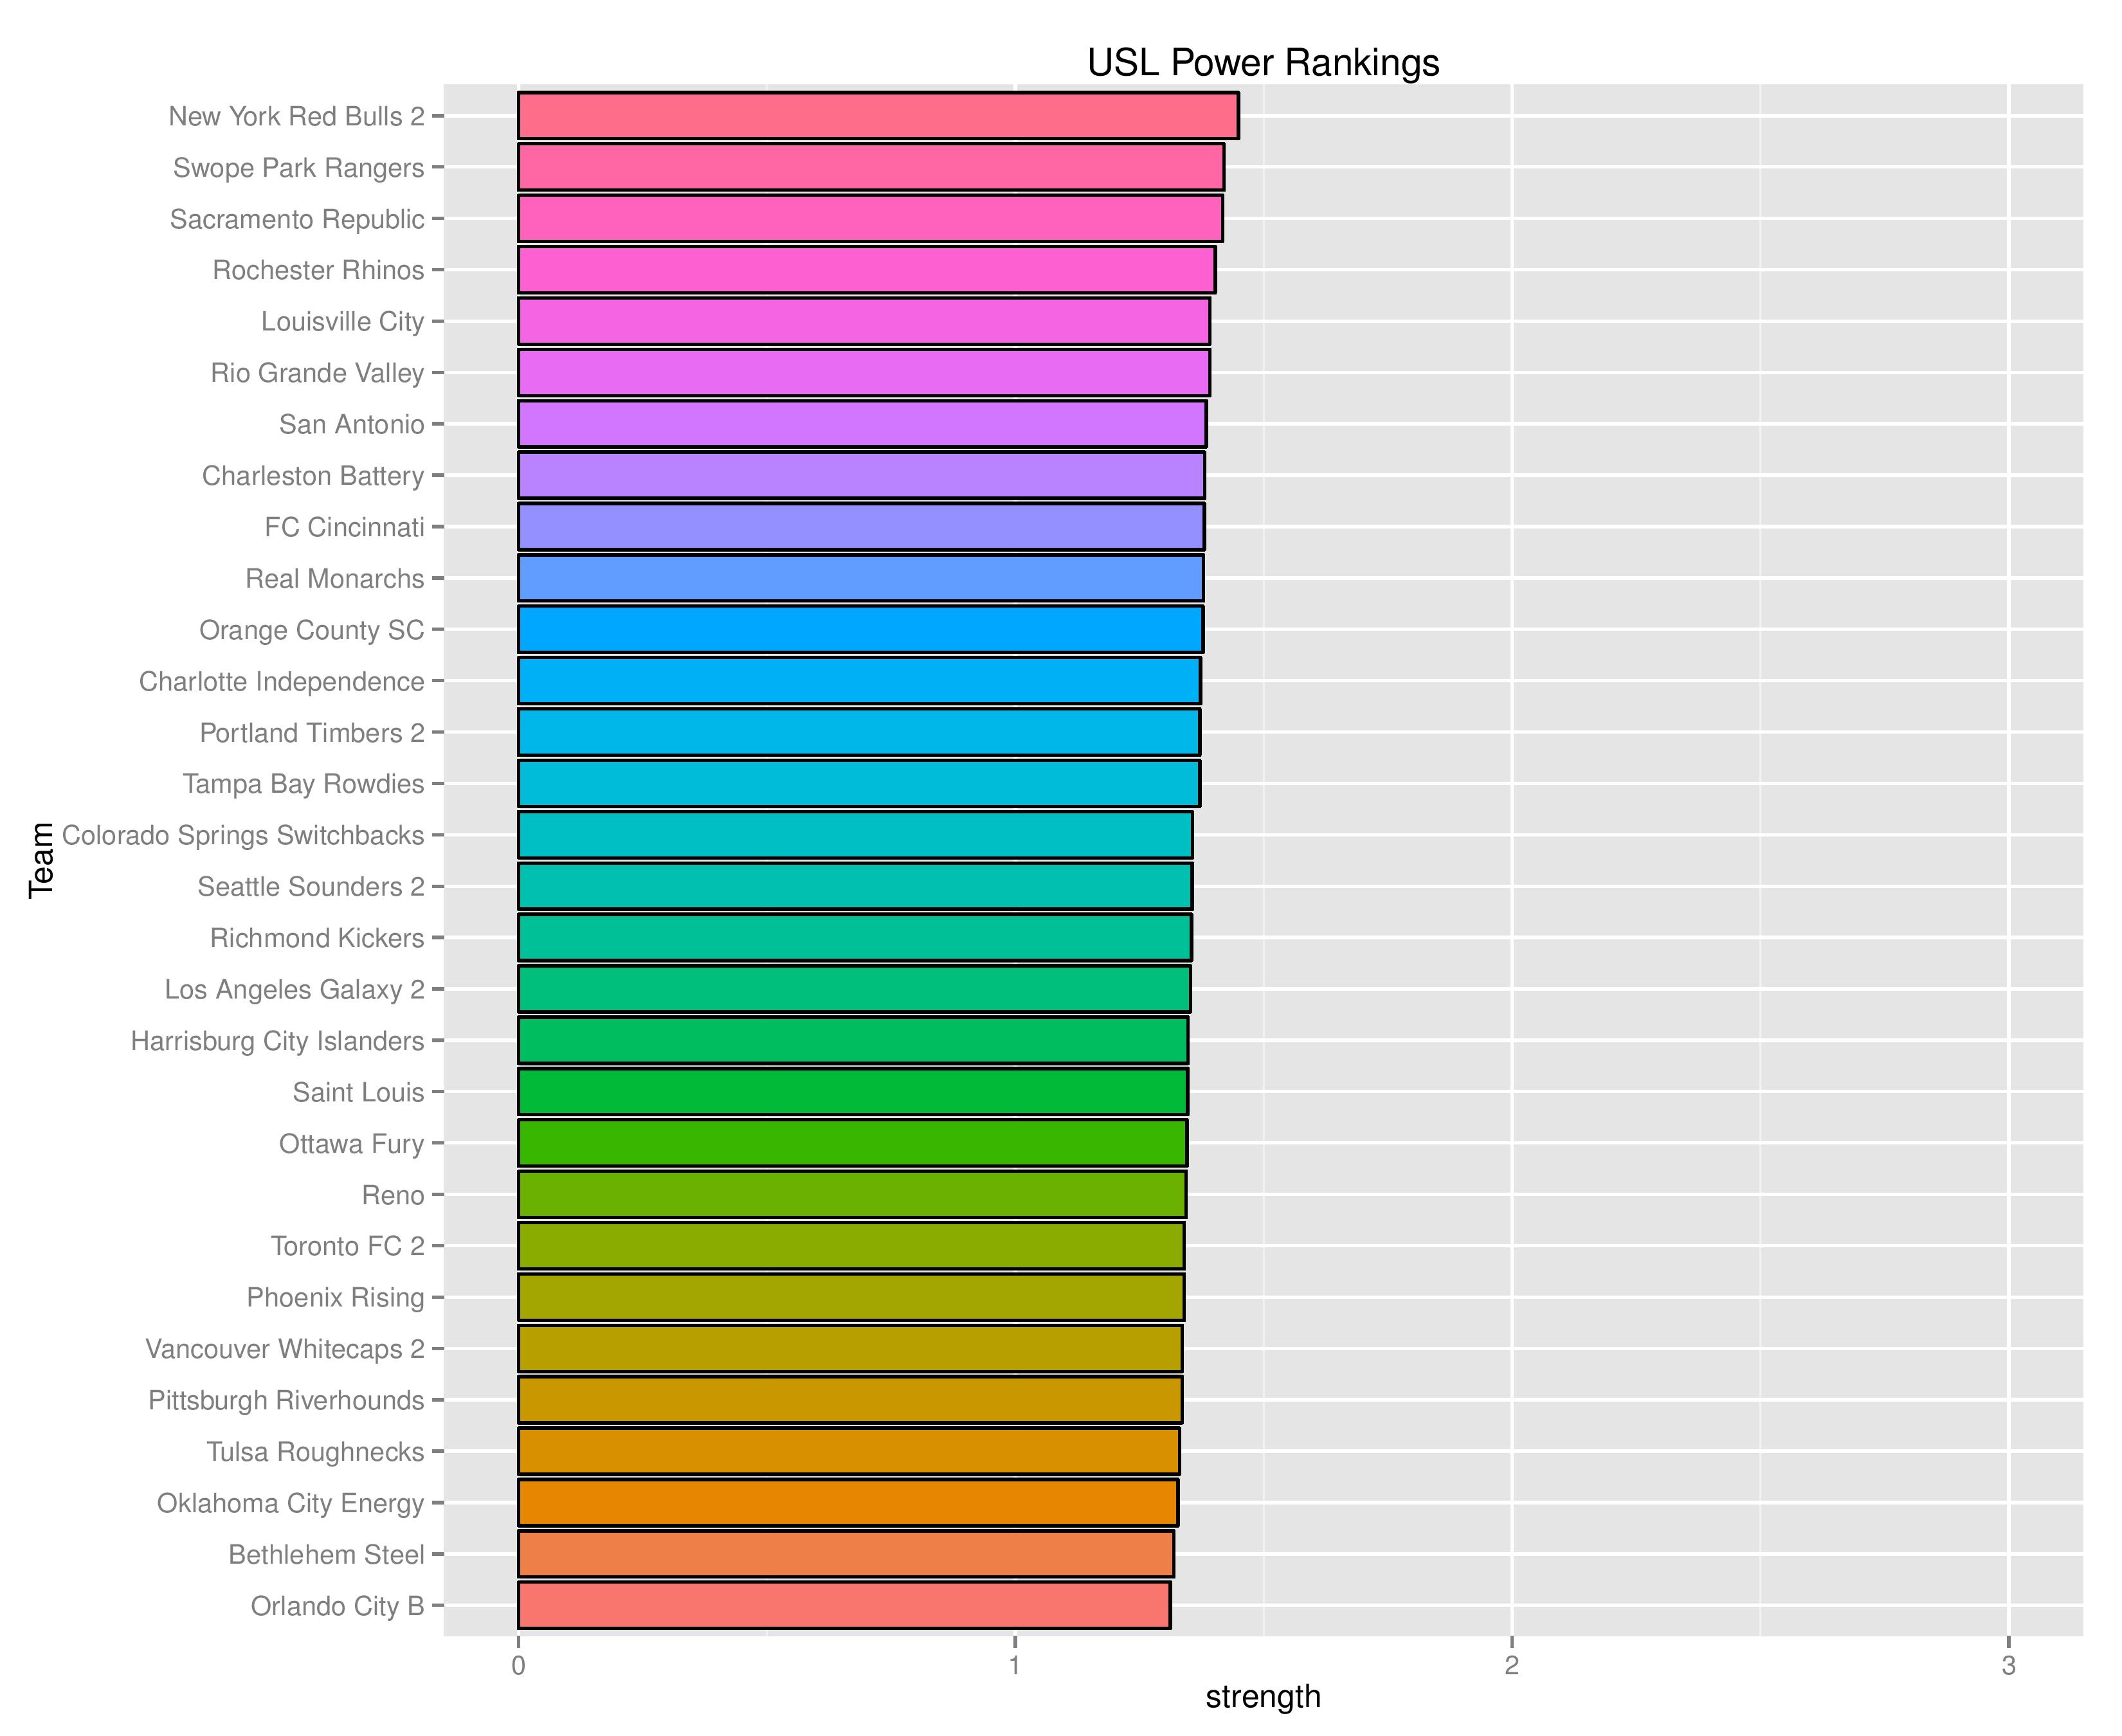
Power Rankings
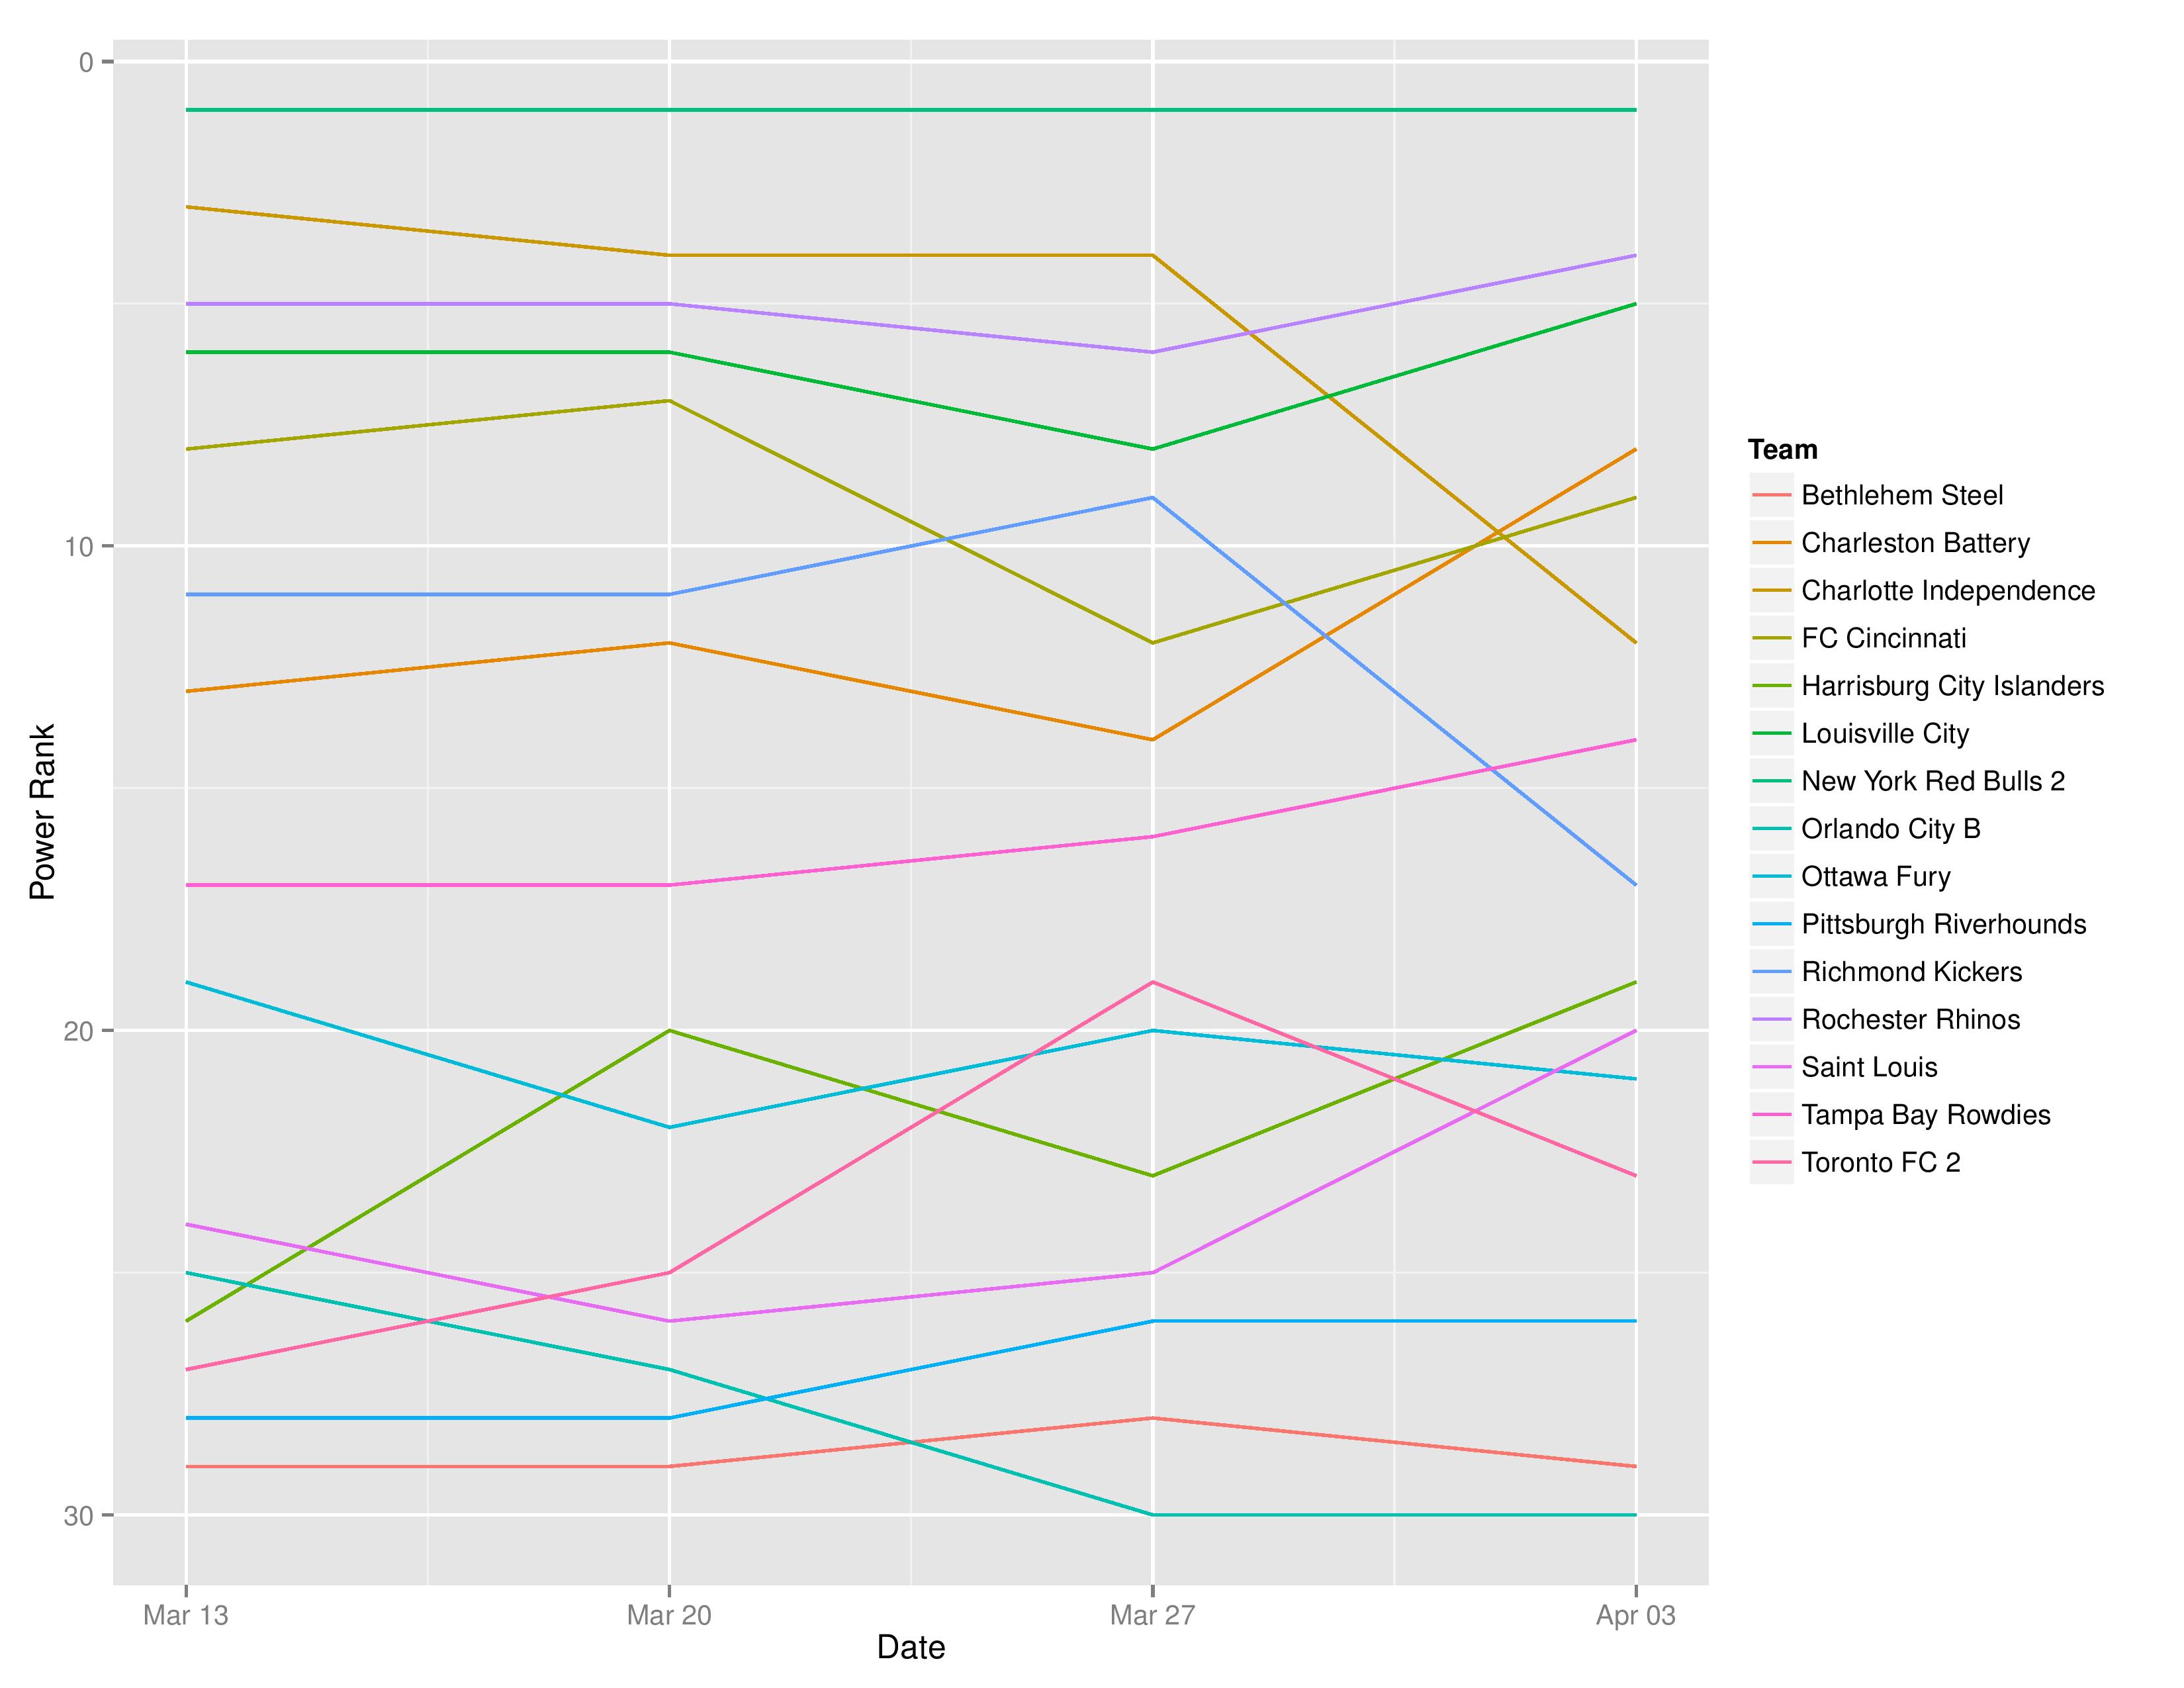
SEBA has Bethlehem Steel decreasing to 29th from 28th. It has Harrisburg City moving up to 19th from 23rd.
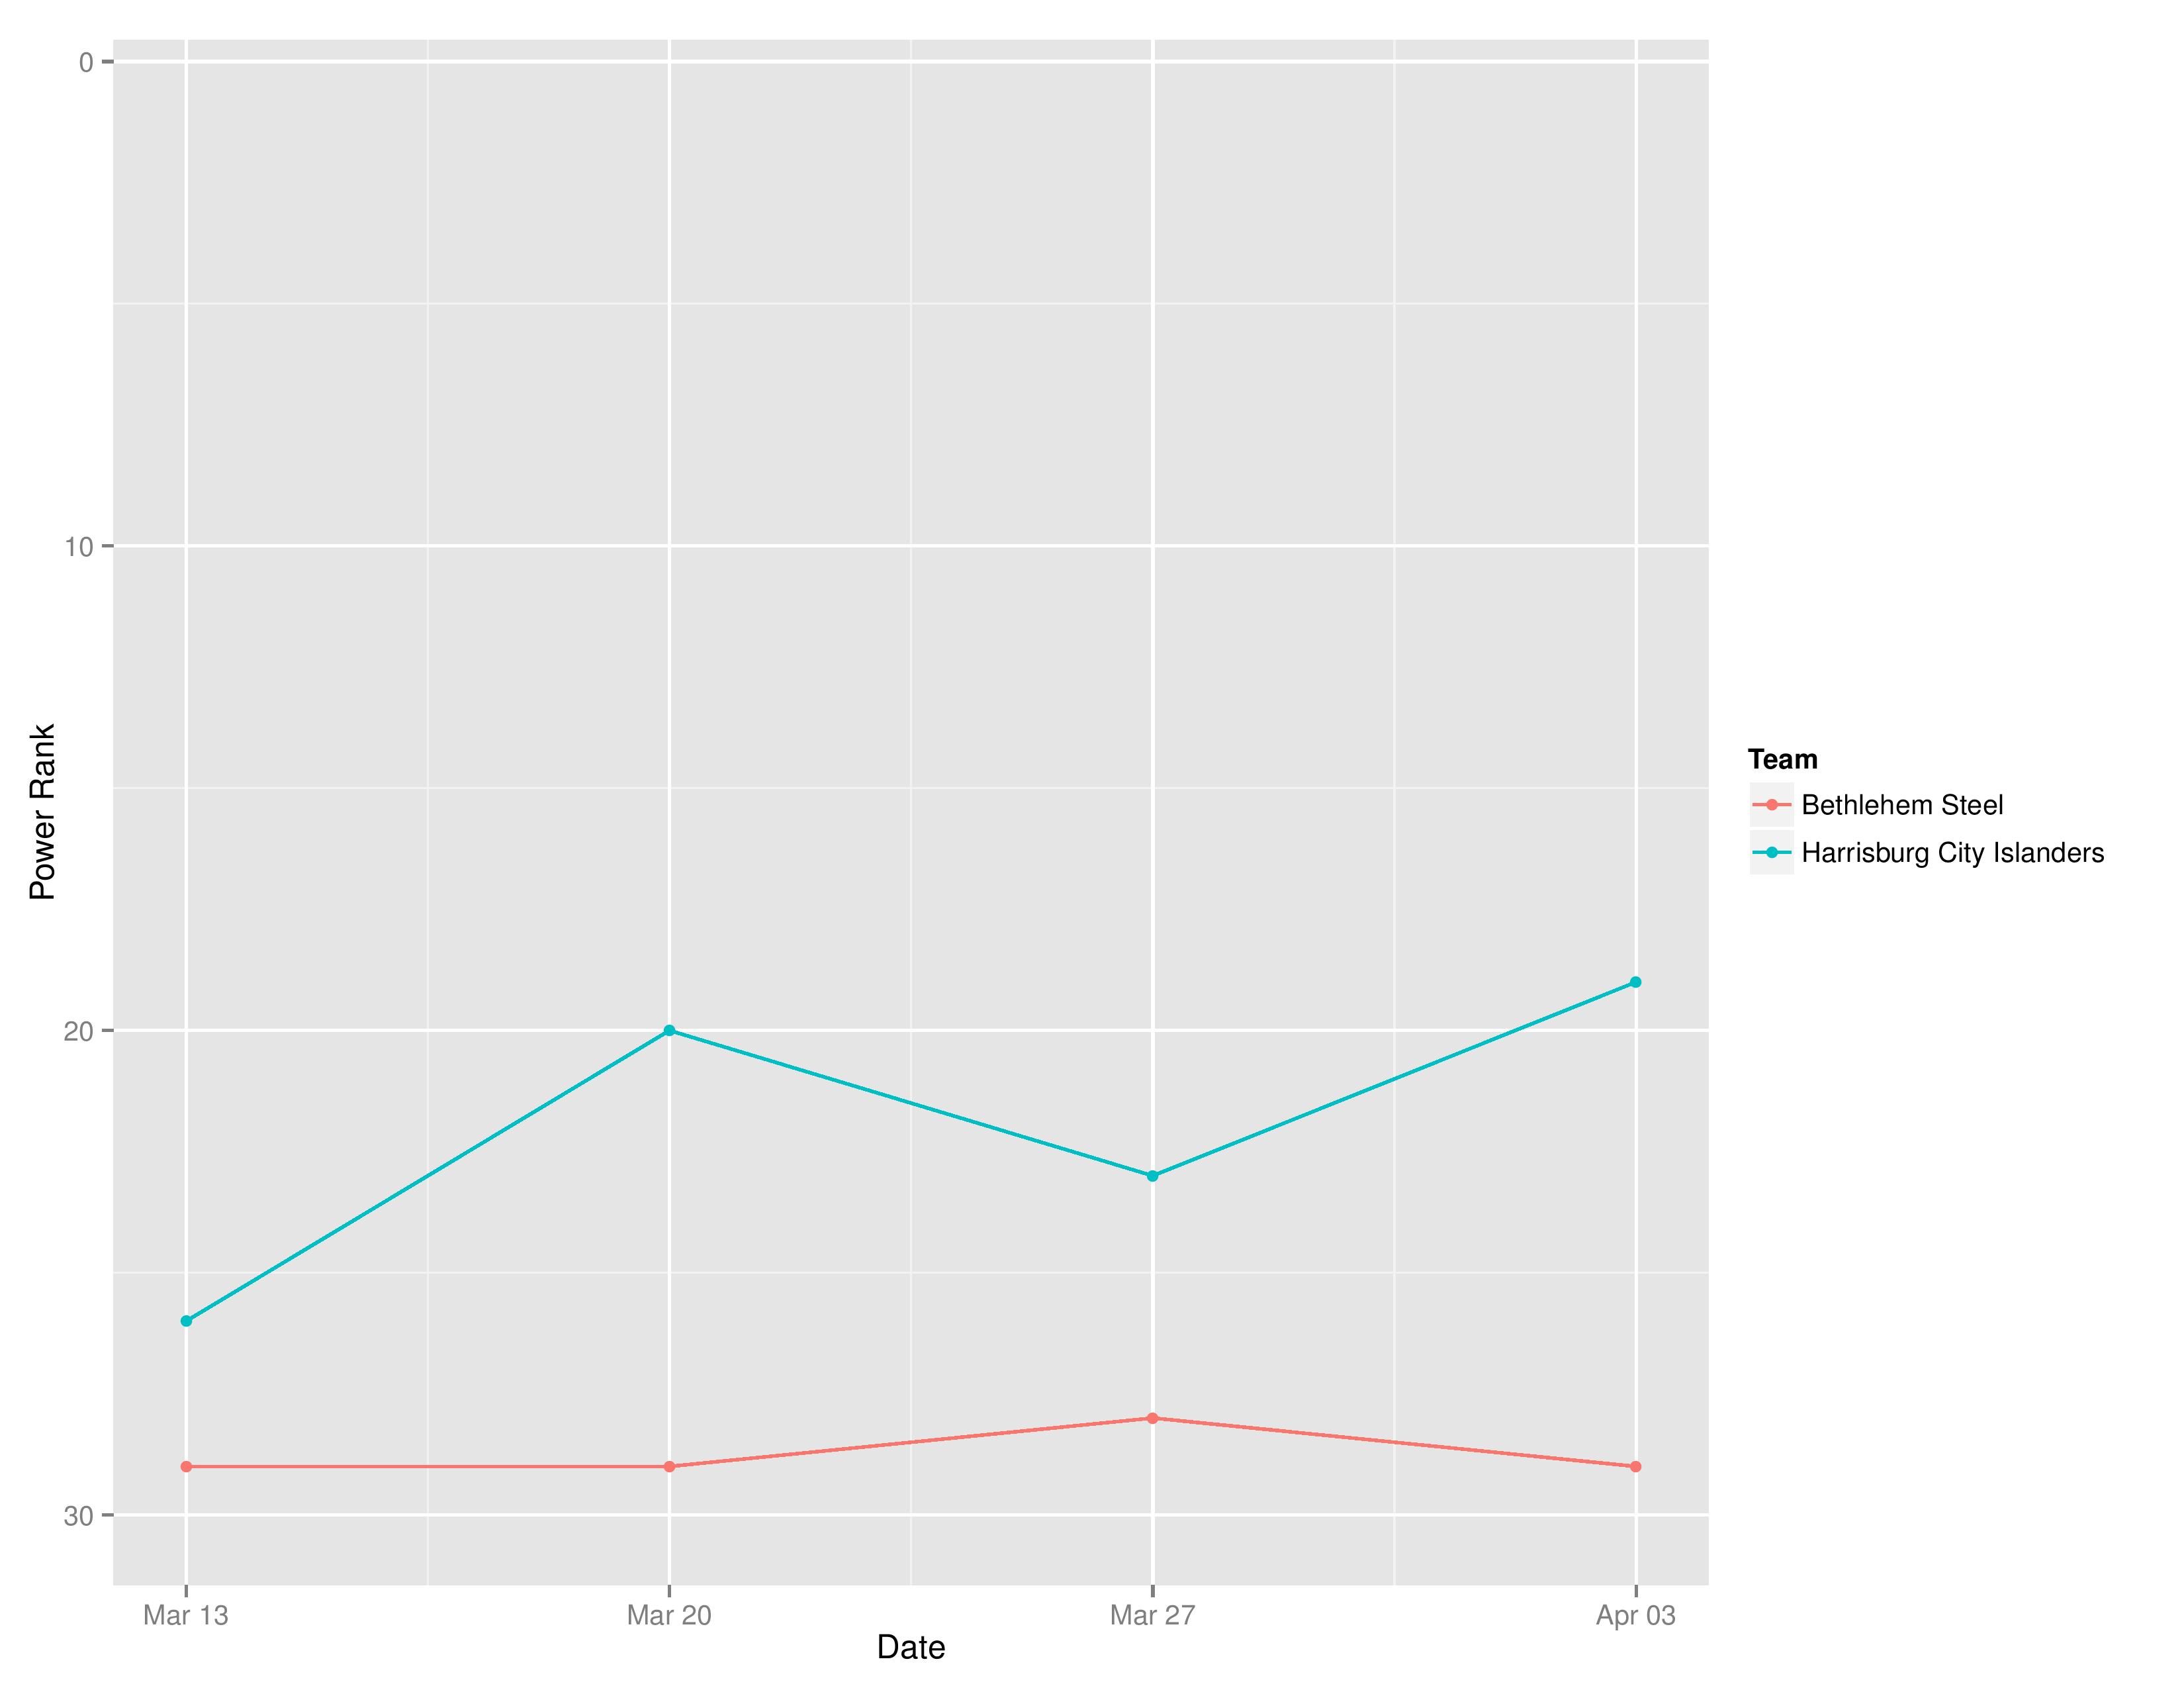
The following shows the evolution of SEBA’s power rankings for the USL East over time.
Playoffs probability and more
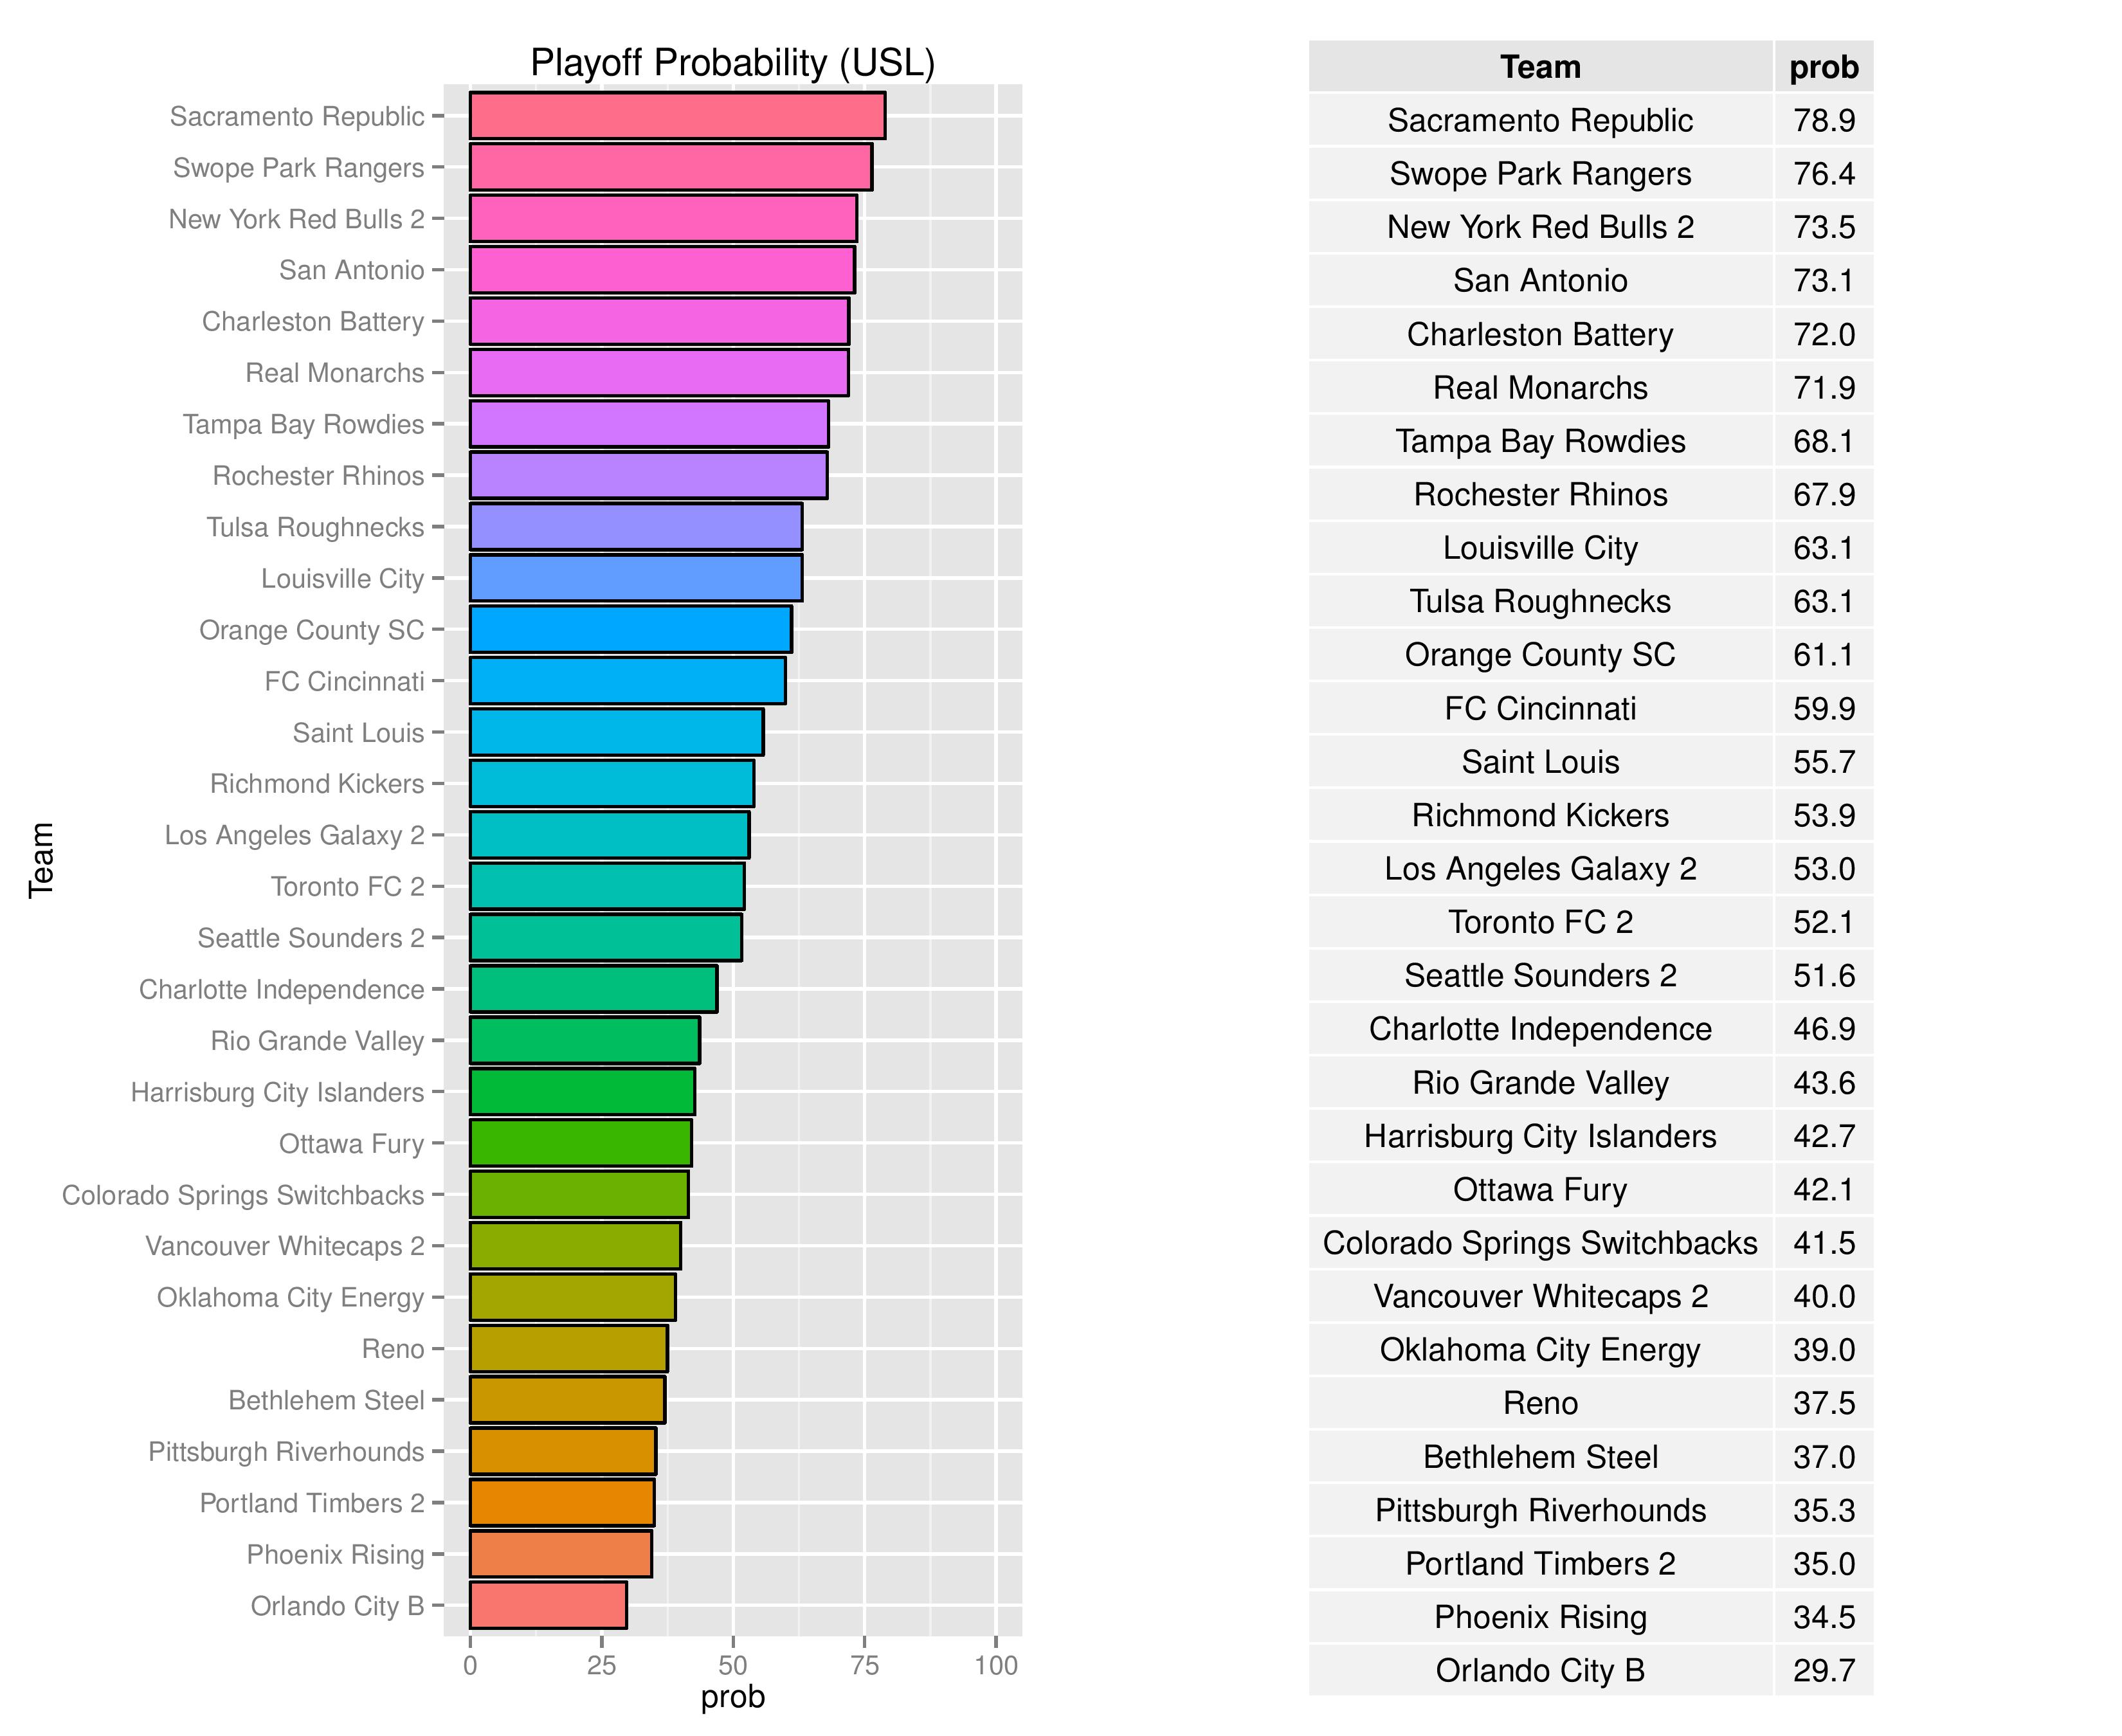
Bethlehem’s playoff odds decreased from 43.8% to 37% and Harrisburg City’s odds increased from 42.2% to 42.7% in making the playoffs.
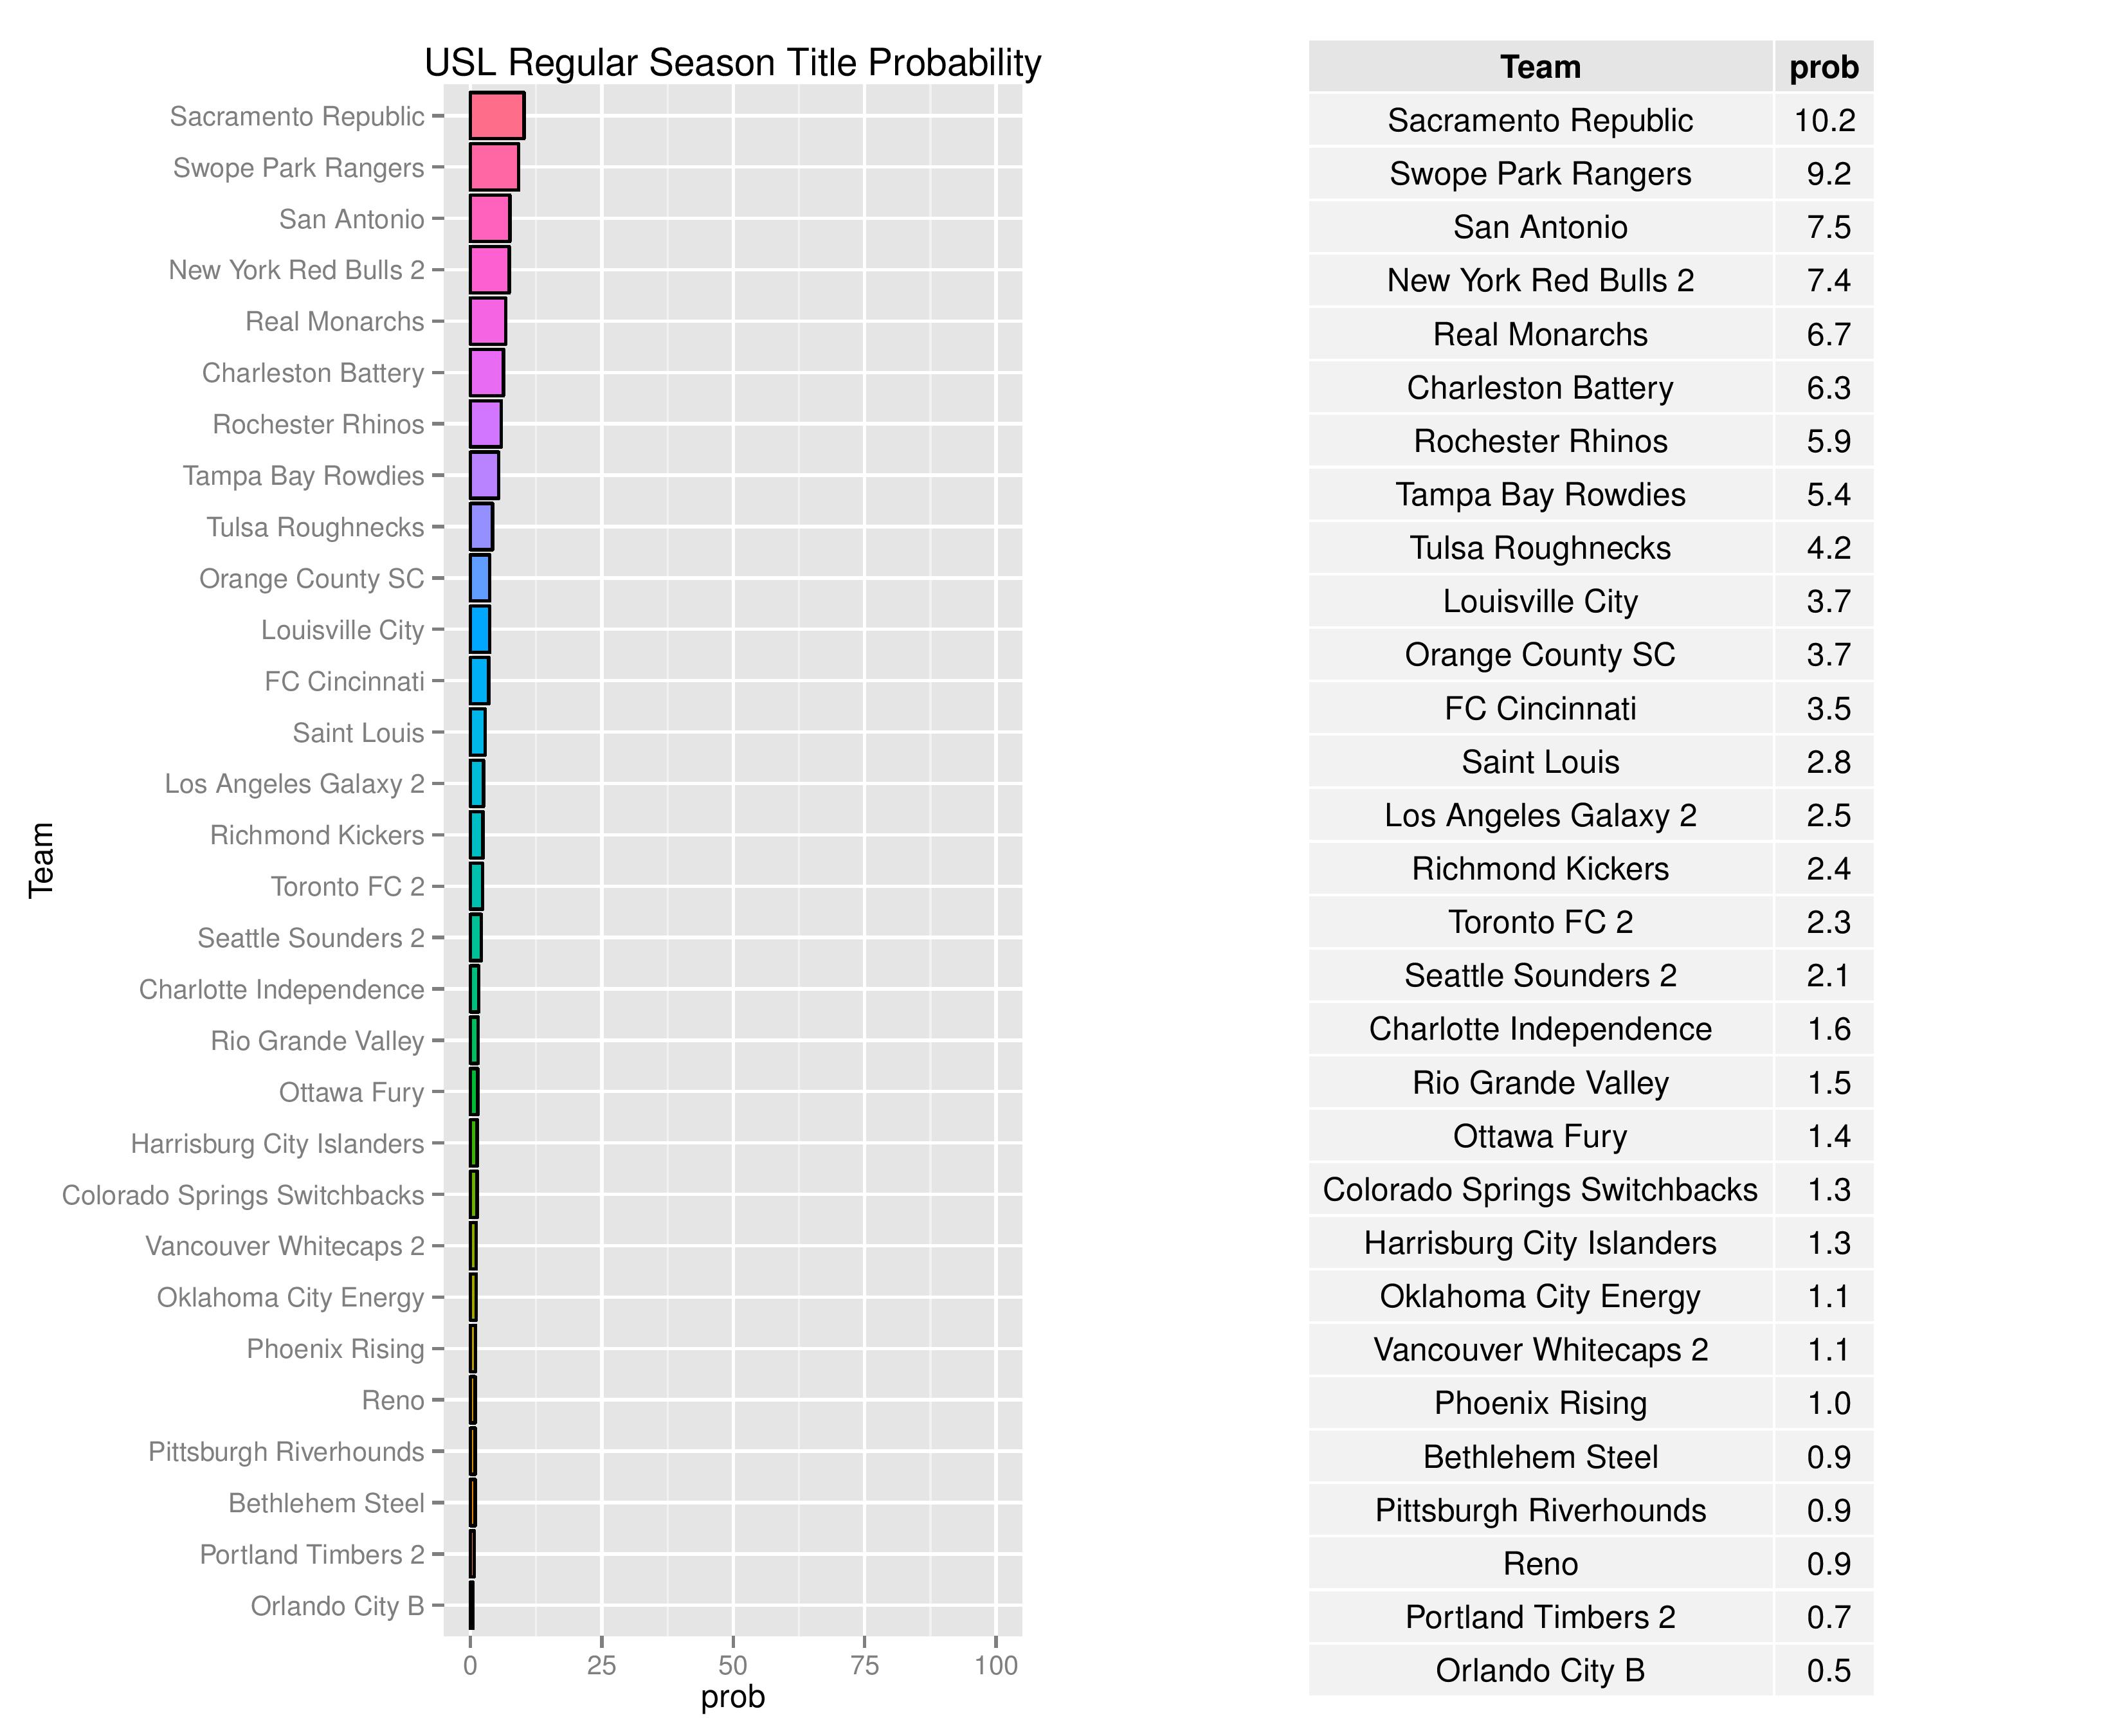
Bethlehem’s chances at winning the Regular Season Title decreased from 1.5% to 0.9% while Harrisburg City increased from 1.1% to 1.3%.
Bethlehem’s odds at becoming the USL Champion have decreased to 1.8% from 2.1% while Harrisburg City’s increased to 2.2% from 2.1%.

The USOC odds for USL clubs alone are as follows. Harrisburg increased to 0.8% odds from 0.5%. Bethlehem, being Philadelphia-controlled, is not eligible for the U.S. Open Cup.

Over time, we can see how the odds for different prizes change for Bethlehem and Harrisburg.
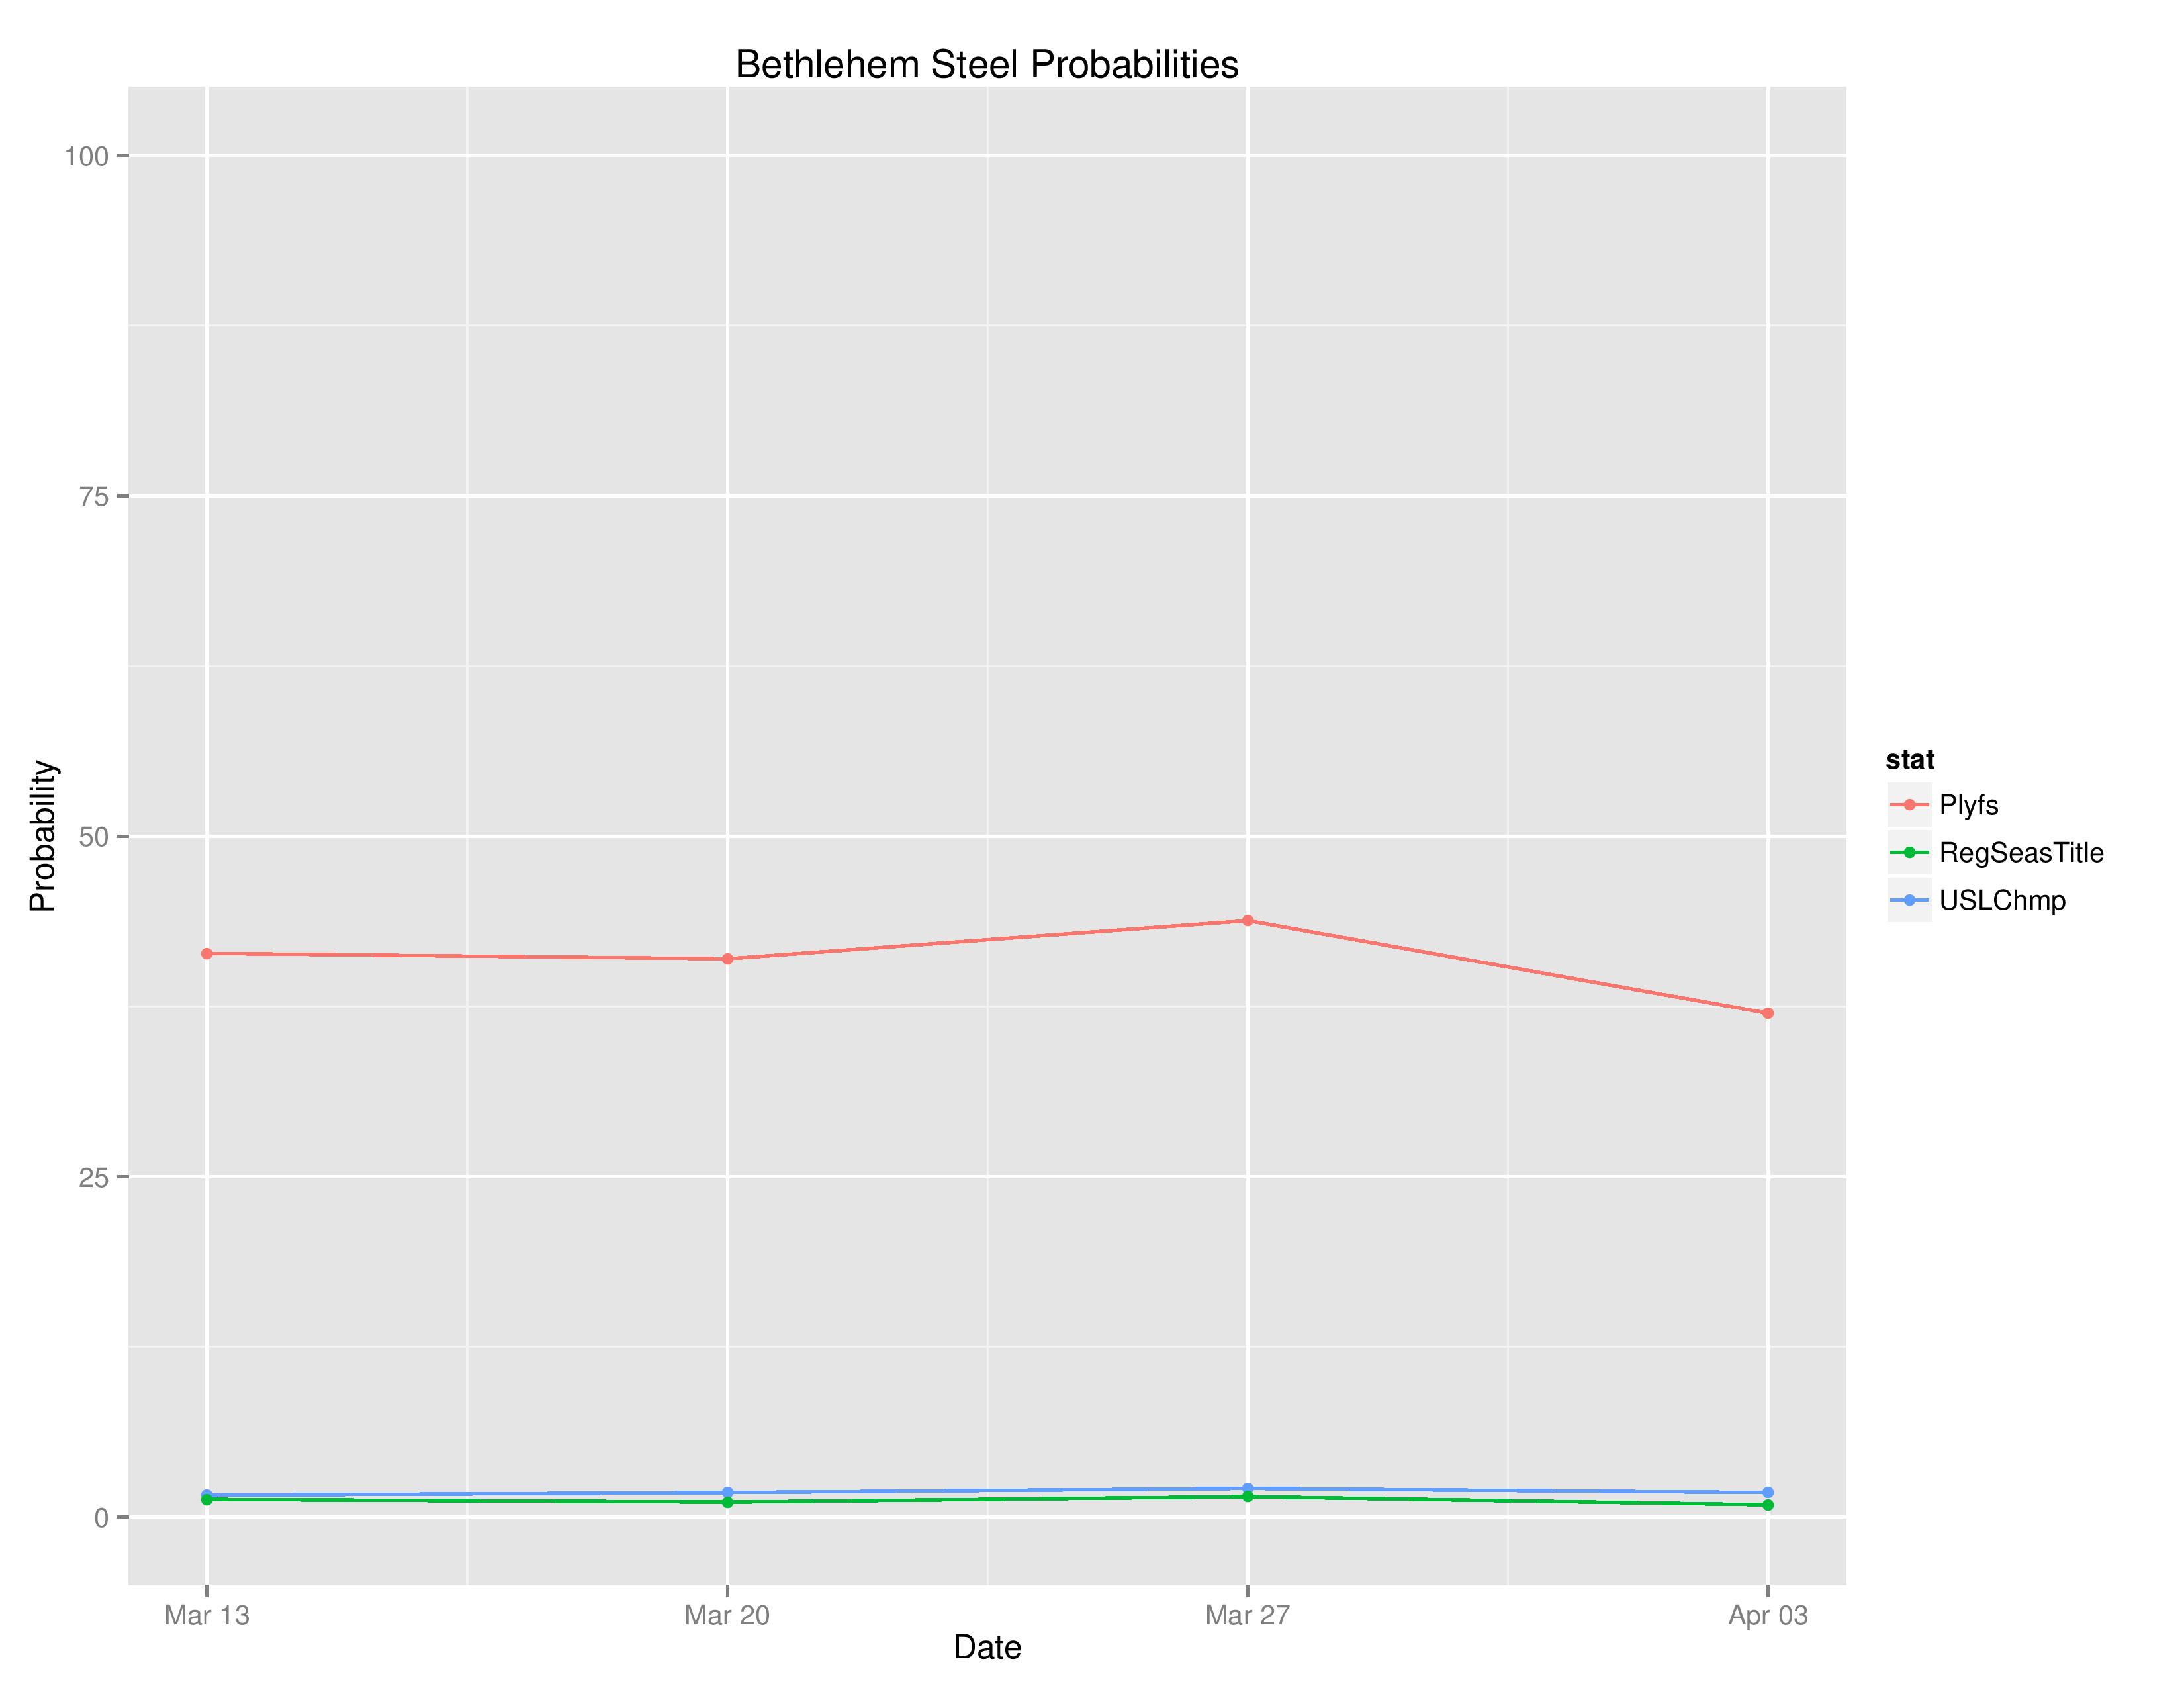
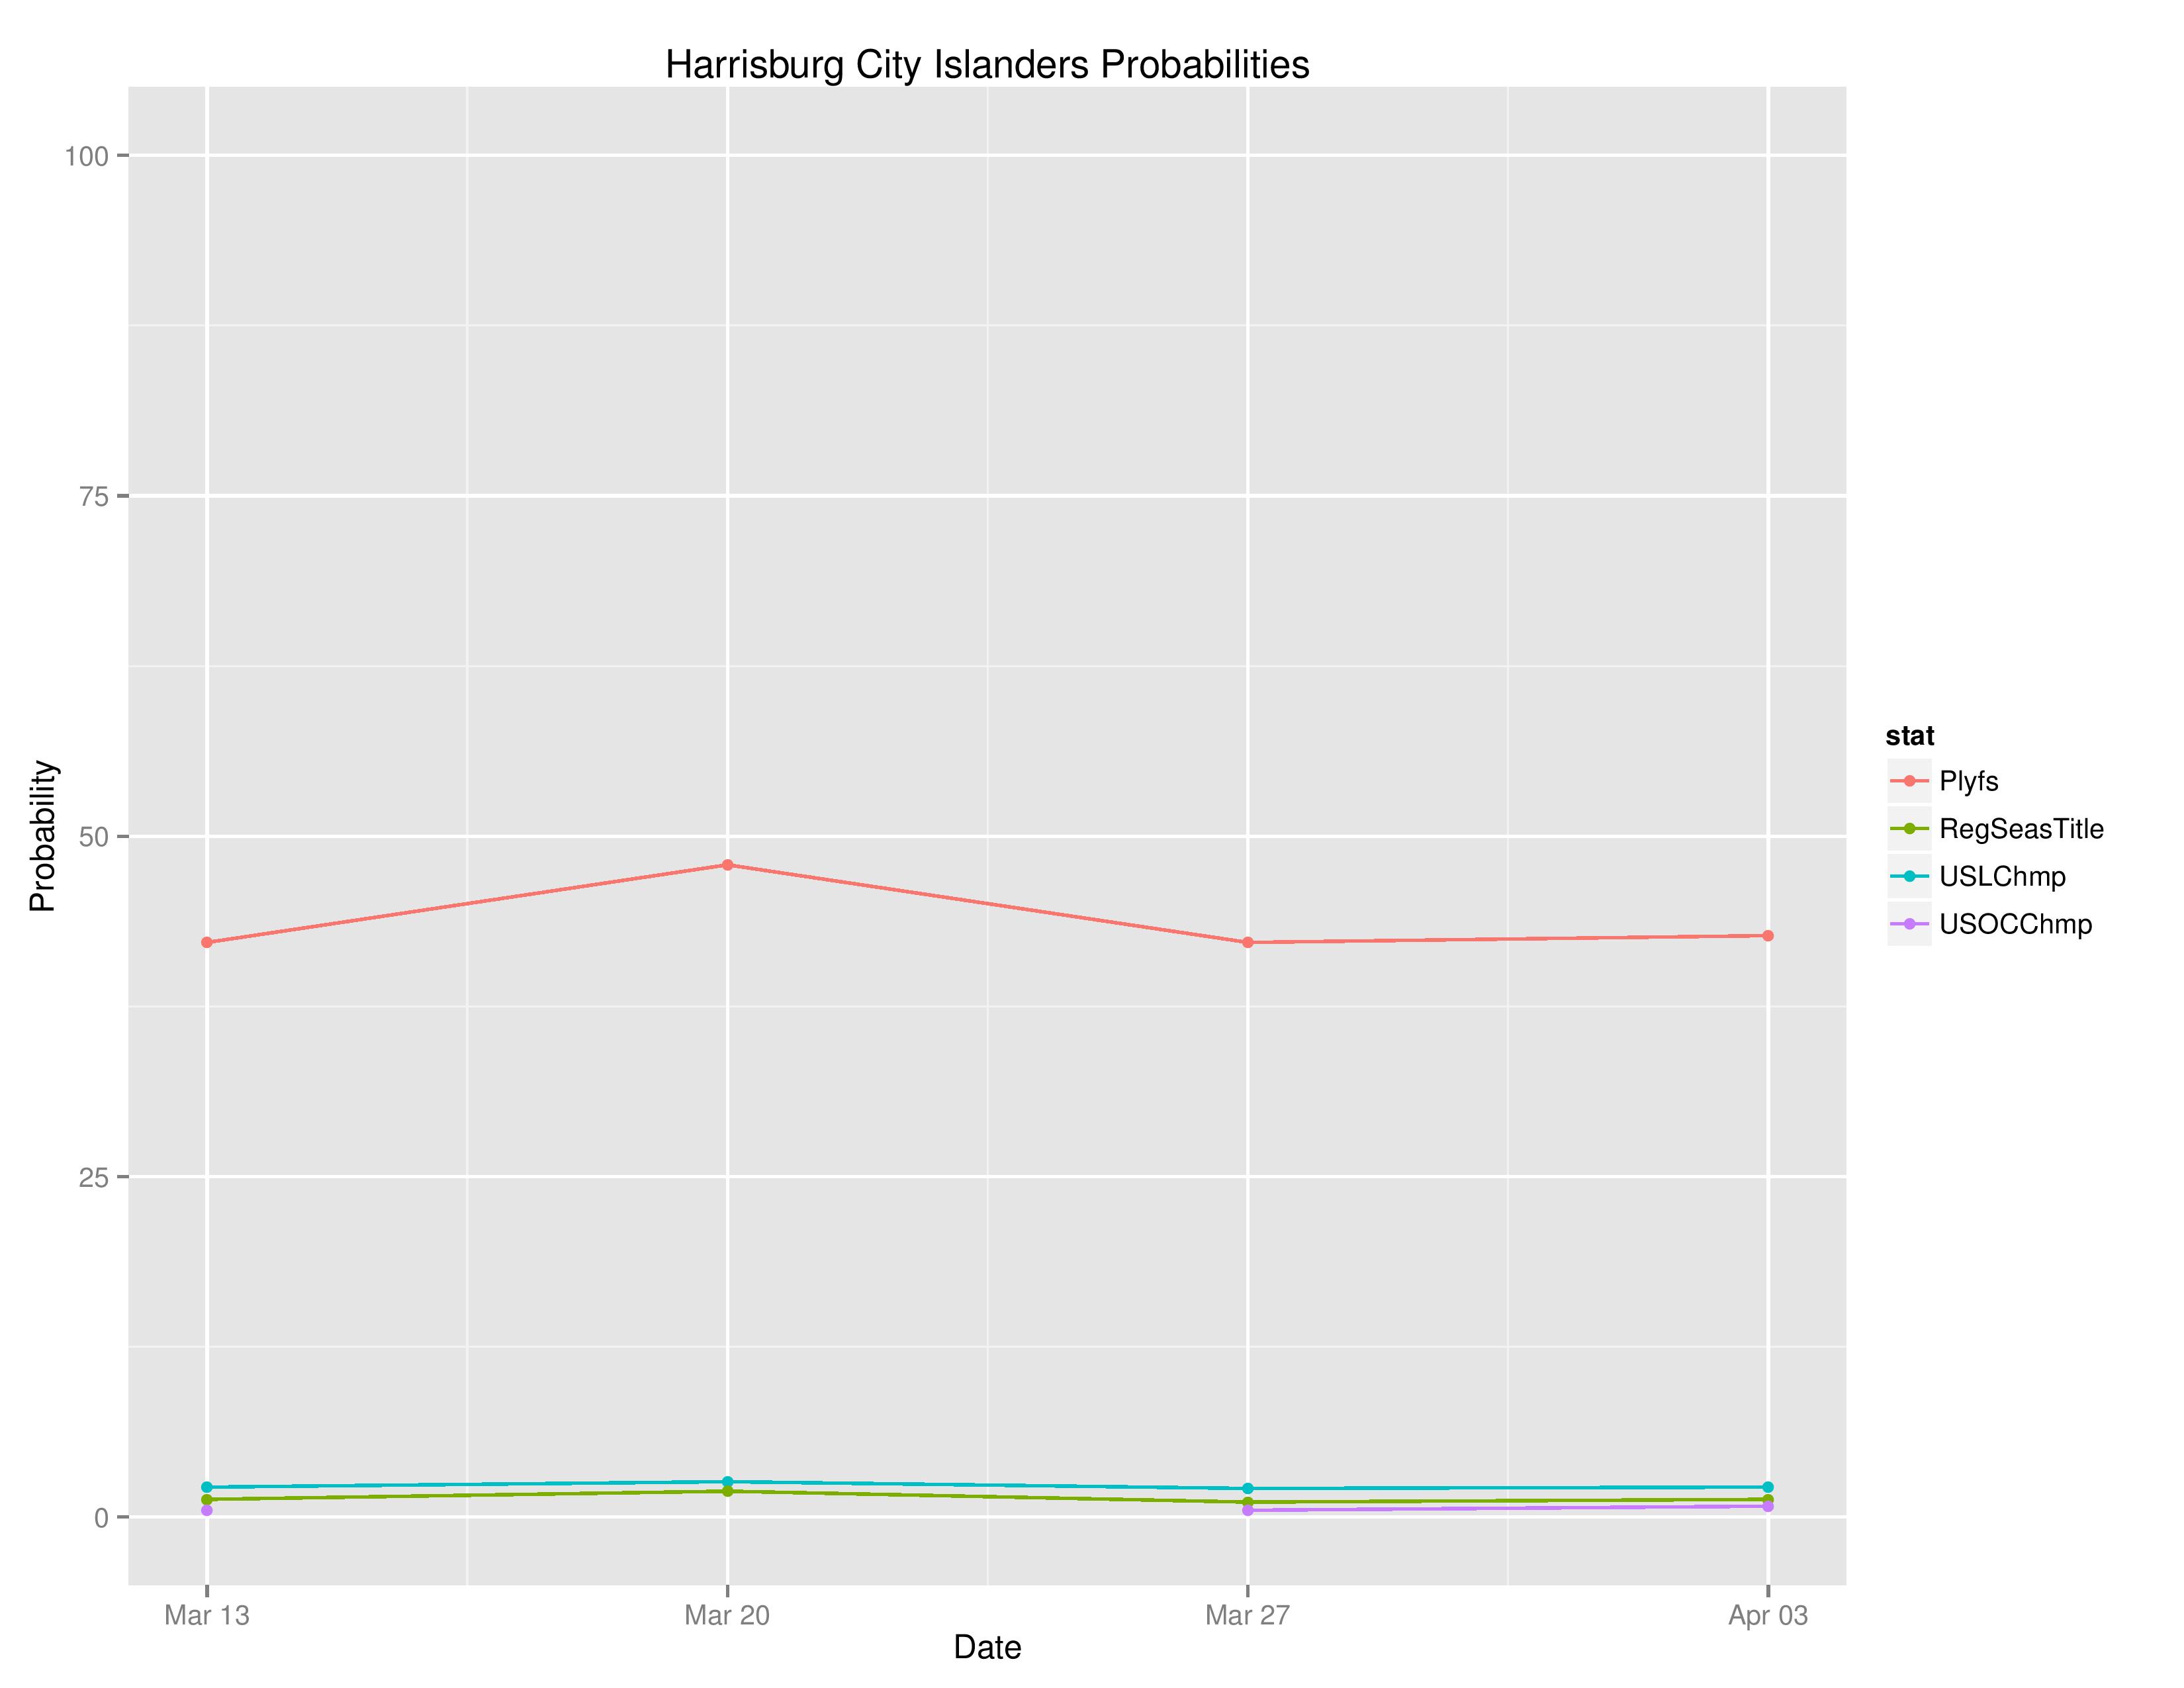
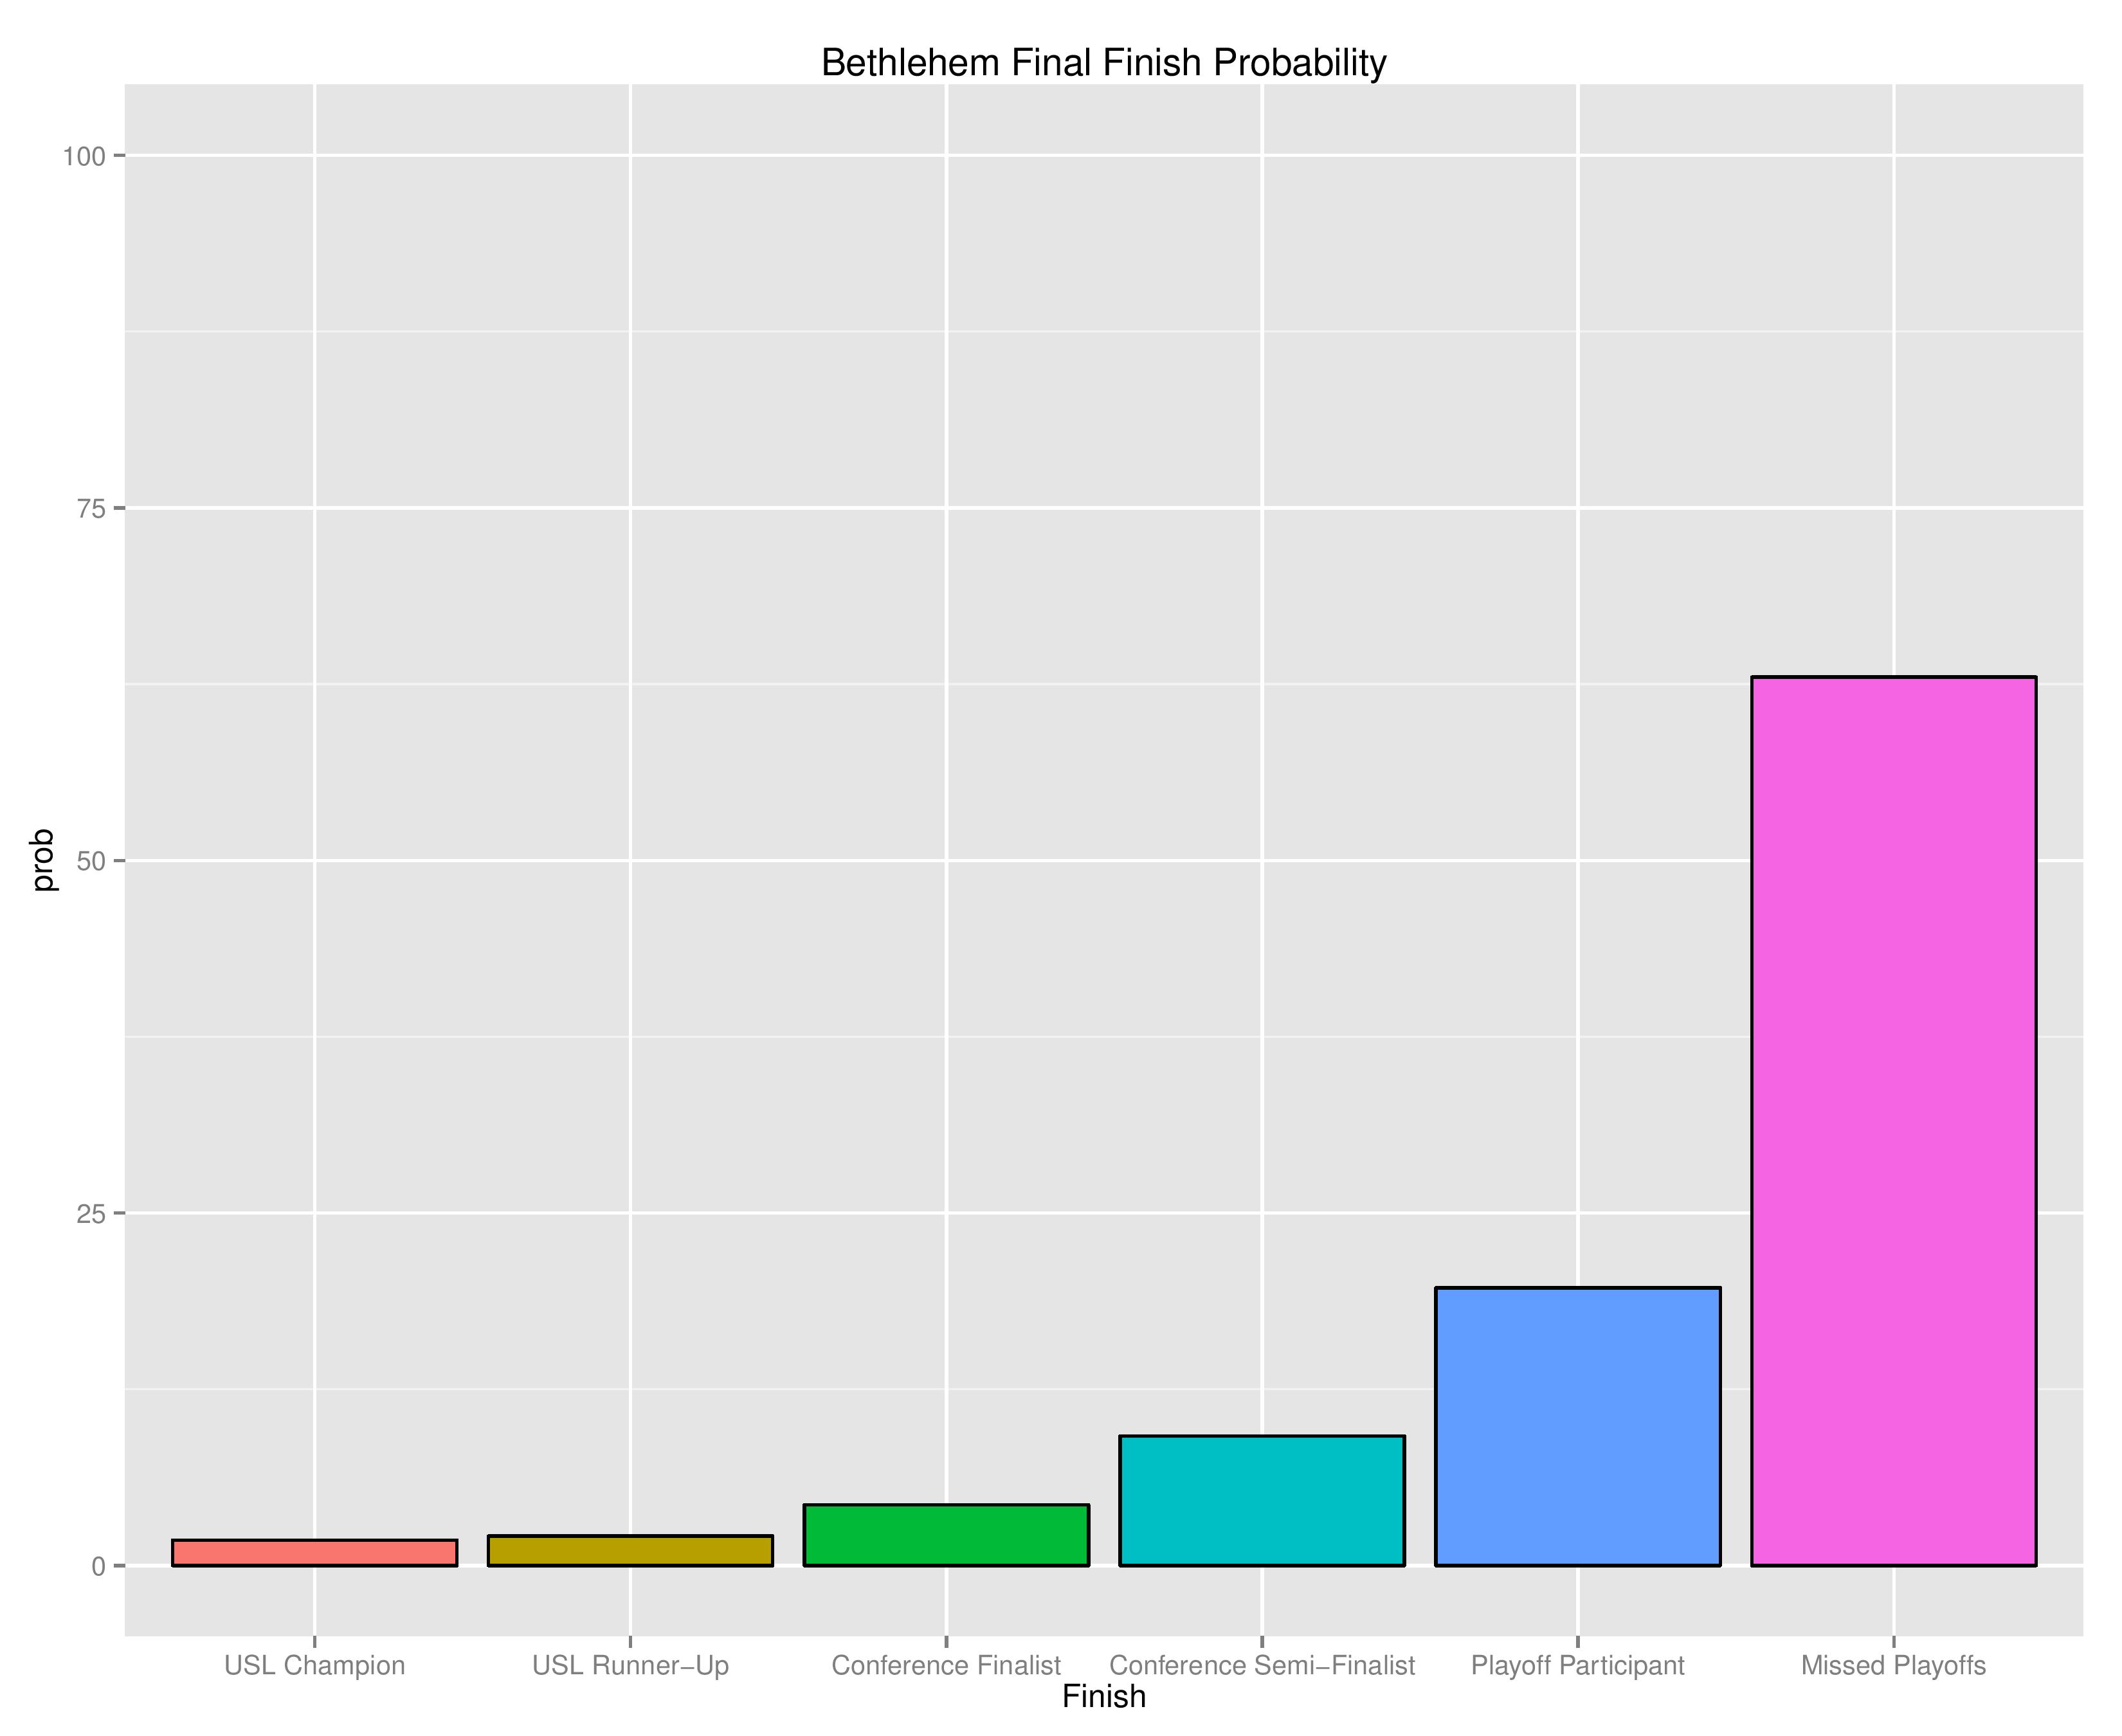
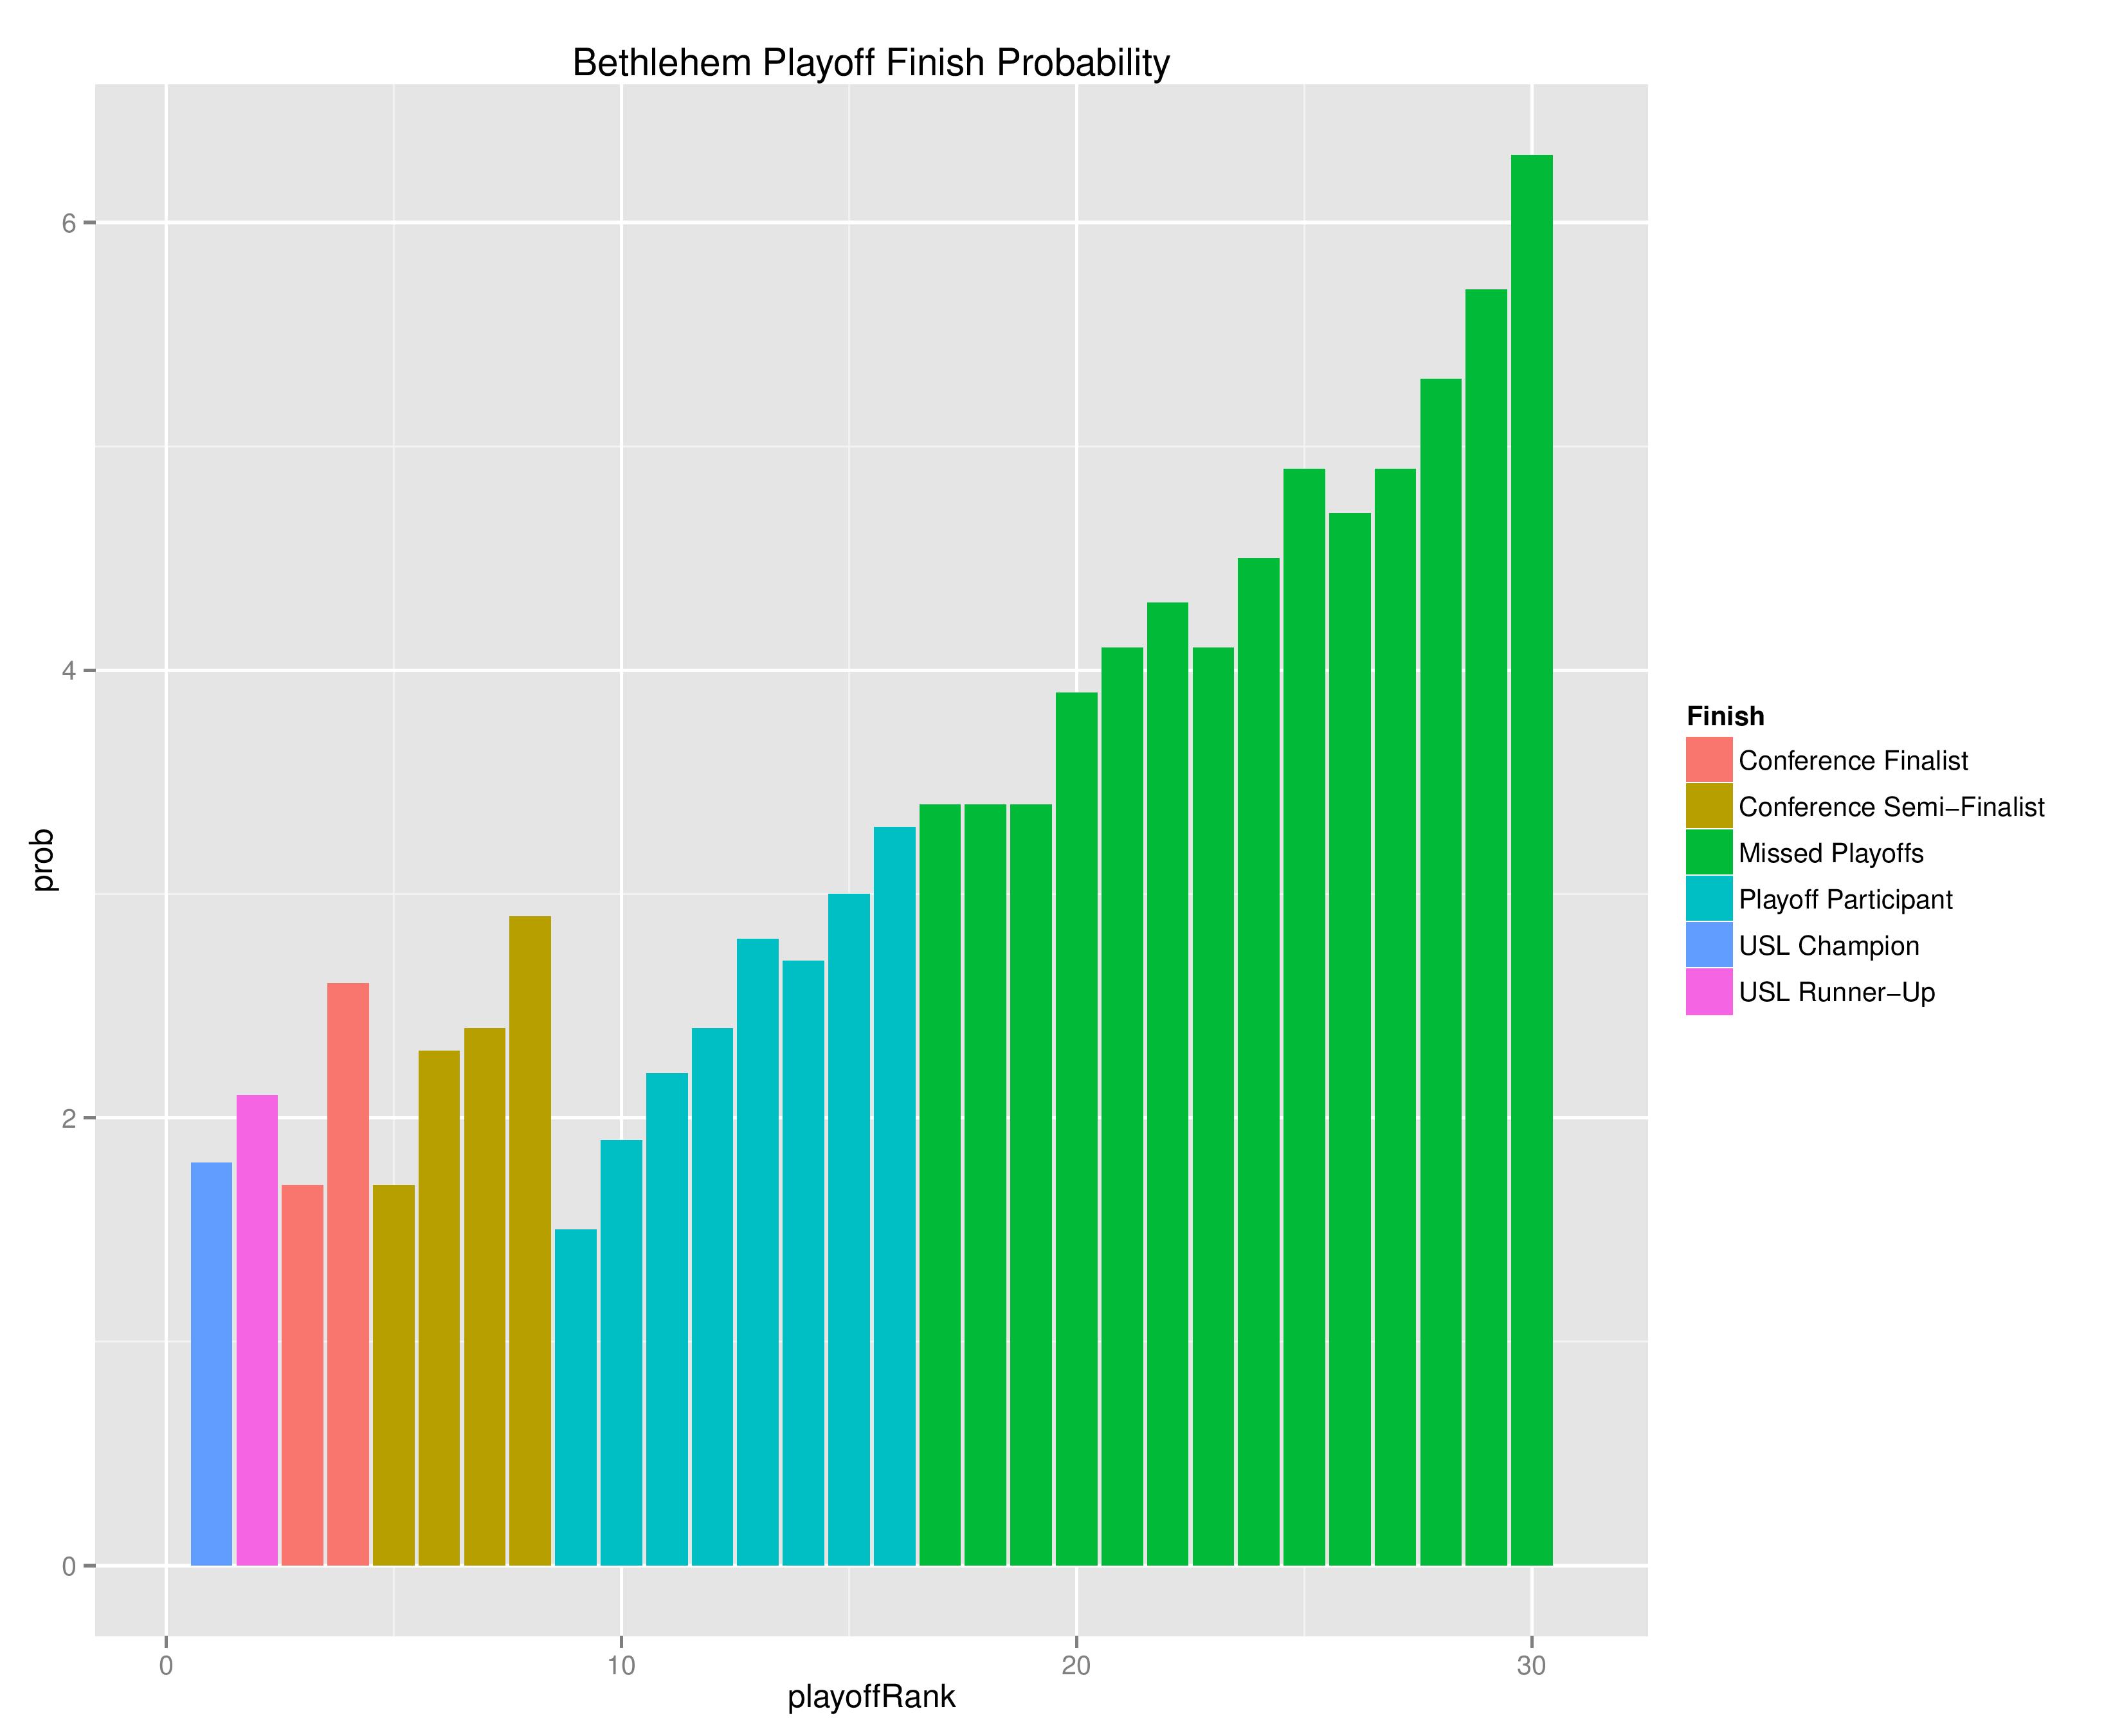
The following are probabilities for each category of outcomes for Bethlehem.
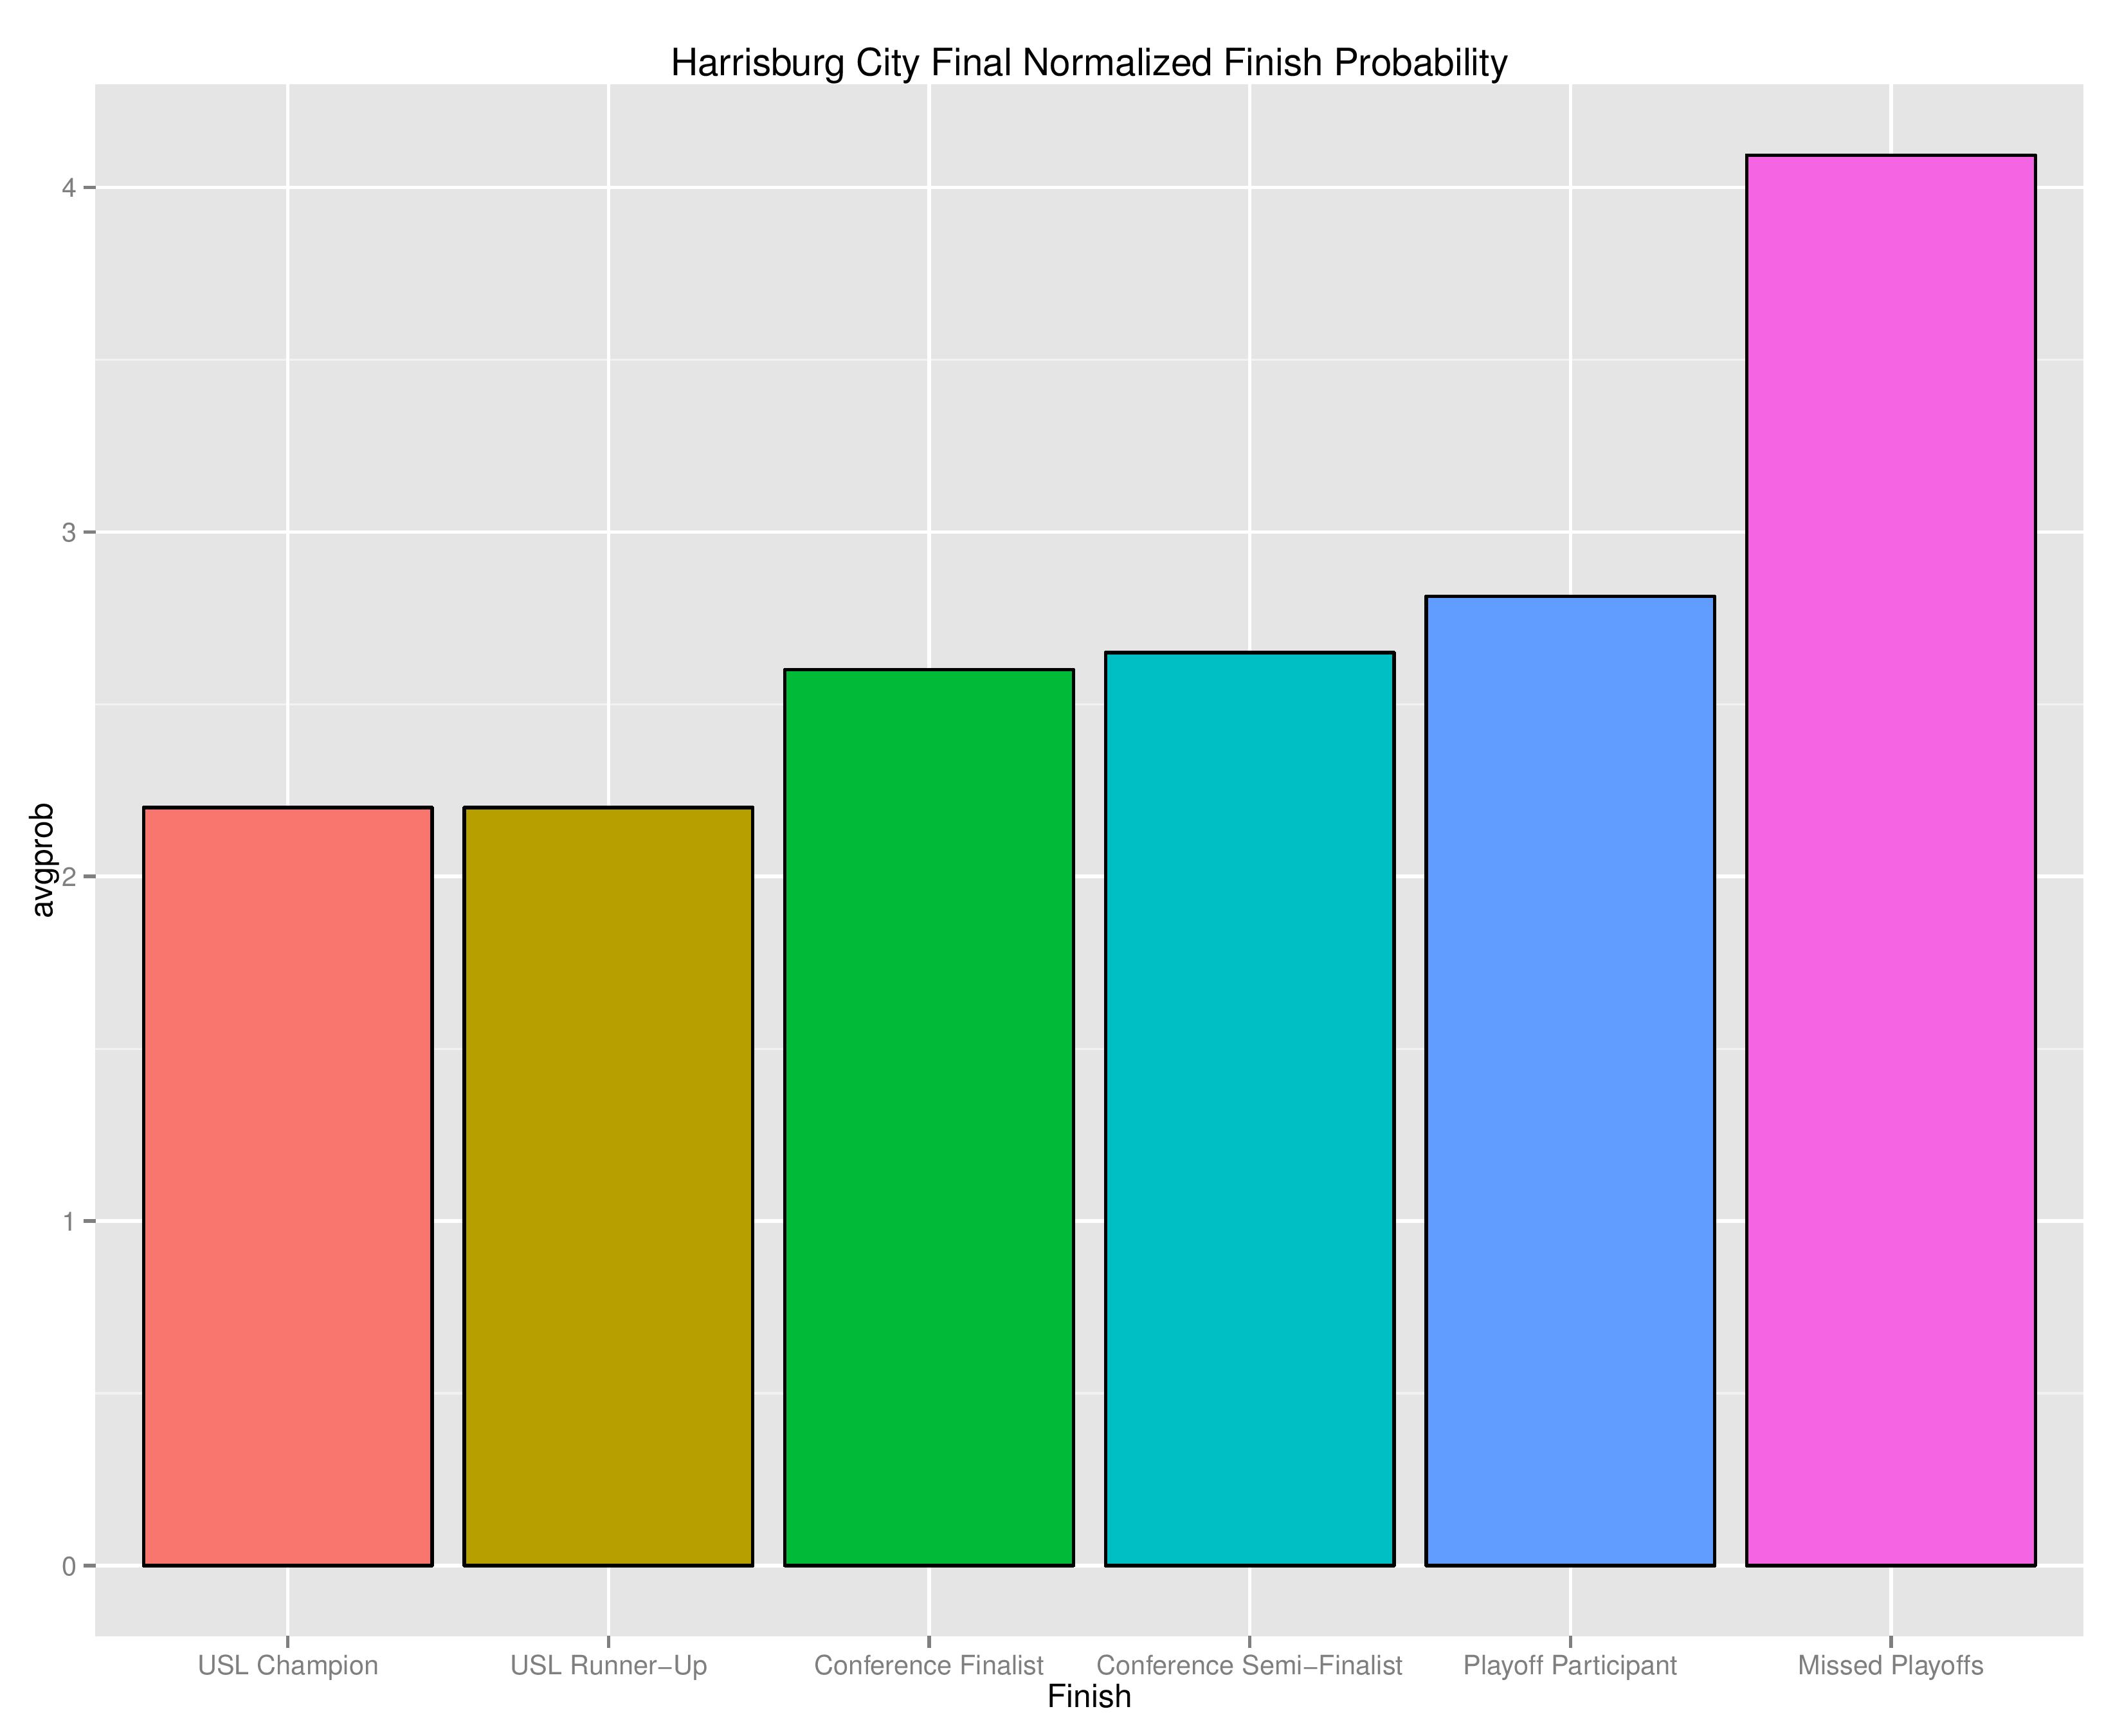
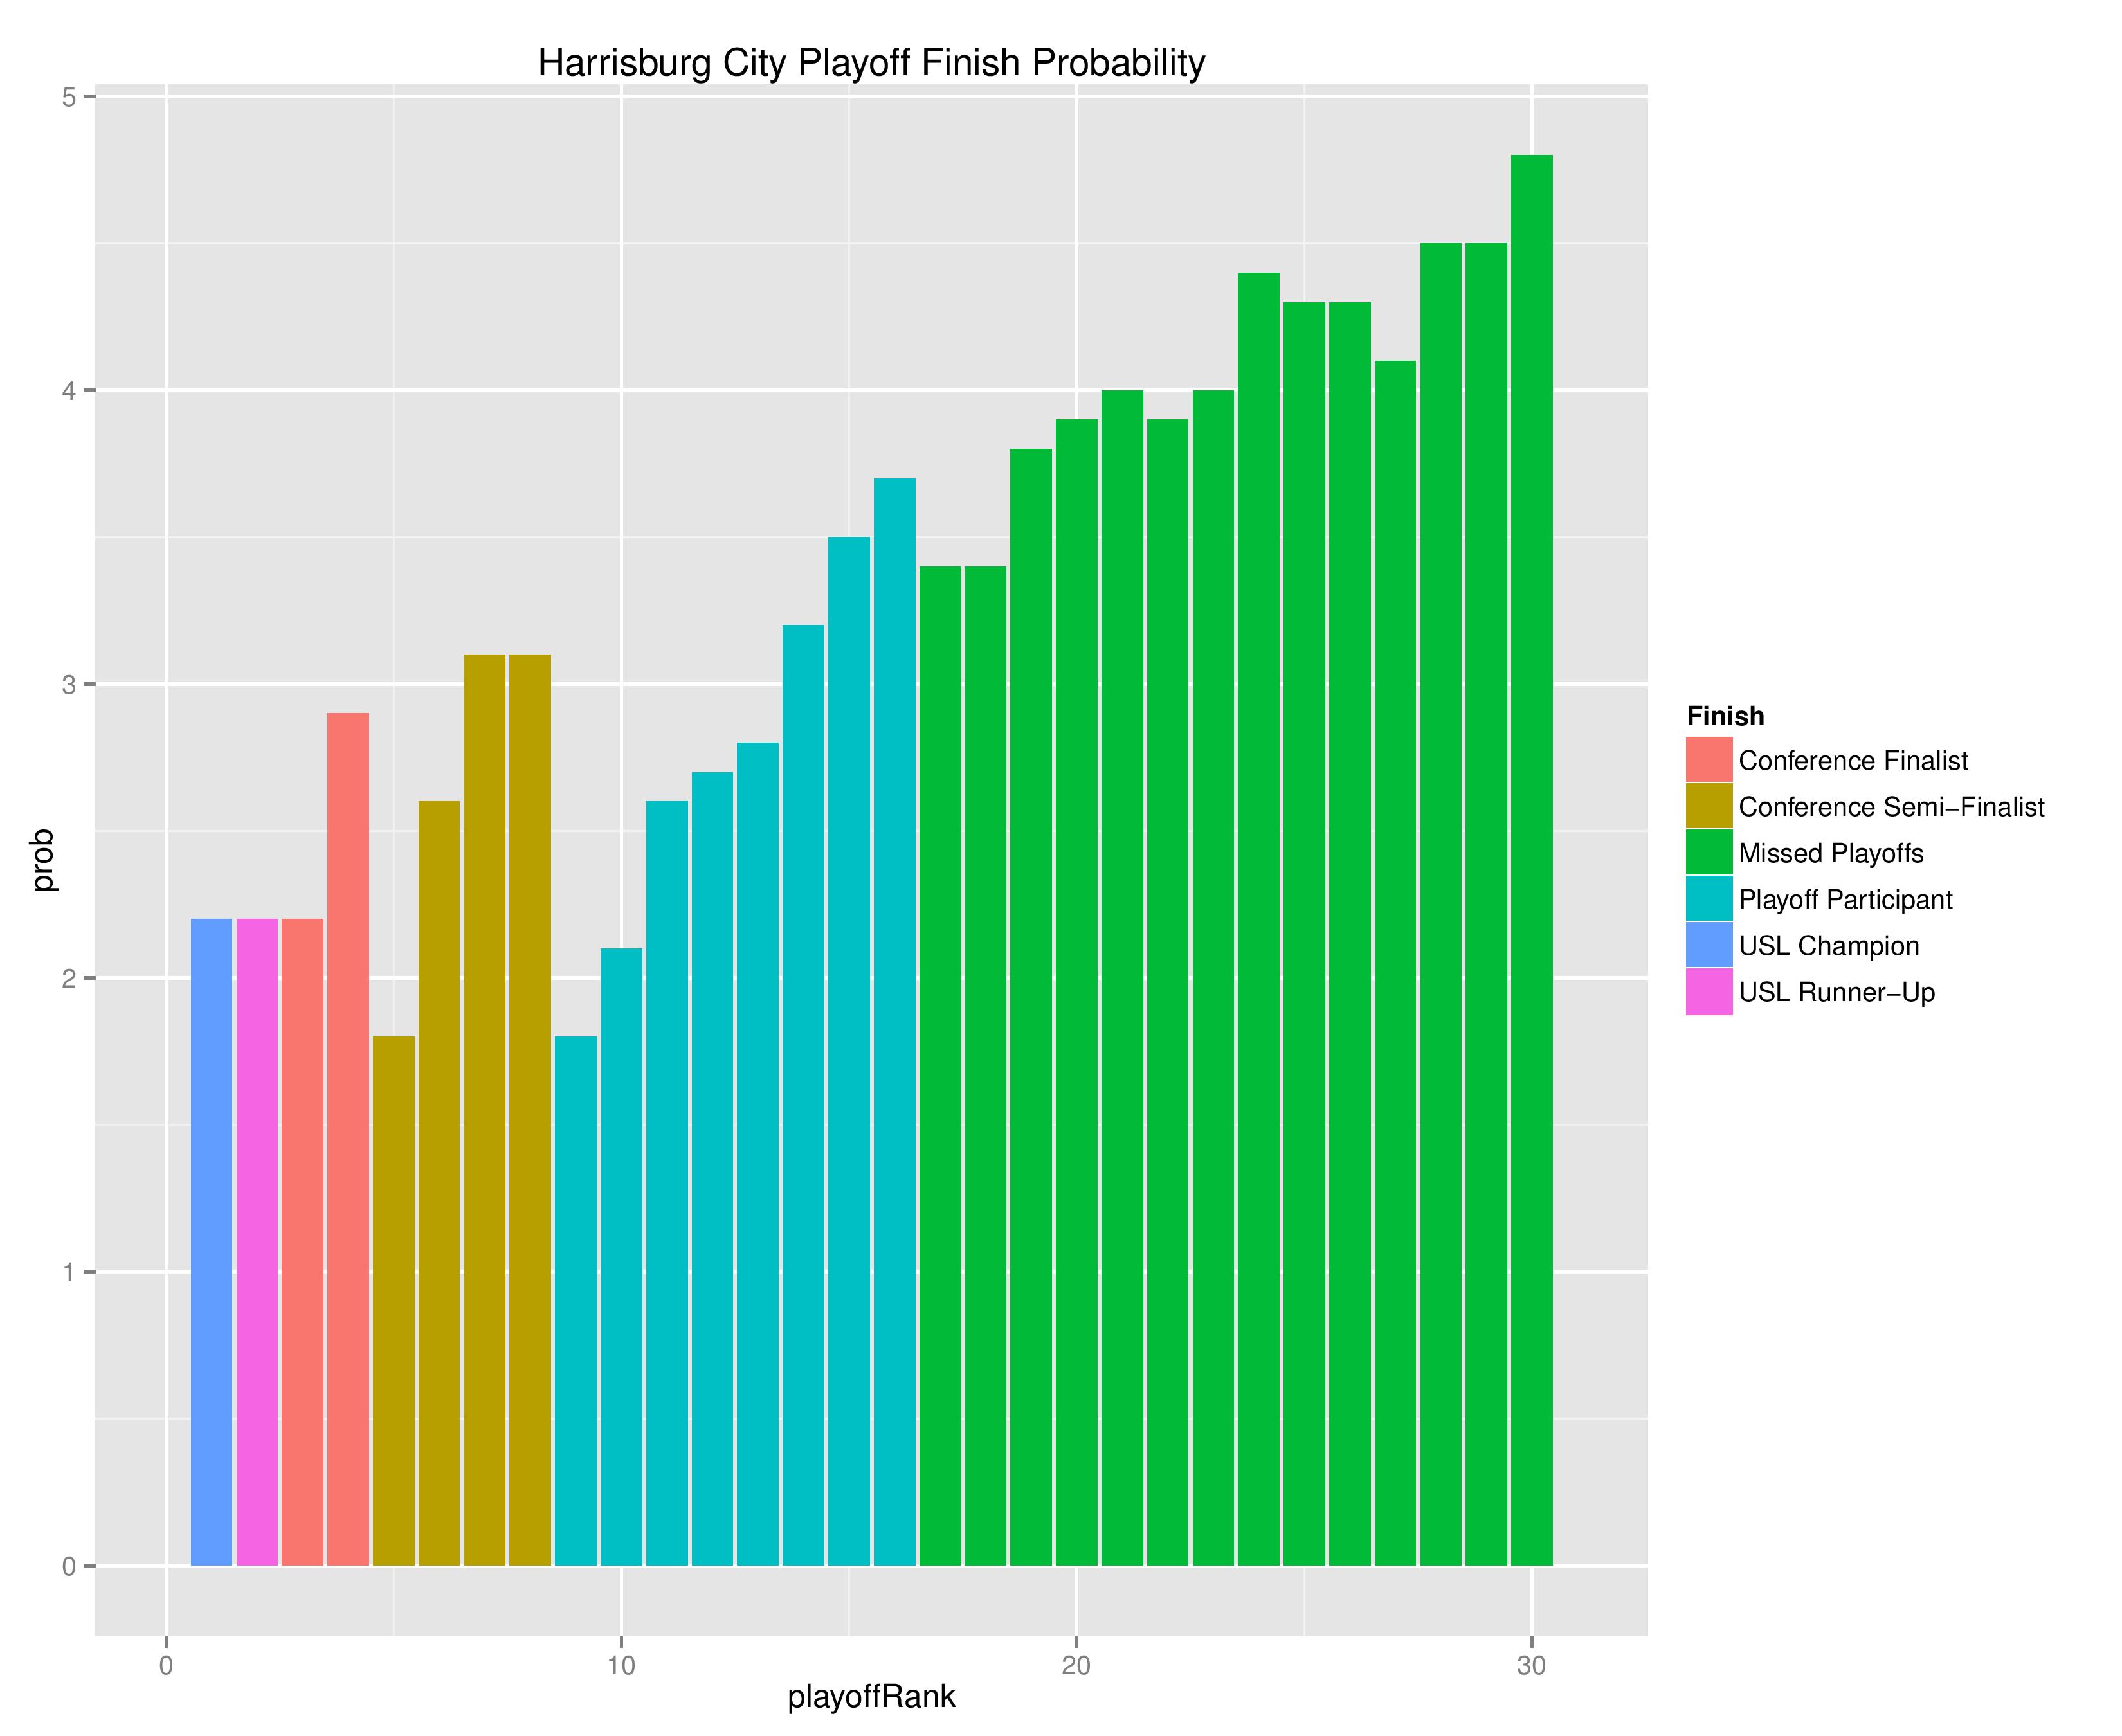
The following are probabilities for each category of outcomes for Harrisburg City.

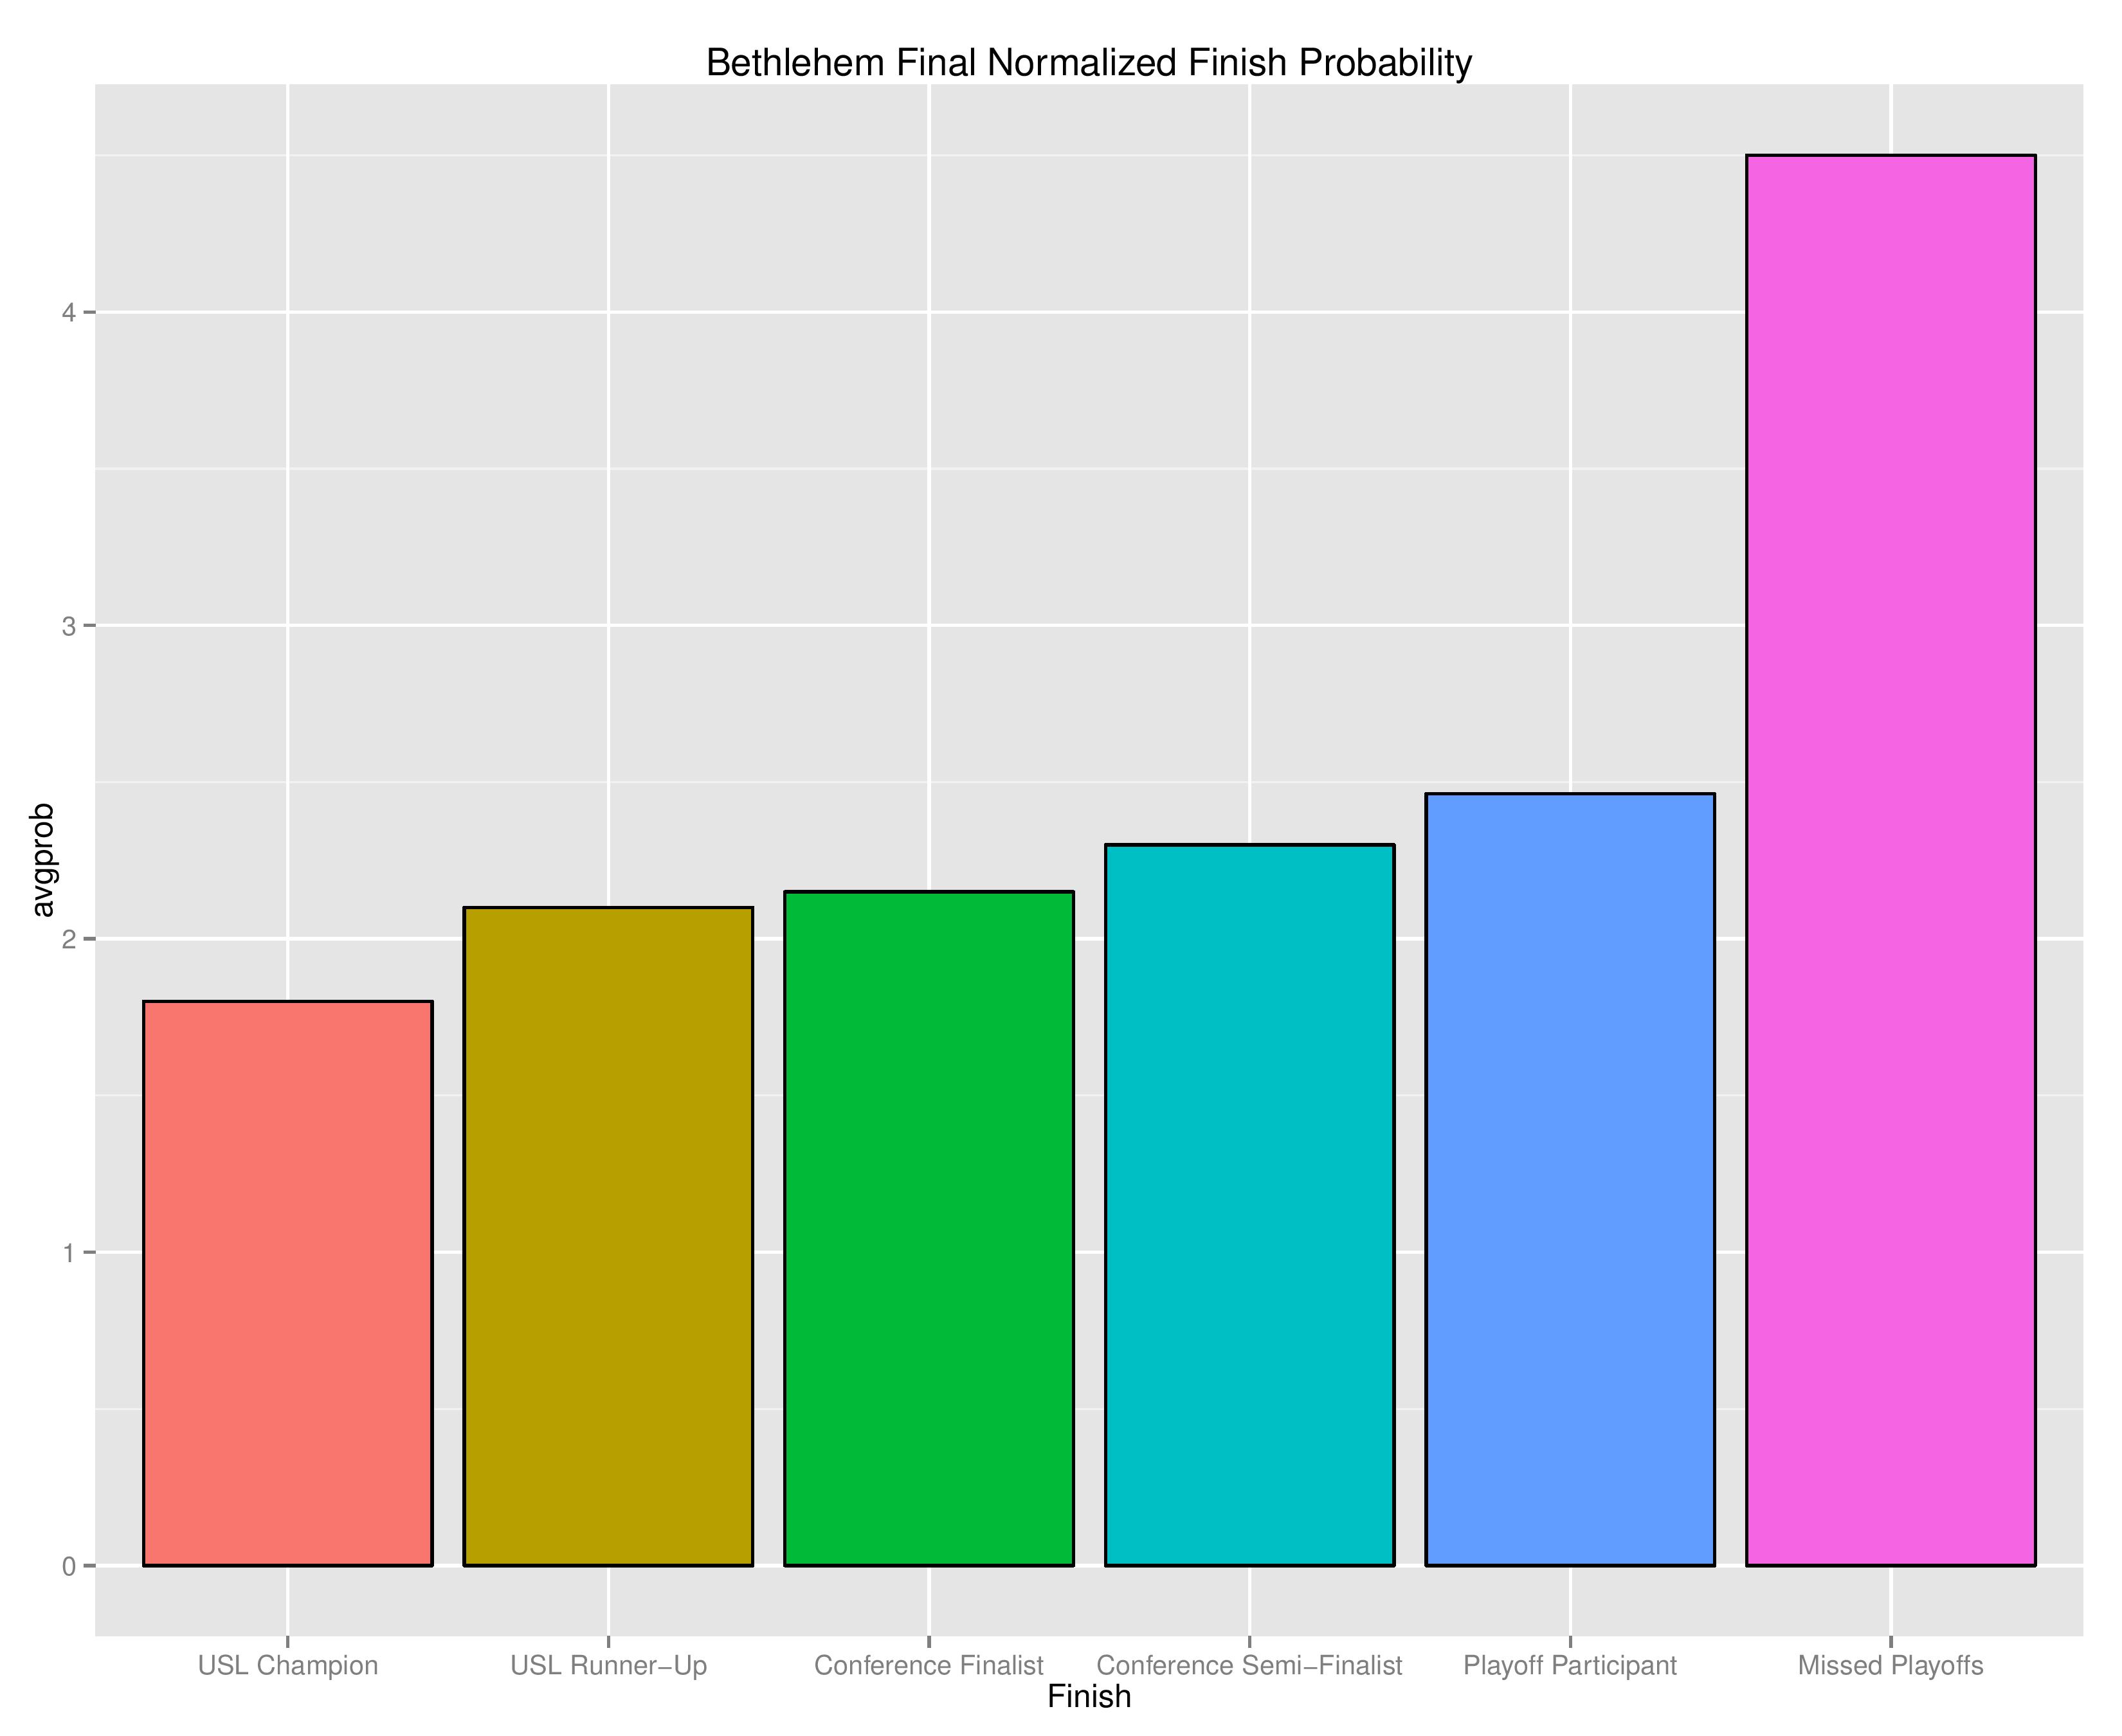
The following shows the relative probability of the prior categories. If the projection system were entirely random, these bars would be even, despite that “Missed Playoffs” is inherently 14 times more likely than “USL Champion.” The chart outlines where the club is headed. We begin with Bethlehem Steel.
The following shows the probability of each post-playoff ranking finish.
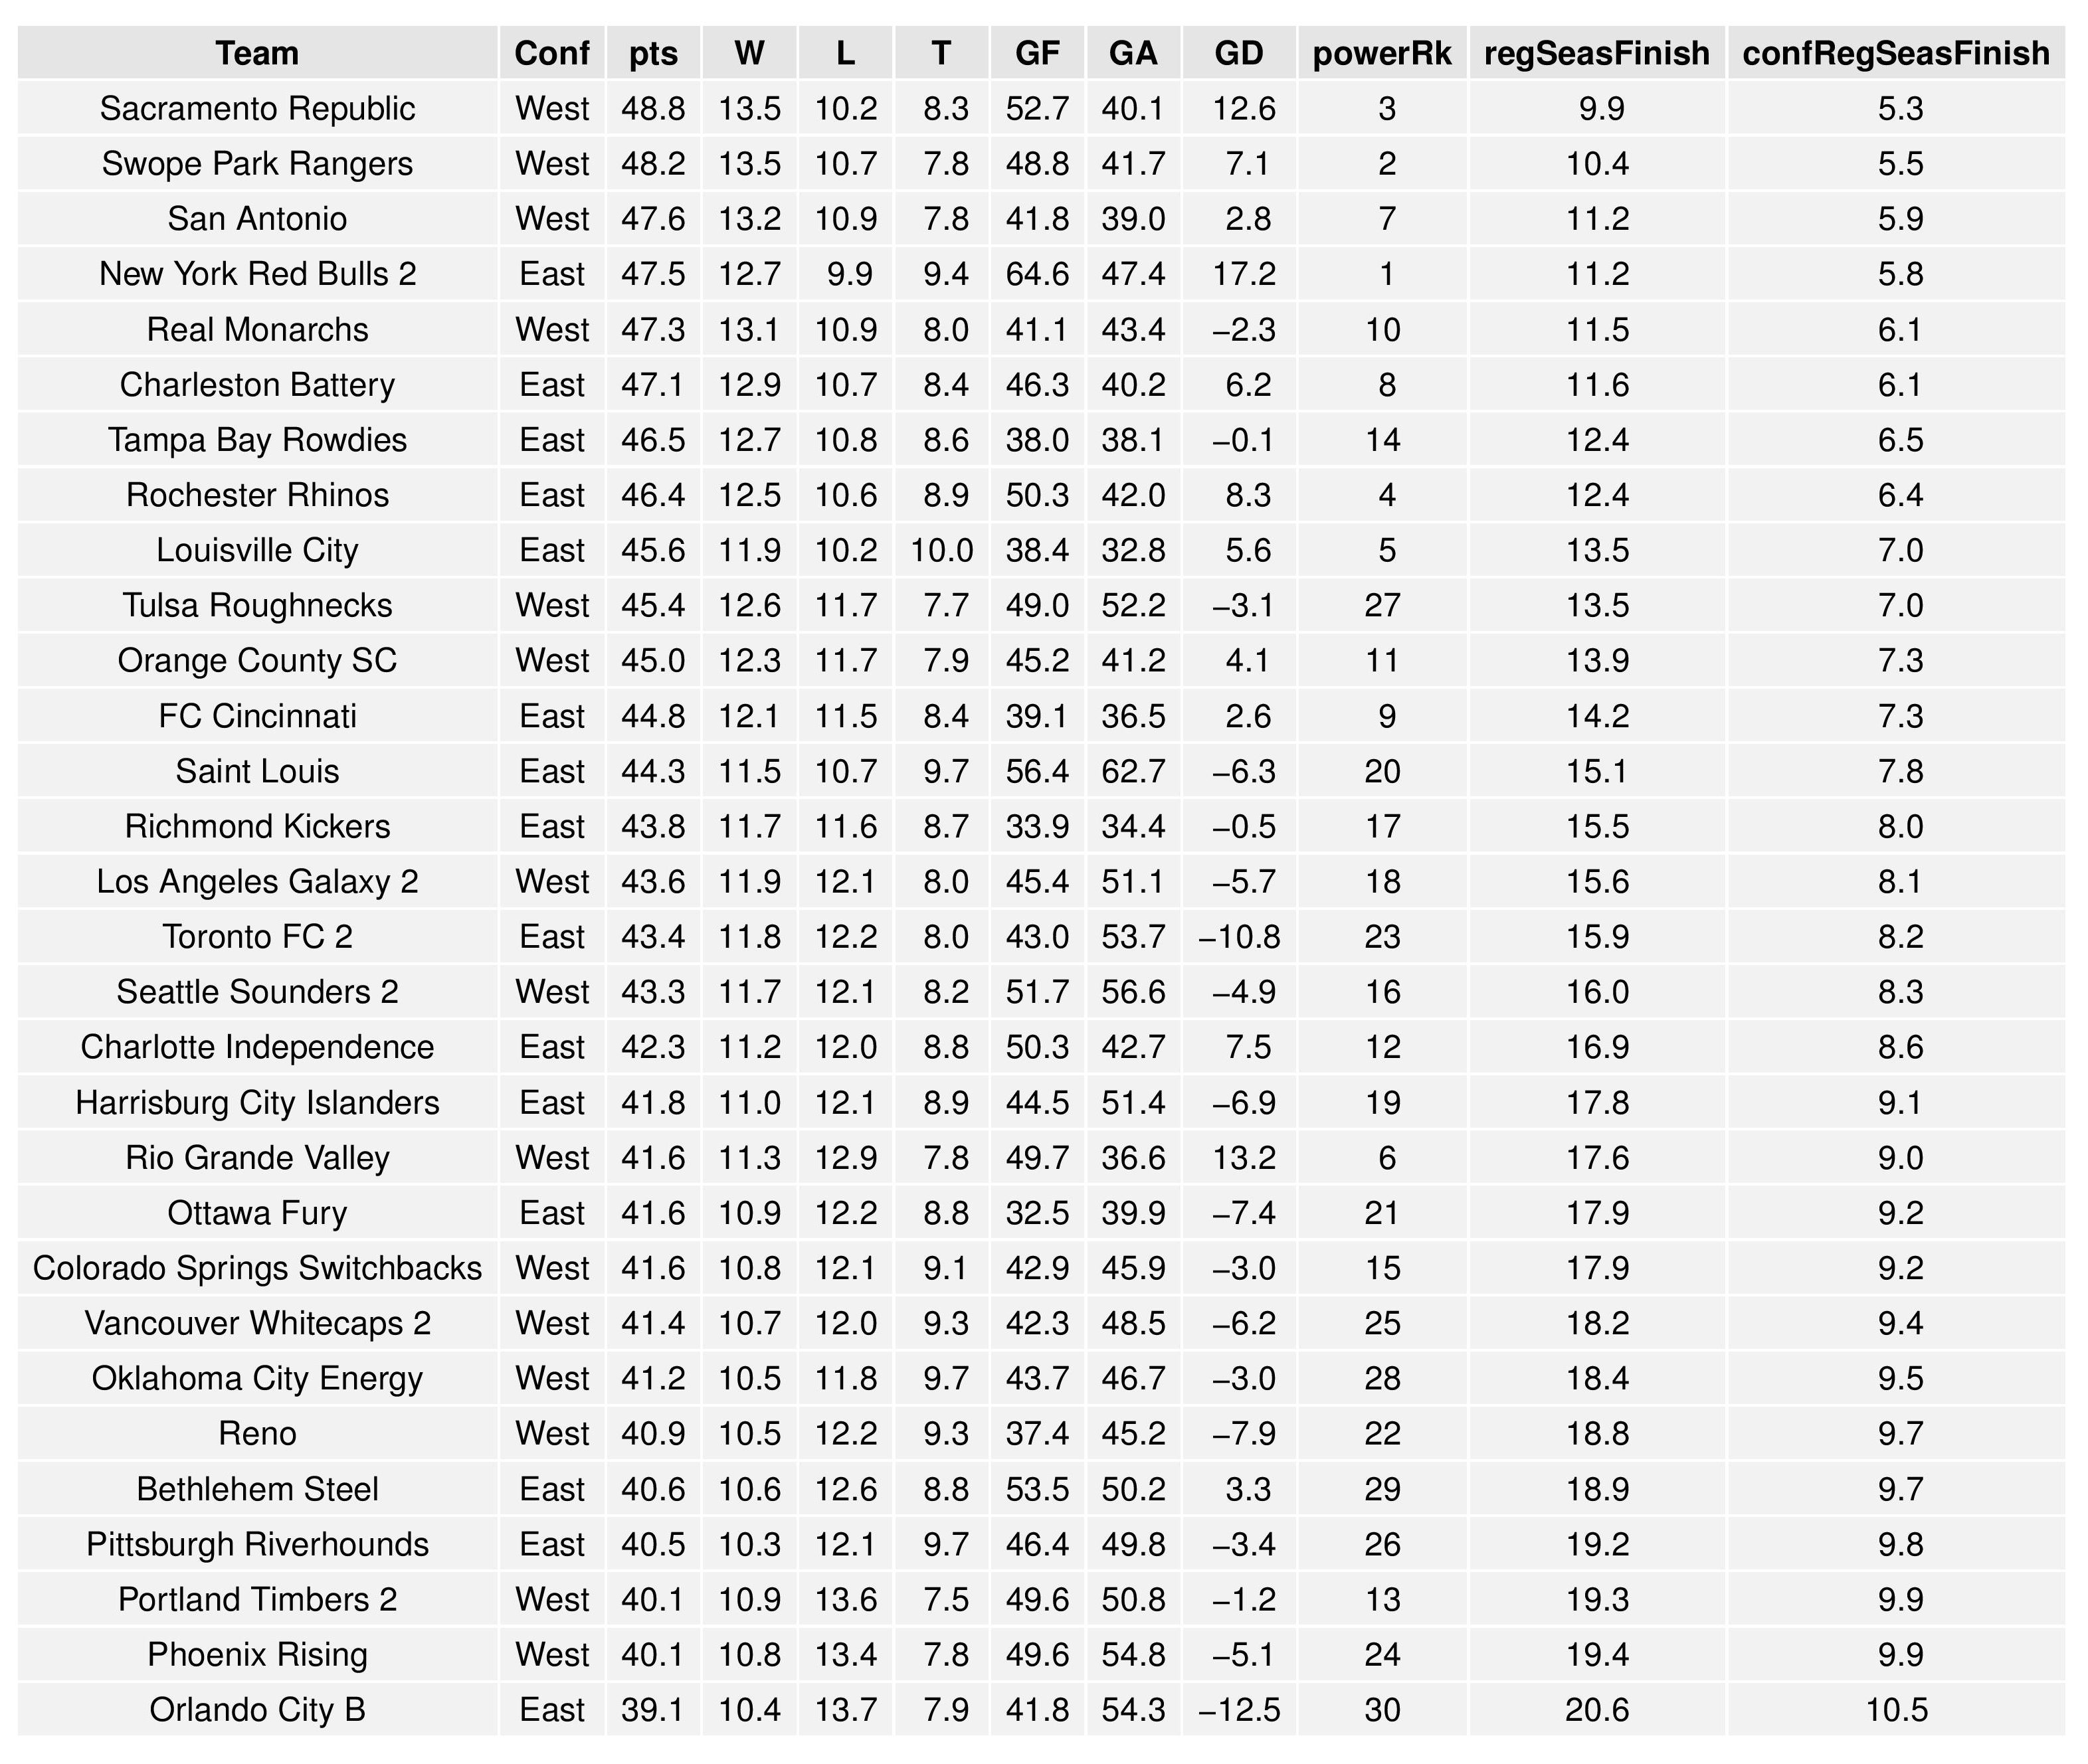
The following shows the summary of the simulations in an easy table format.

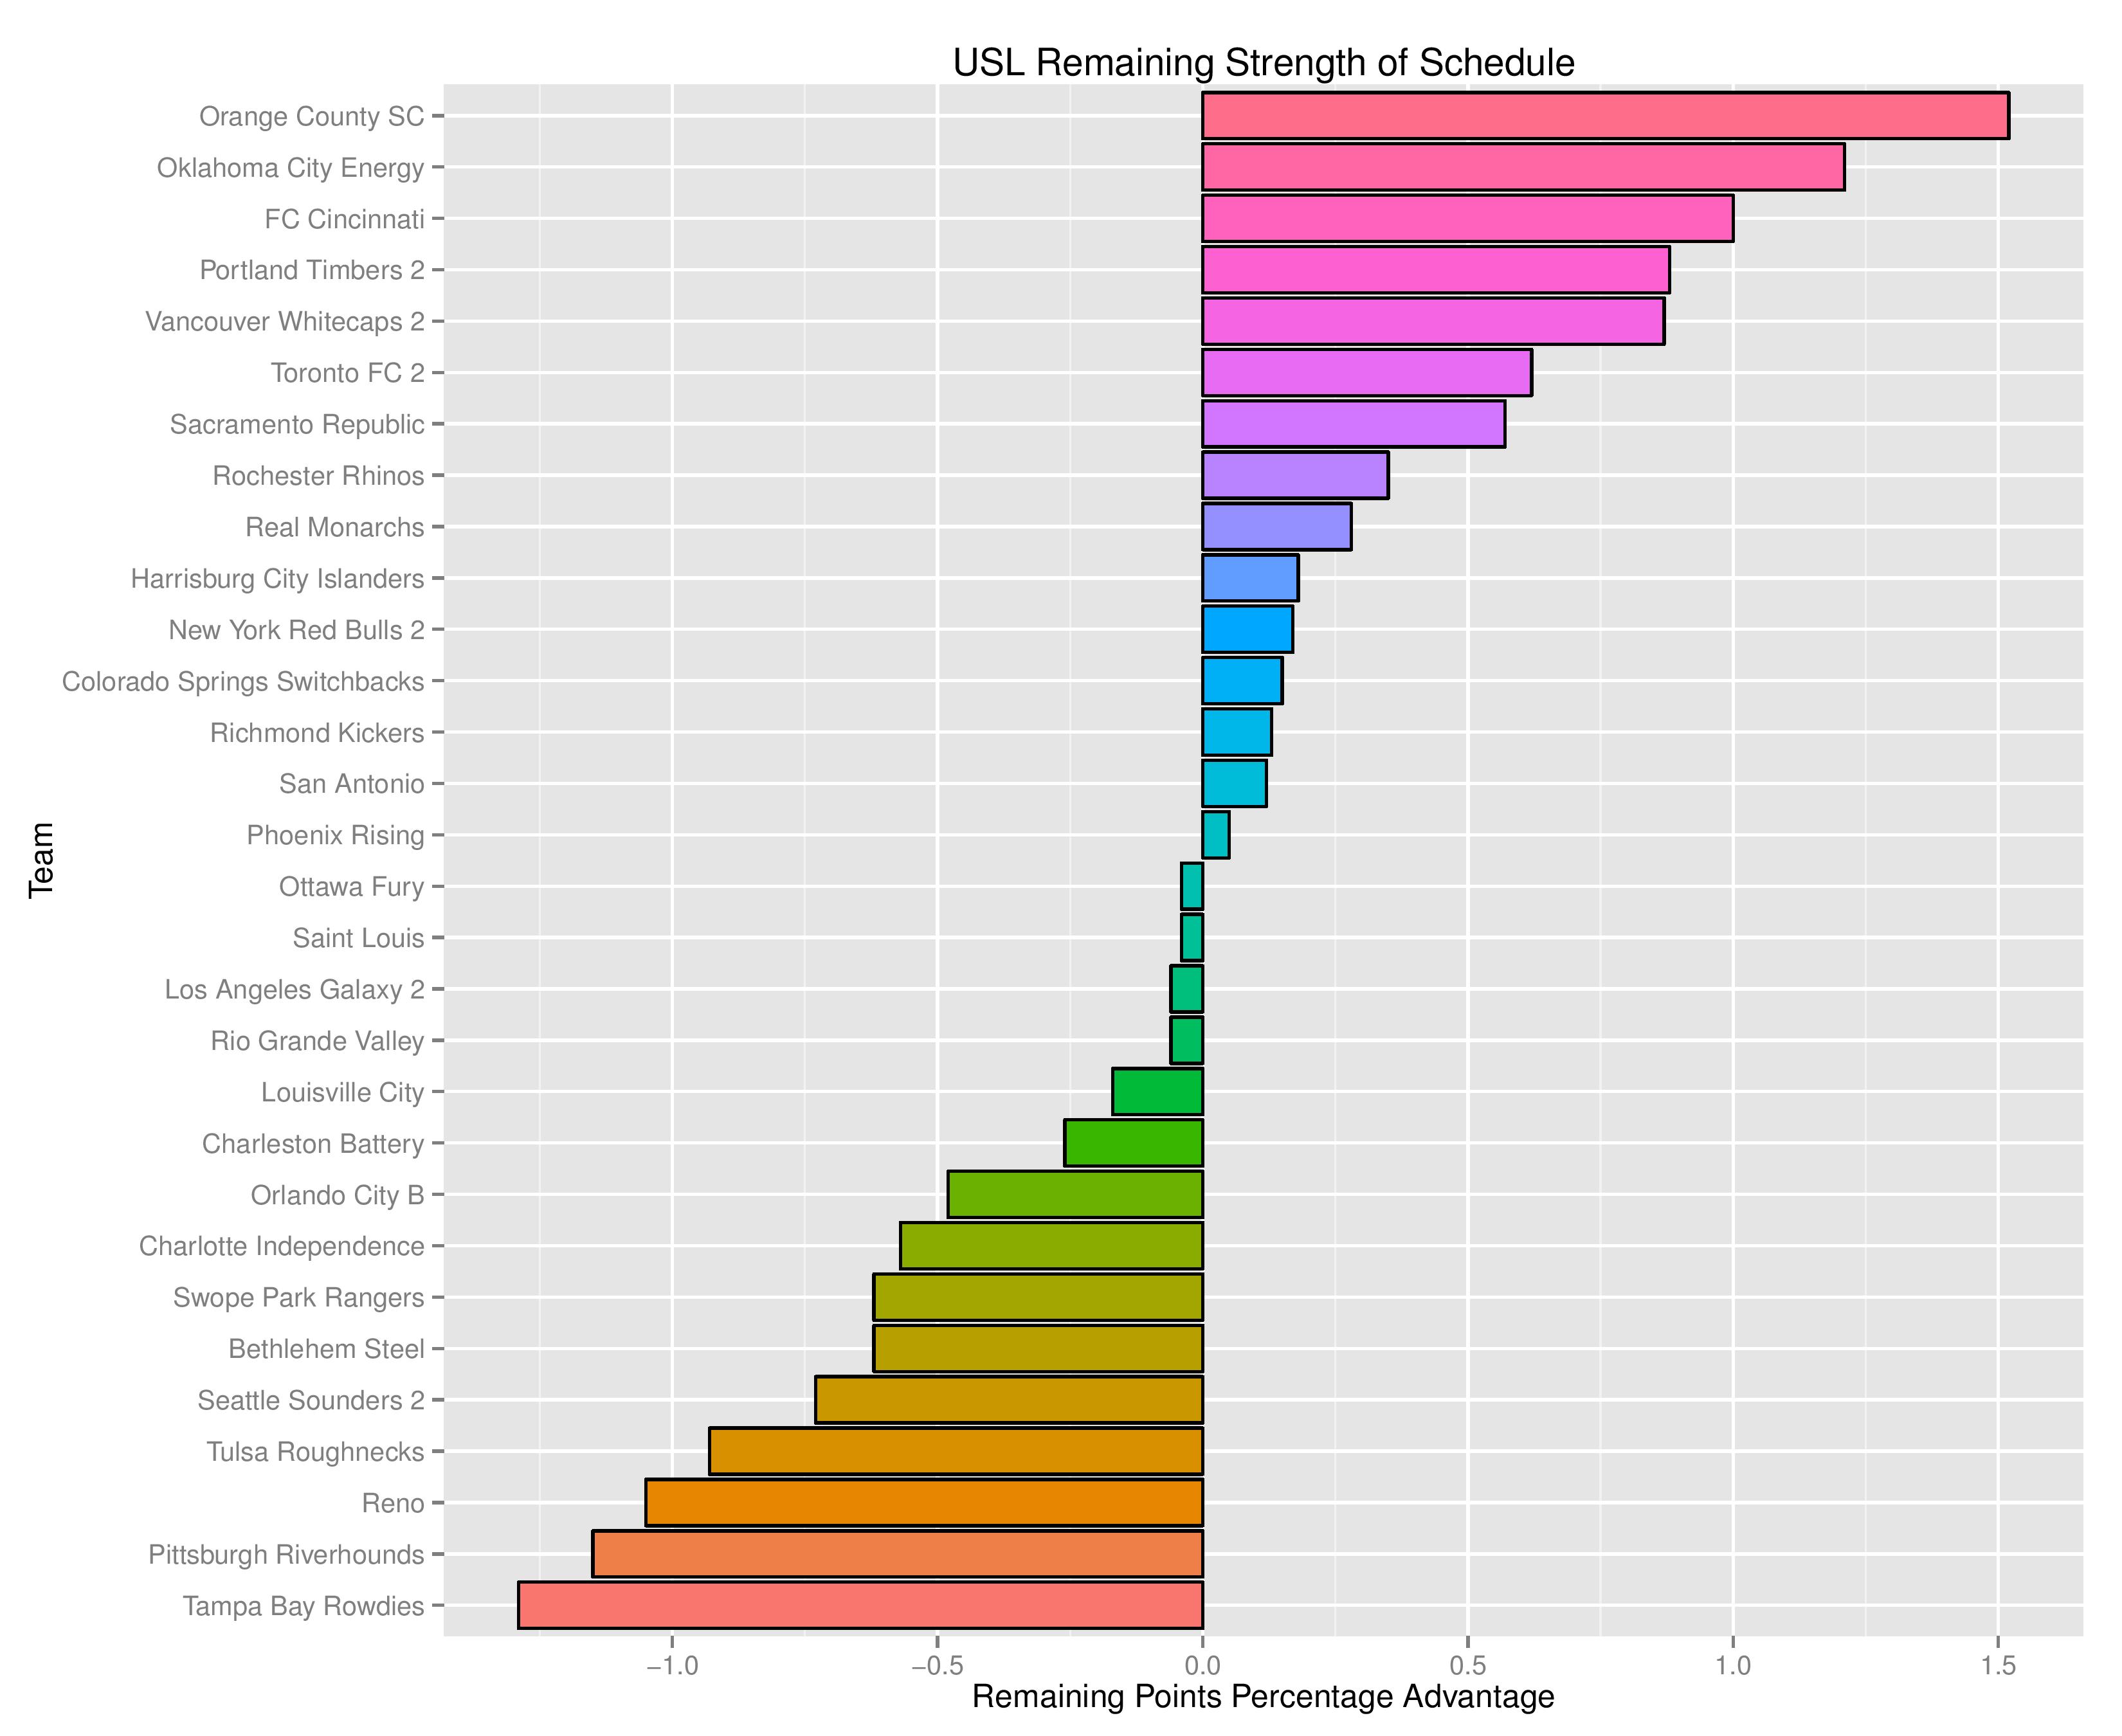
As a new feature, we can also show how the Remaining Strength of Schedule affects each team.
The “Points Percentage Advantage” shown on the X-axis represents the percentage of points expected over the league average schedule. This “points expected” value is generated by simulating how all teams would perform with all remaining schedules (and therefore judges a schedule based upon how all teams would perform in that scenario).
In short, the higher the value, the easier the remaining schedule.
Remaining home field advantage will make a large contribution here. It can also be true that a better team has an ‘easier’ schedule simply because they do not have to play themselves. Likewise, a bad team may have a ‘harder’ schedule because they also do not play themselves.
The table following the chart also shares helpful context with these percentages.
Accompanying the advantage percentage in the following table is their current standings rank (right now ties are not properly calculated beyond pts/gd/gf), the remaining home matches, the remaining away matches, the current average points-per-game of future opponents (results-based, not model-based), and the average power ranking of future opponents according to SEBA.
The following shows the expectations for upcoming matches for both Bethlehem and Harrisburg:

NWSL
Having already produced a preseason forecast last week, I’m going to hold off on updated forecasts until after NWSL’s week one has finished (the forecast coming out on 4/19 will contain the next updates).
The SEBA Projection System is an acronym for a tortured collection of words in the Statistical Extrapolation Bayesian Analyzer Projection System. Check out the first season’s post to find out how it works (https://phillysoccerpage.net/2017/03/03/2017-initial-seba-projections/)

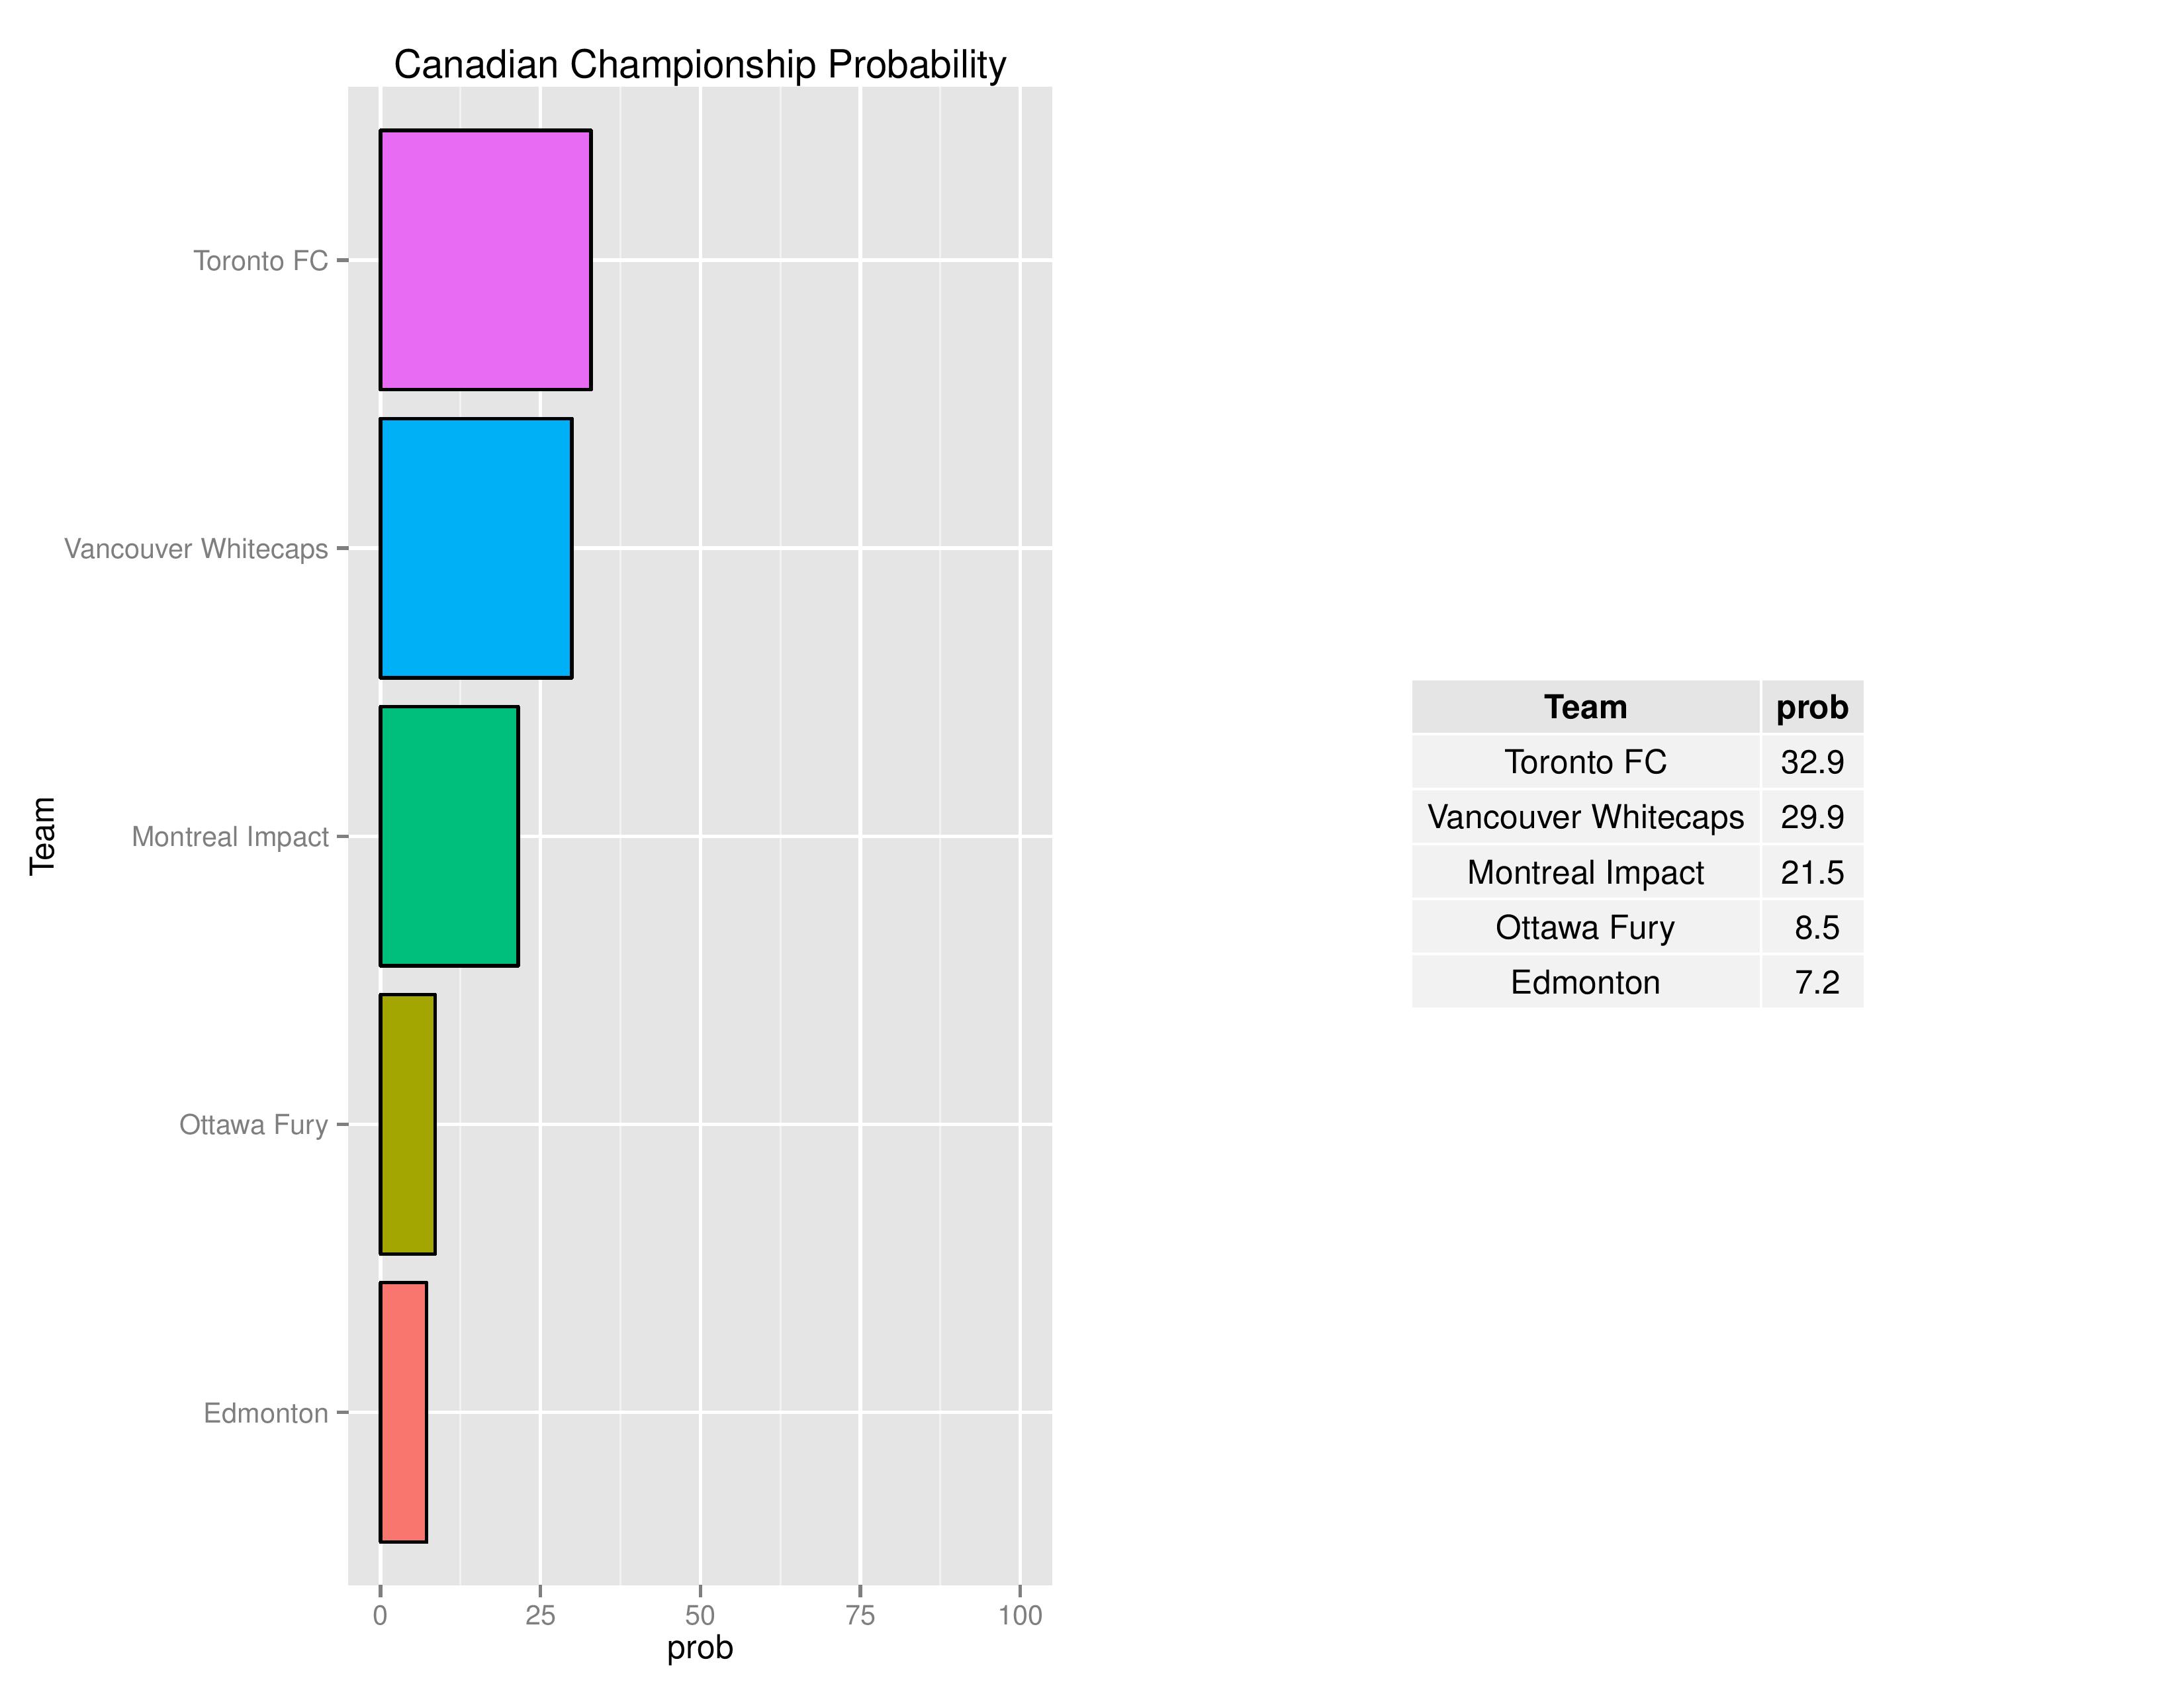
Its frustrating how low the Union’s odds of winning the Canadian Championship are.
#CurtinOut
These metrics are great, fantastic job guys!
Also, this makes me more depressed then ever…
When Stewart talked about consistency between the two squads I was hoping for something better than this :(. The data is a brutal wake up call for anyone who thinks this club’s performance will be significantly different than last year.
Short answer, it seems unlikely we’ll see any dramatic improvements given what we’ve seen of Curtin’s ability to rally when things go south.