There are new features in this edition of SEBA’s international forecasts. Below the World Cup Qualification projections includes 2018 World Cup projections, FIFA rank projections, and, further below, an explanation of the FIFA ranking system and why it is different than SEBA’s.
Below are the current forecasts using data from matches through March 25, 2017.
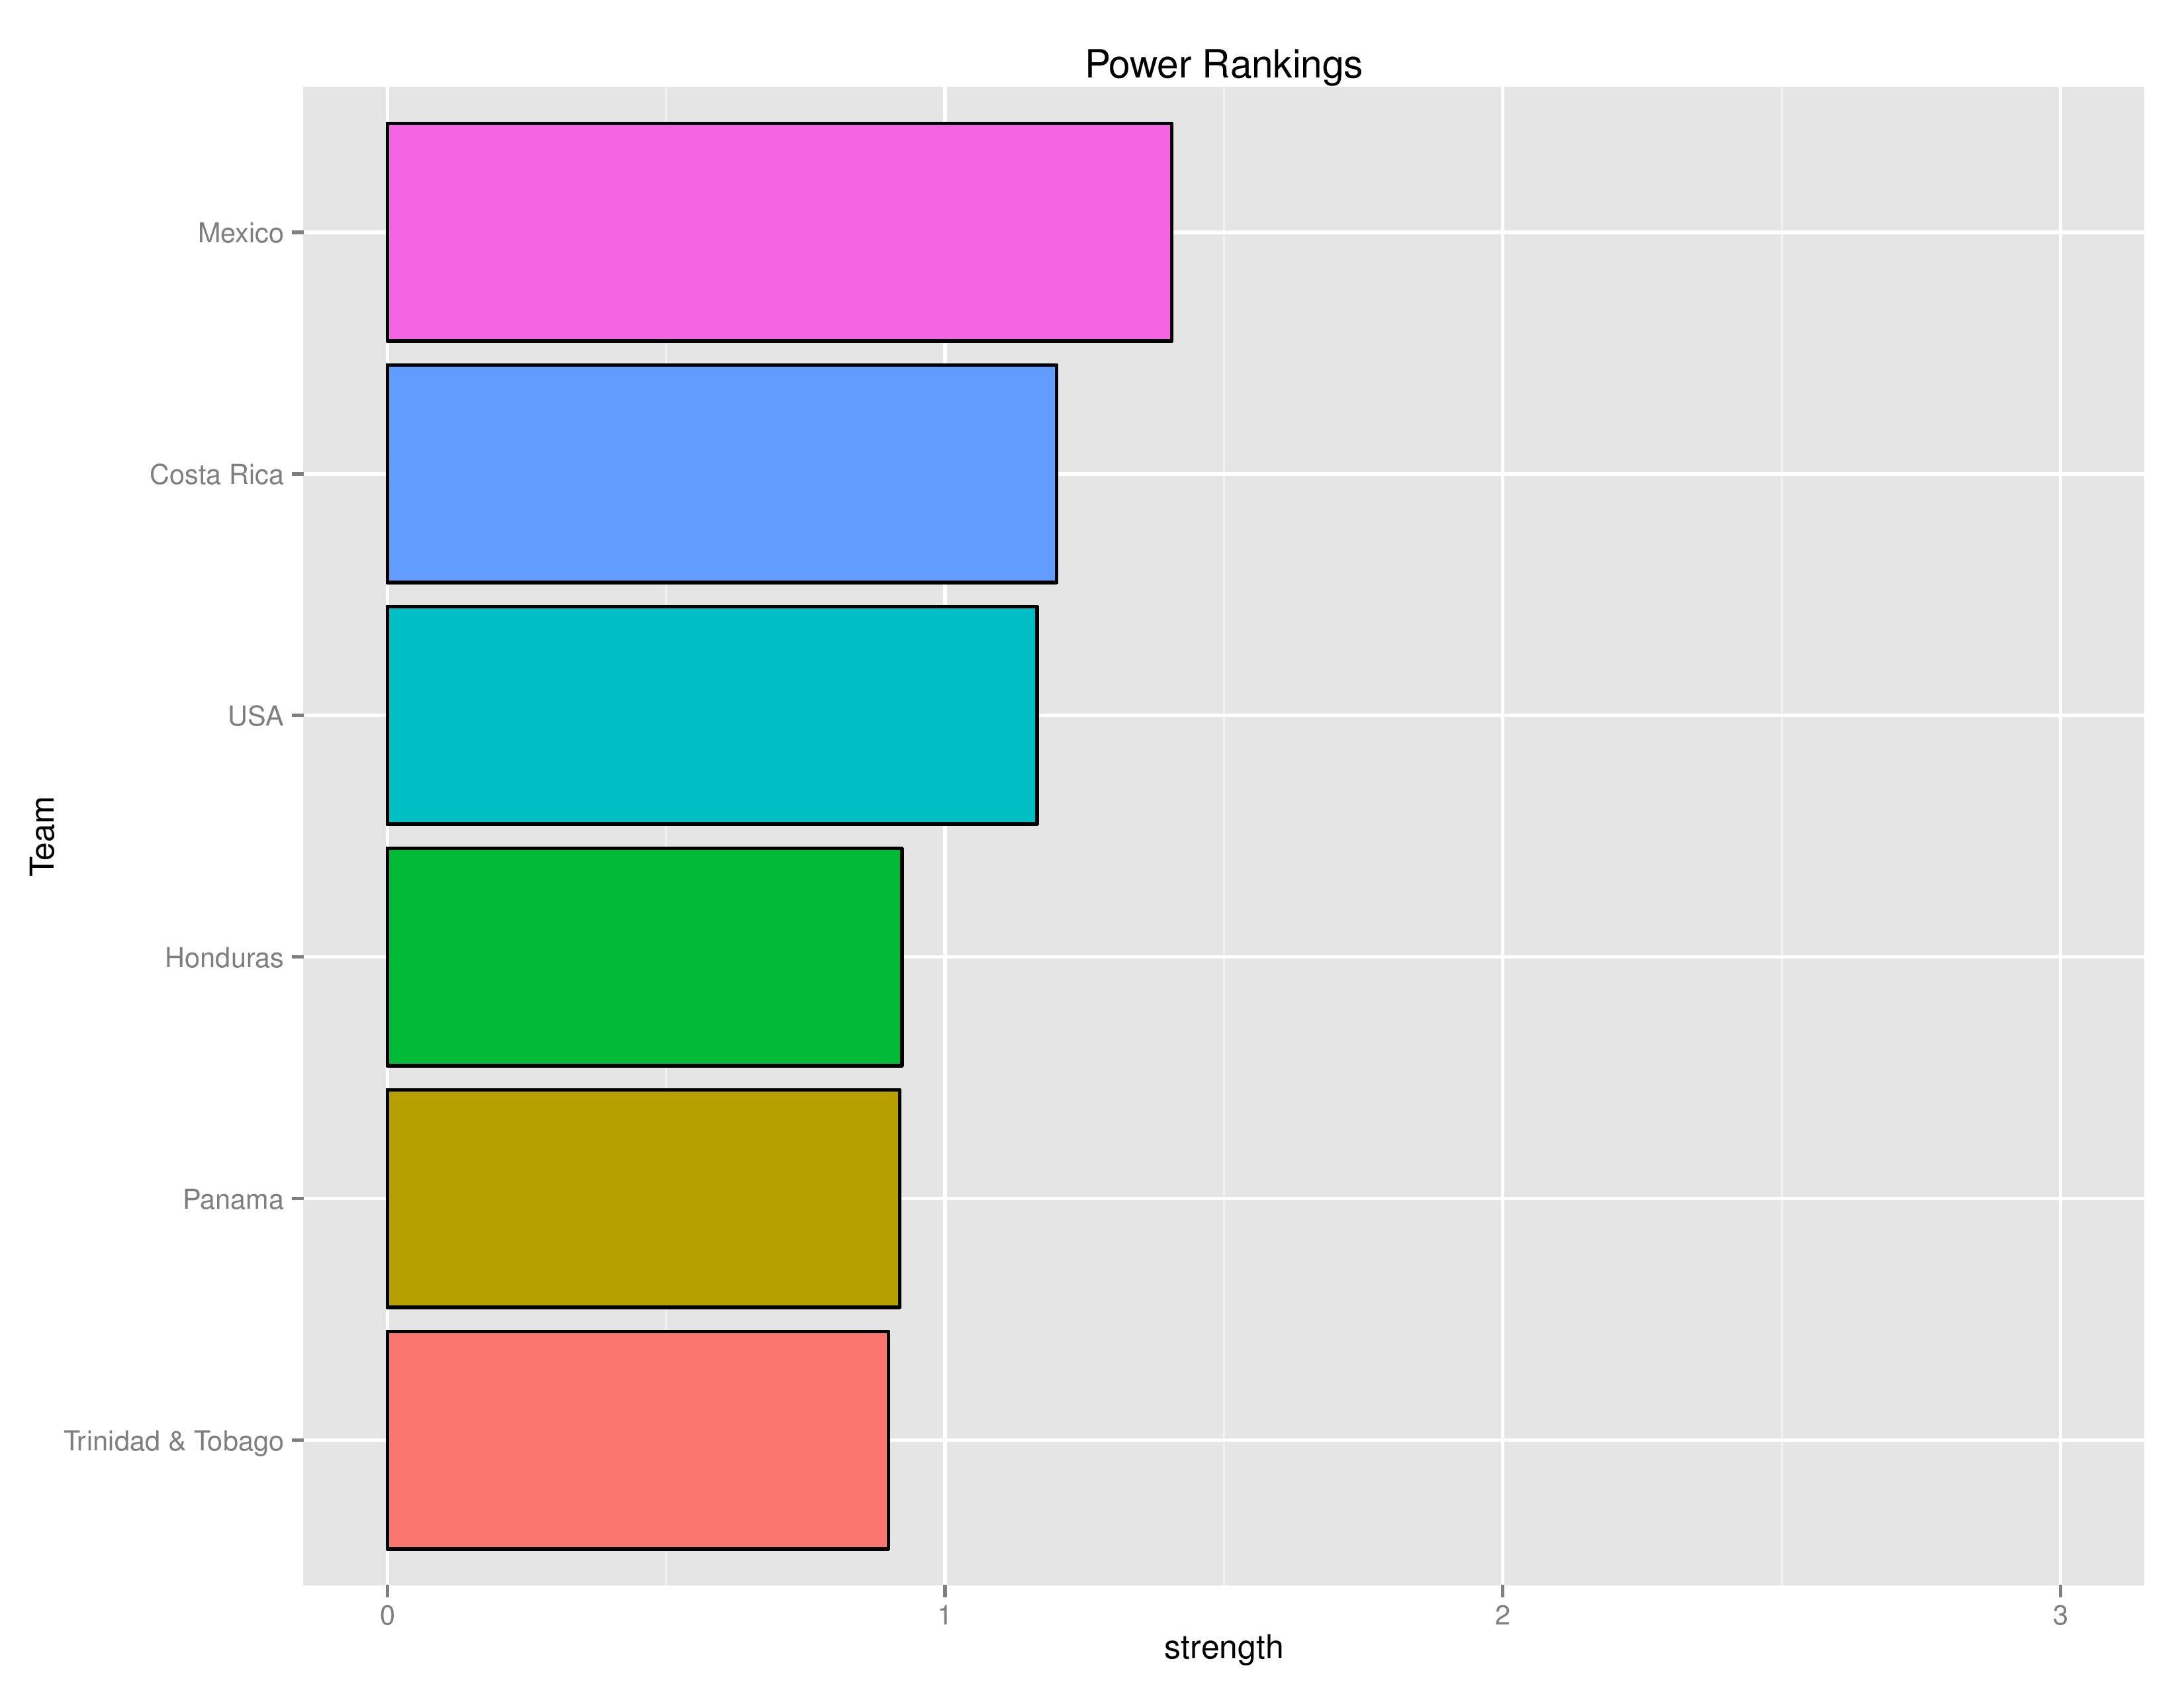
Hexagonal Power Rankings
The “Power Rankings” we concoct are the actual “strength” of the team according to competitive expectations. The value represented on the X-Axis is the average amount of points we expect that team to receive when playing against every national team that participated in the previous World Cup on neutral territory:

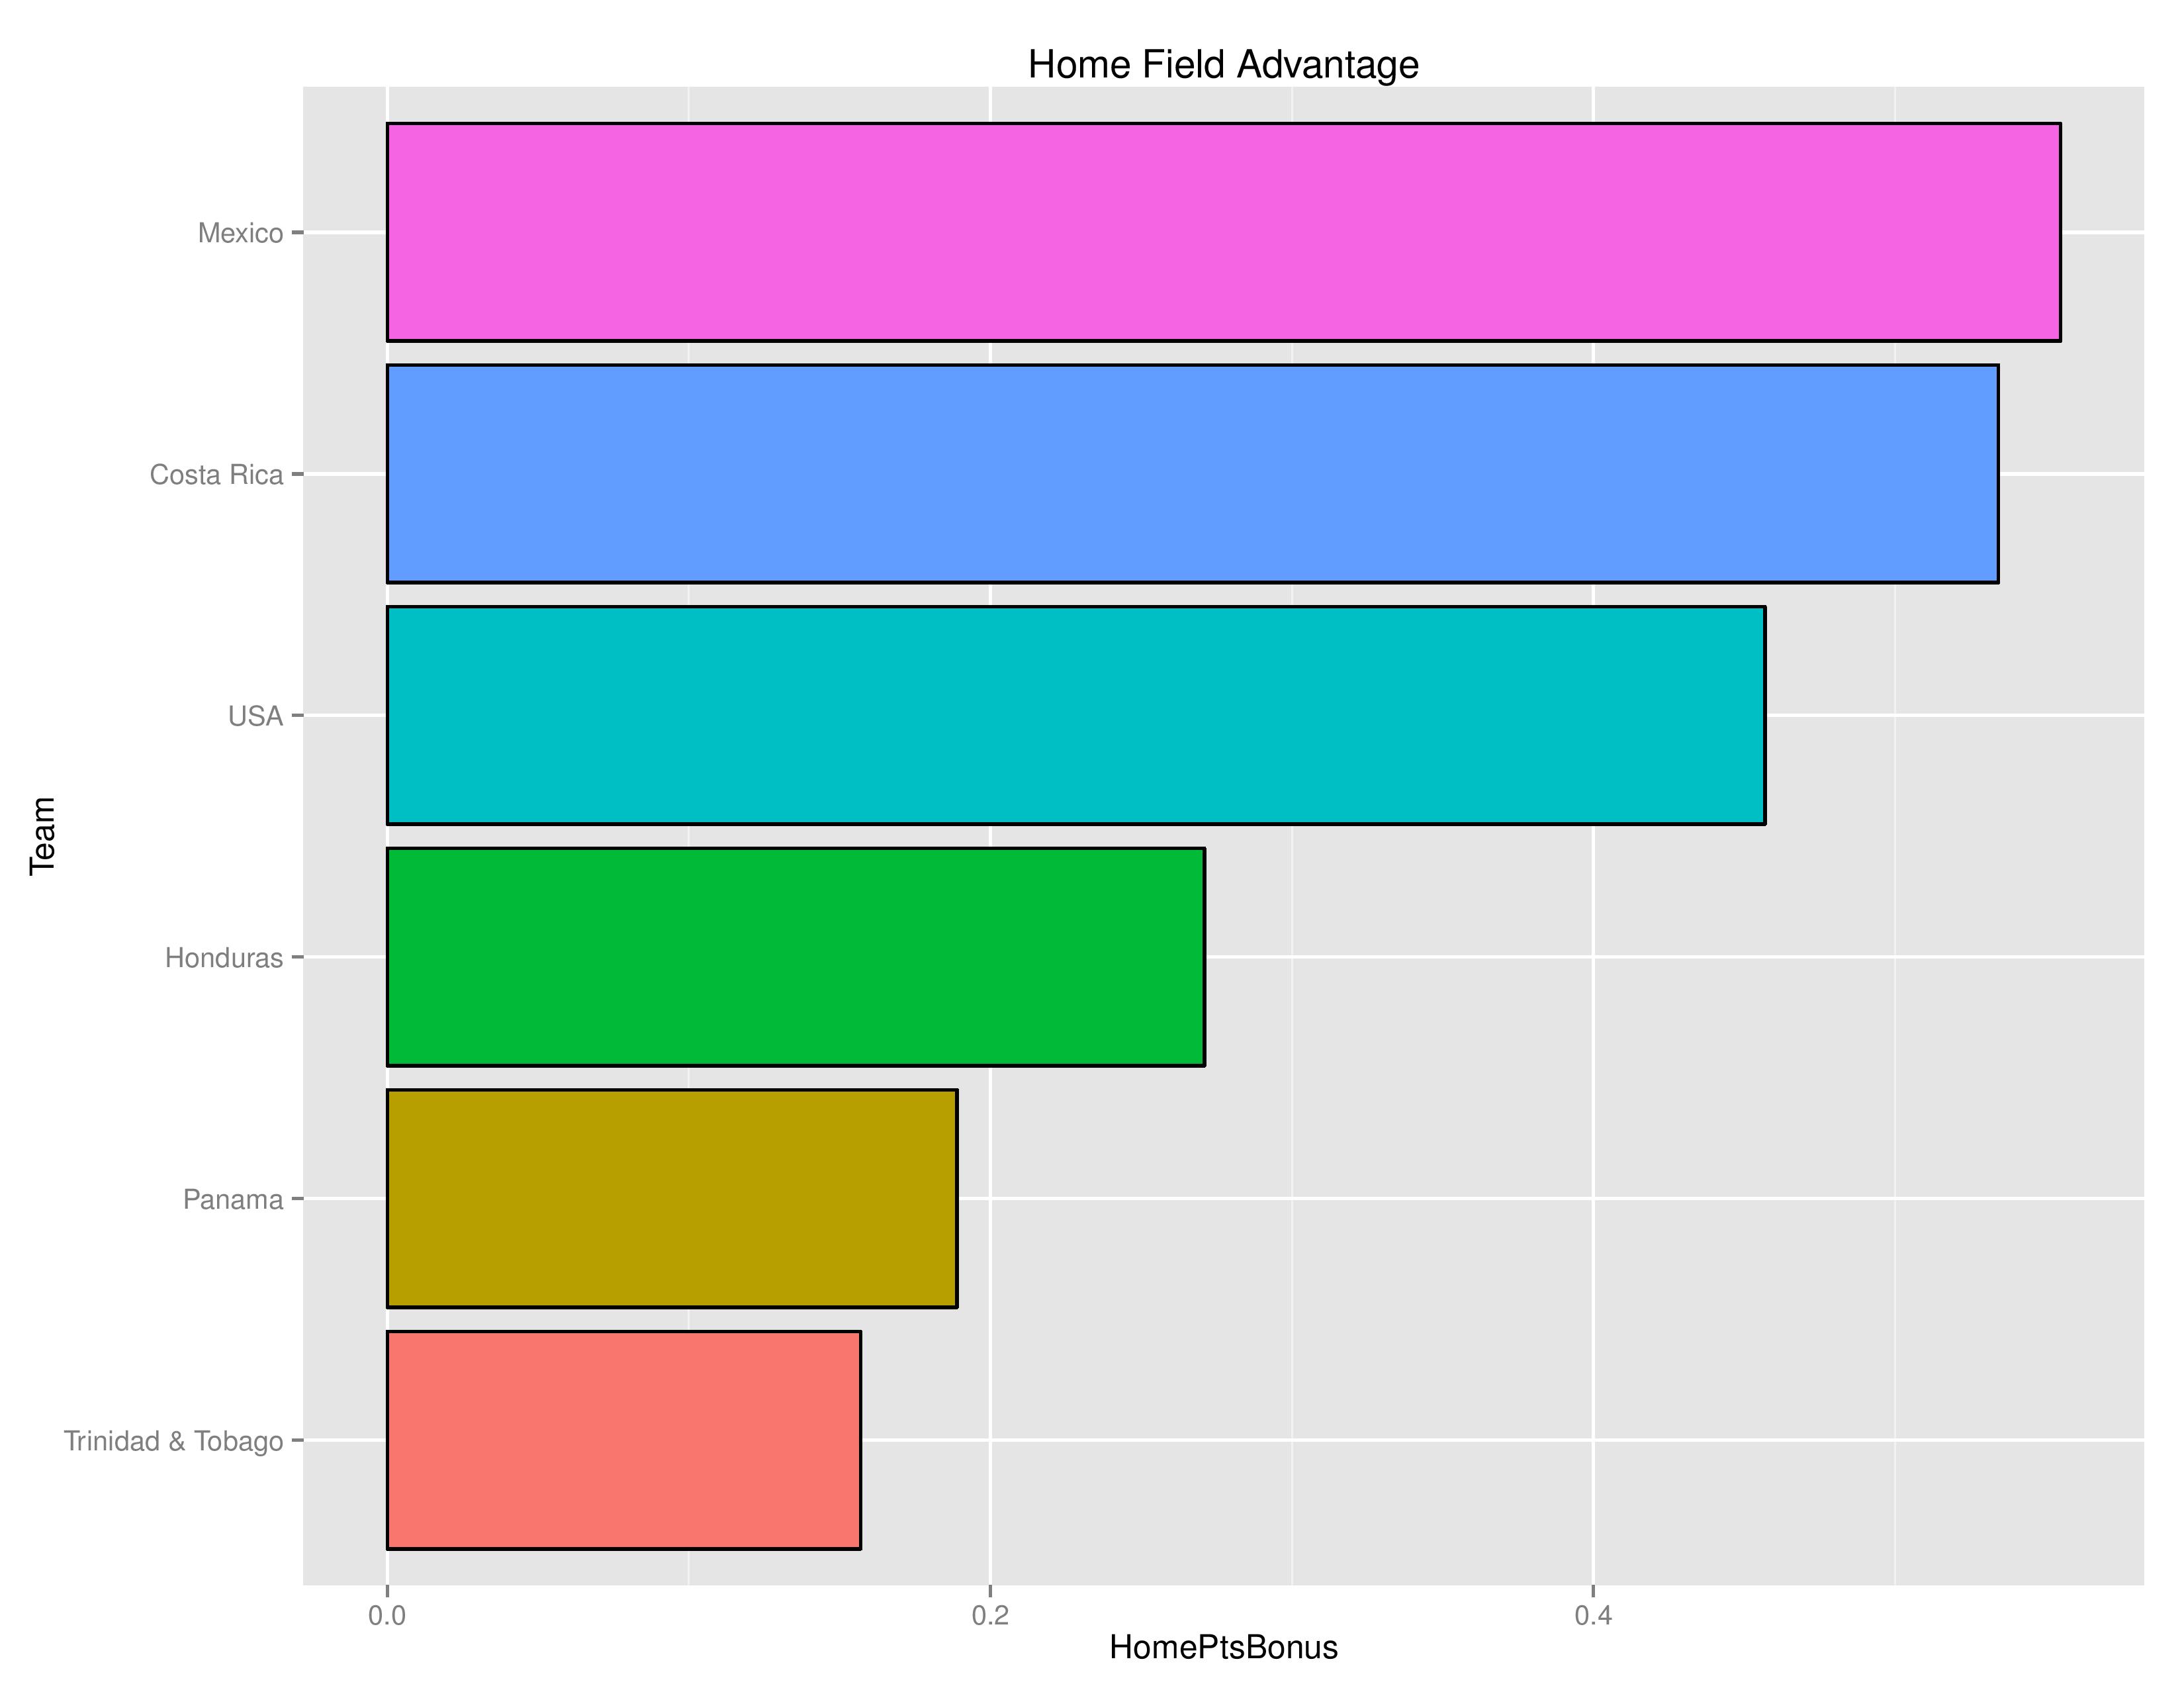
The following chart shows the average points bonus for a particular nation’s home field advantage. This is important in explaining why teams may seem to have favorable odds to qualify even when ranked lower.
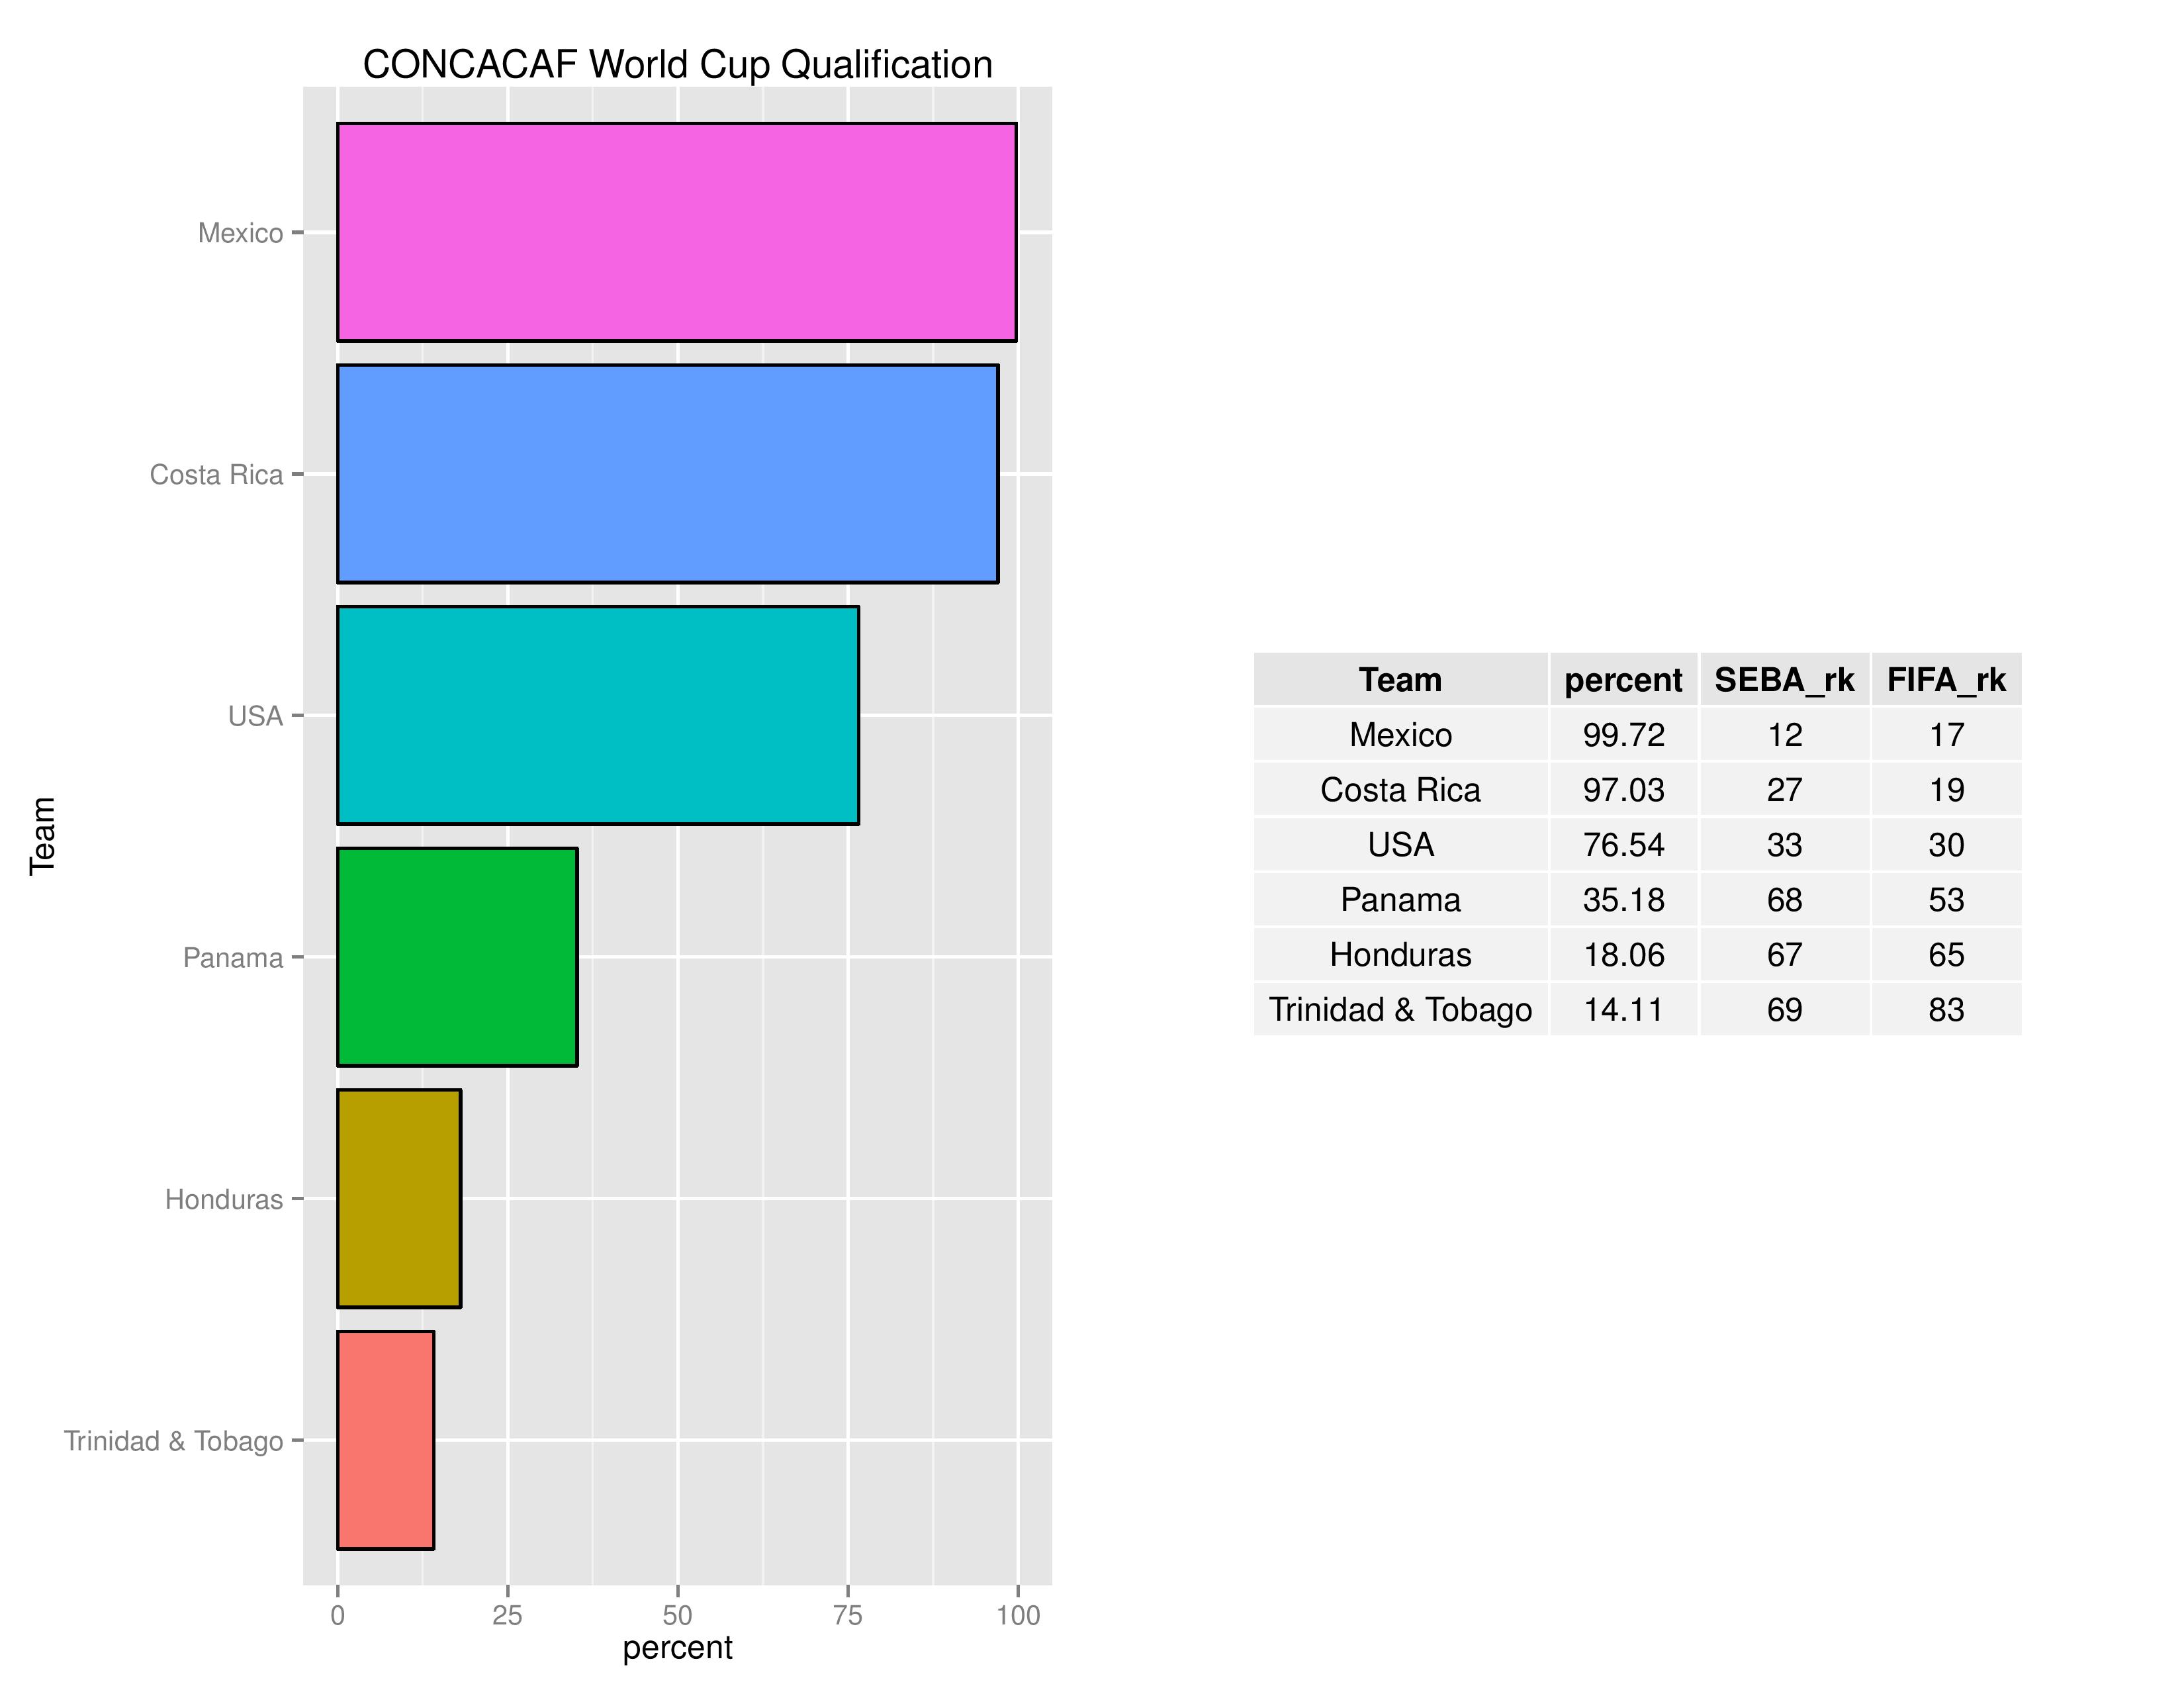
Probability Outcomes
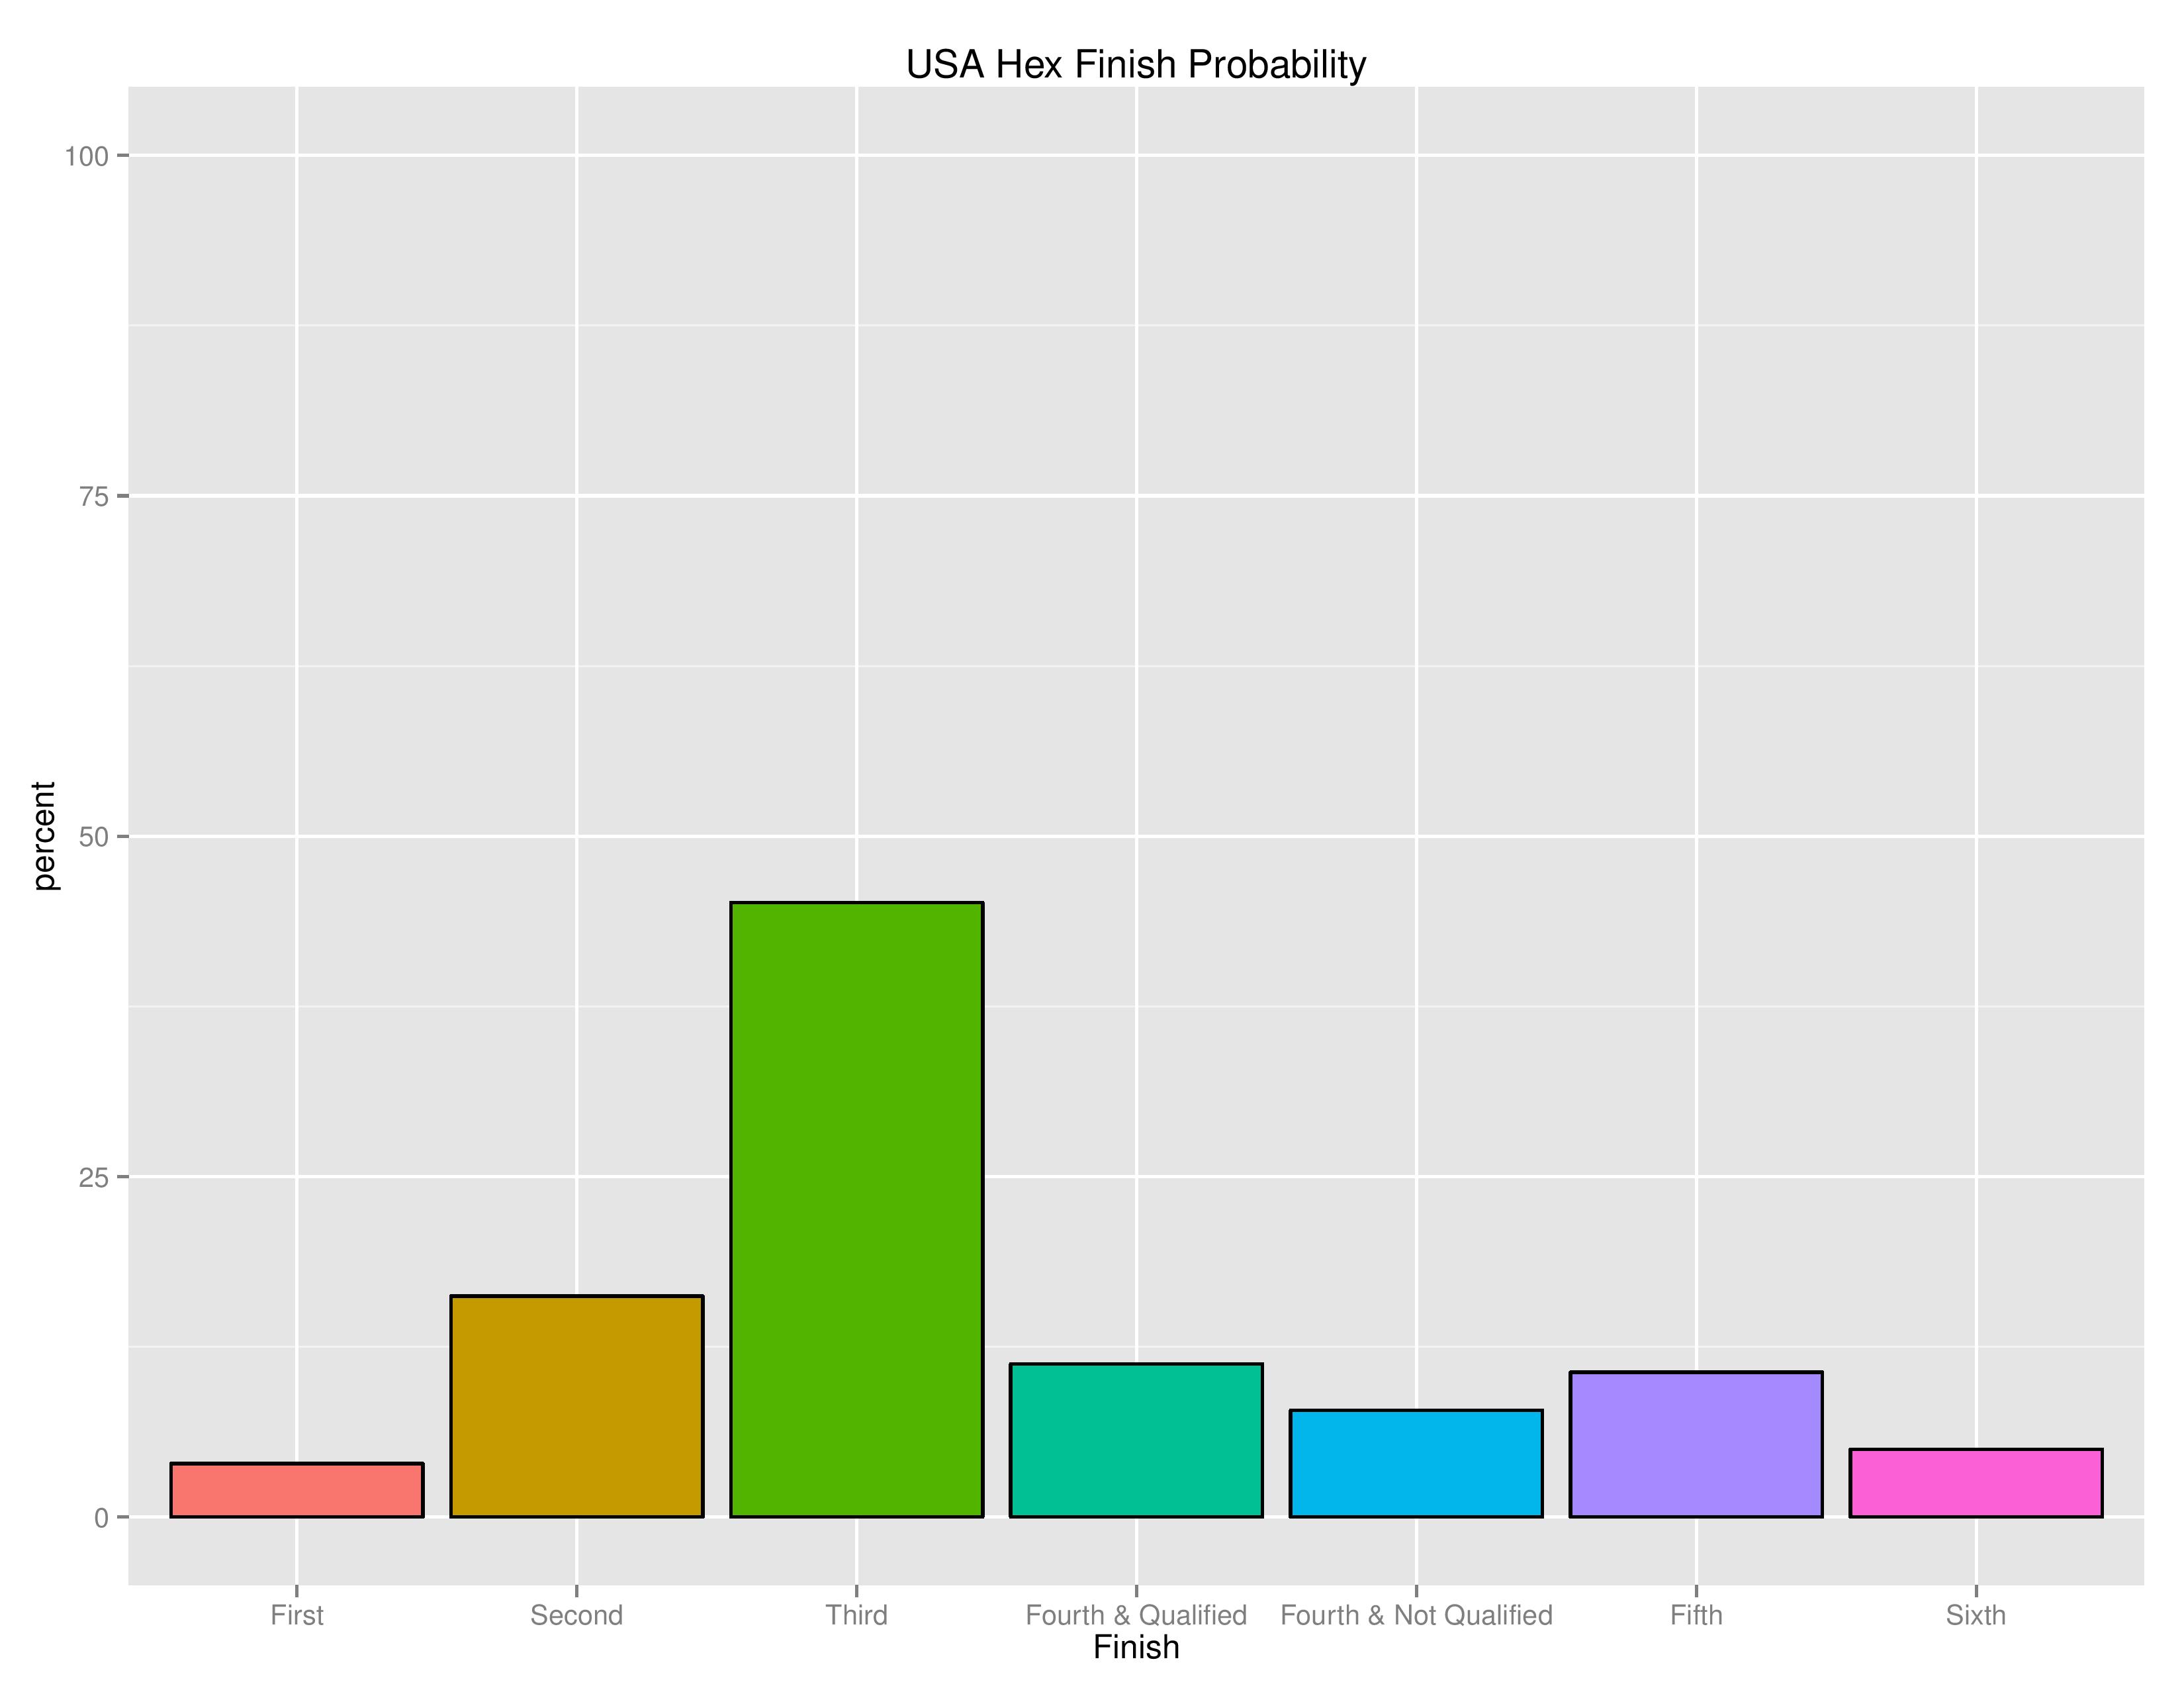
USA has increased their chances of qualifying for the World Cup from 63.96% to 76.54% since the last published forecast.
The next chart shows the probabilities of USA’s potential Hex finish.
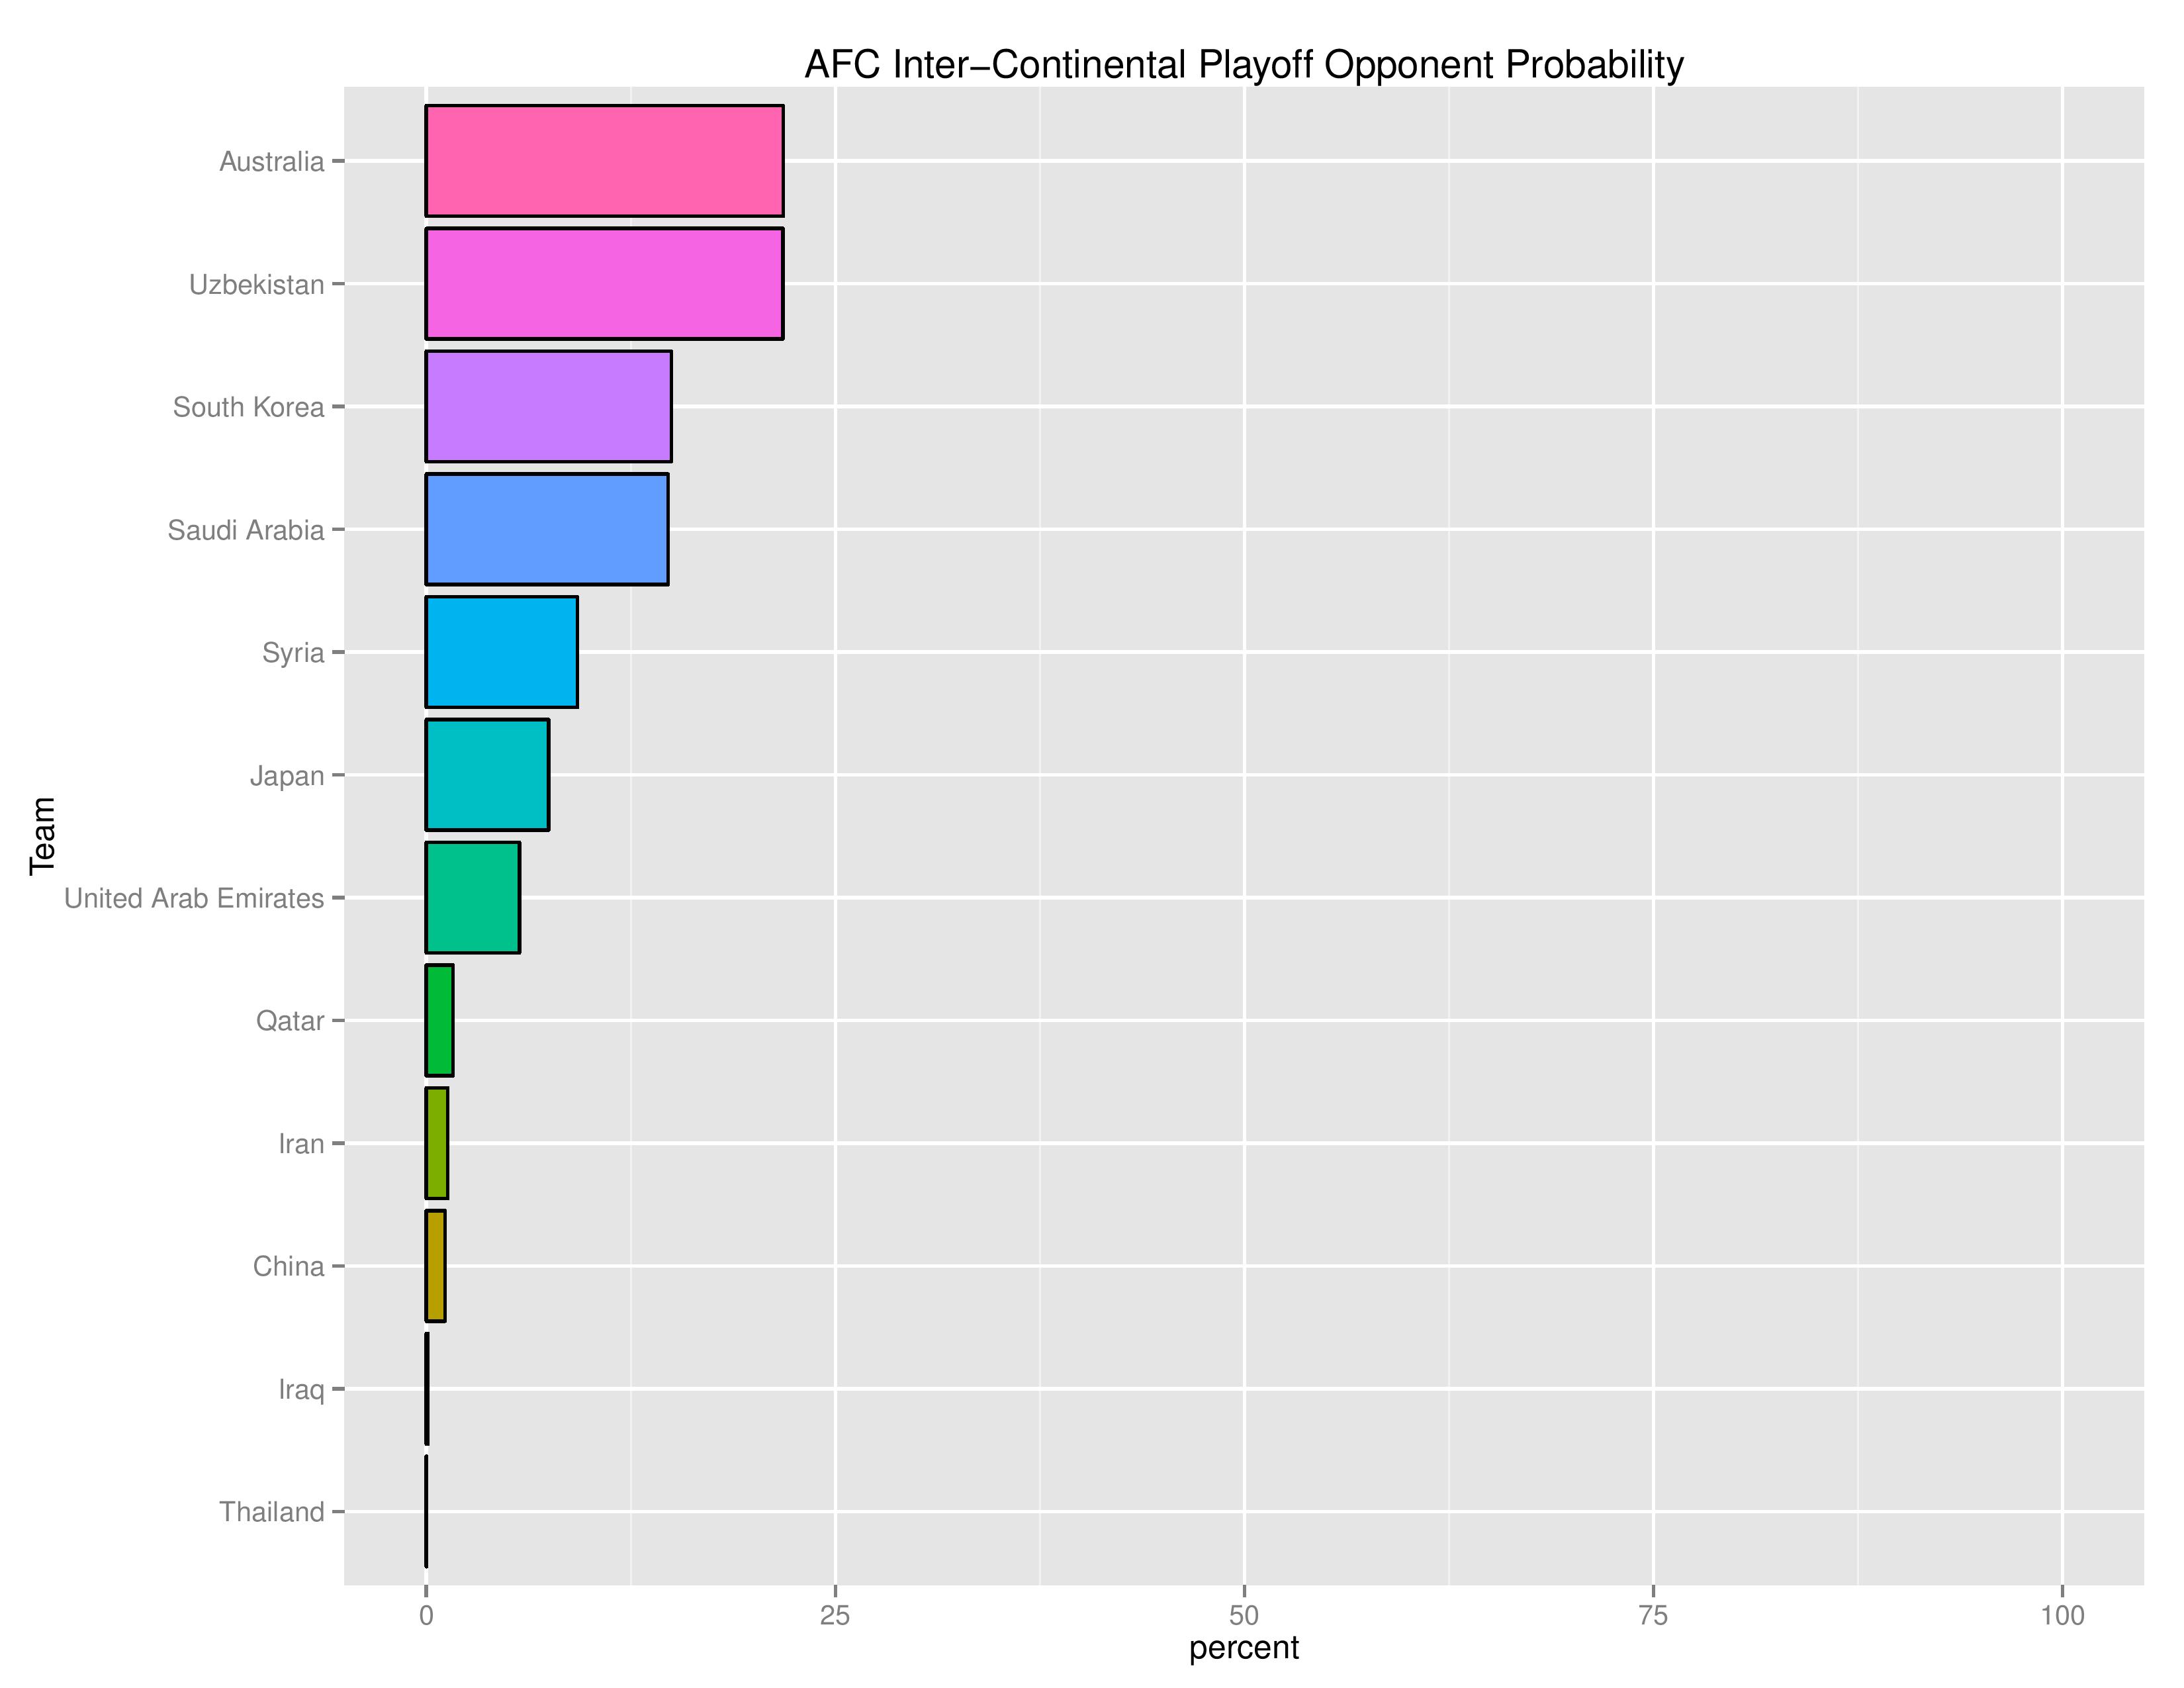
The following chart shows the likelihood of the AFC opponent for the inter-confederation opponent (4th place CONCACAF vs. 5th place AFC).
In talks I’ve had with casual USA soccer followers, many people think of this like the last World Cup cycle, where Mexico had to play the weak OFC leader to qualify. I strongly recommend people not take the AFC as lightly. Placing in 4th in the Hex would not leave the USA in a strong qualification position.
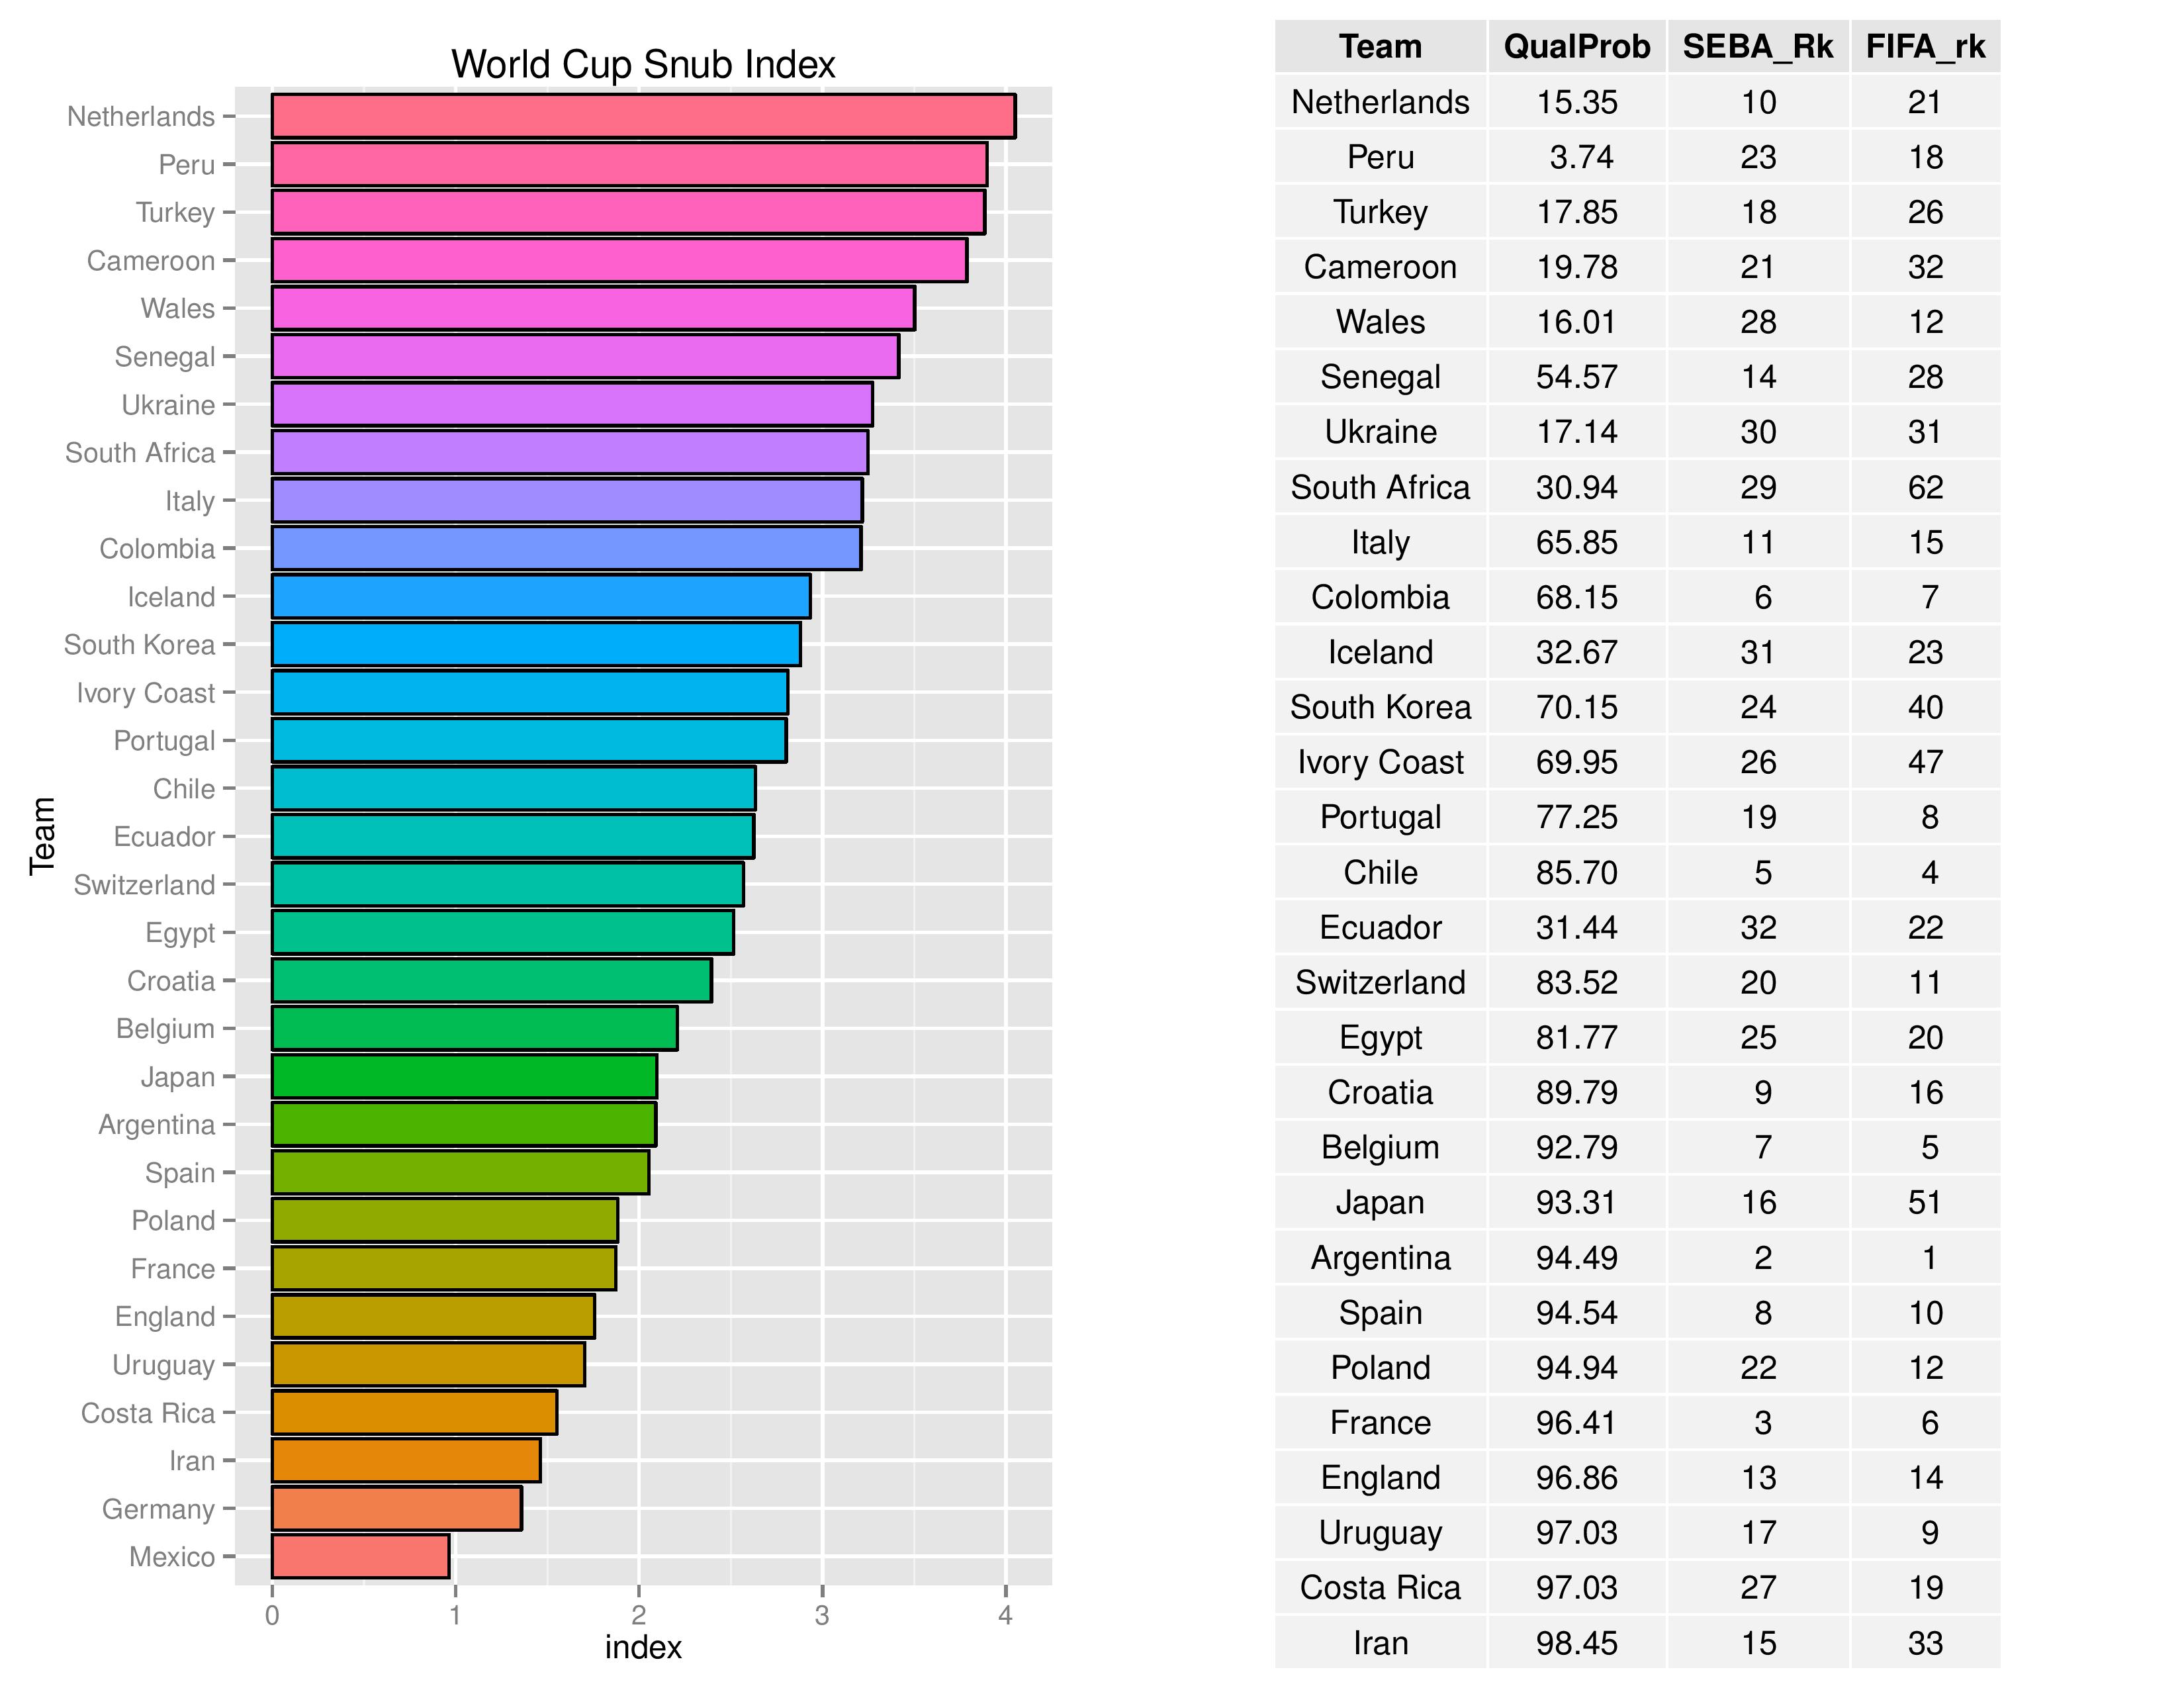
The following chart shows the “Snub Index.” The idea is based on, if the World Cup were to be a tournament for the 32 truly-top teams in the world (at least according to SEBA), then this chart is sorted by how unfortunately damaged the top 32 teams’ chances are in qualifying for the World Cup (the table shows only the top 29 teams but the graph shows all teams with a chance).
The USA is not in this chart because they are not currently quite among the top 32 teams according to SEBA.
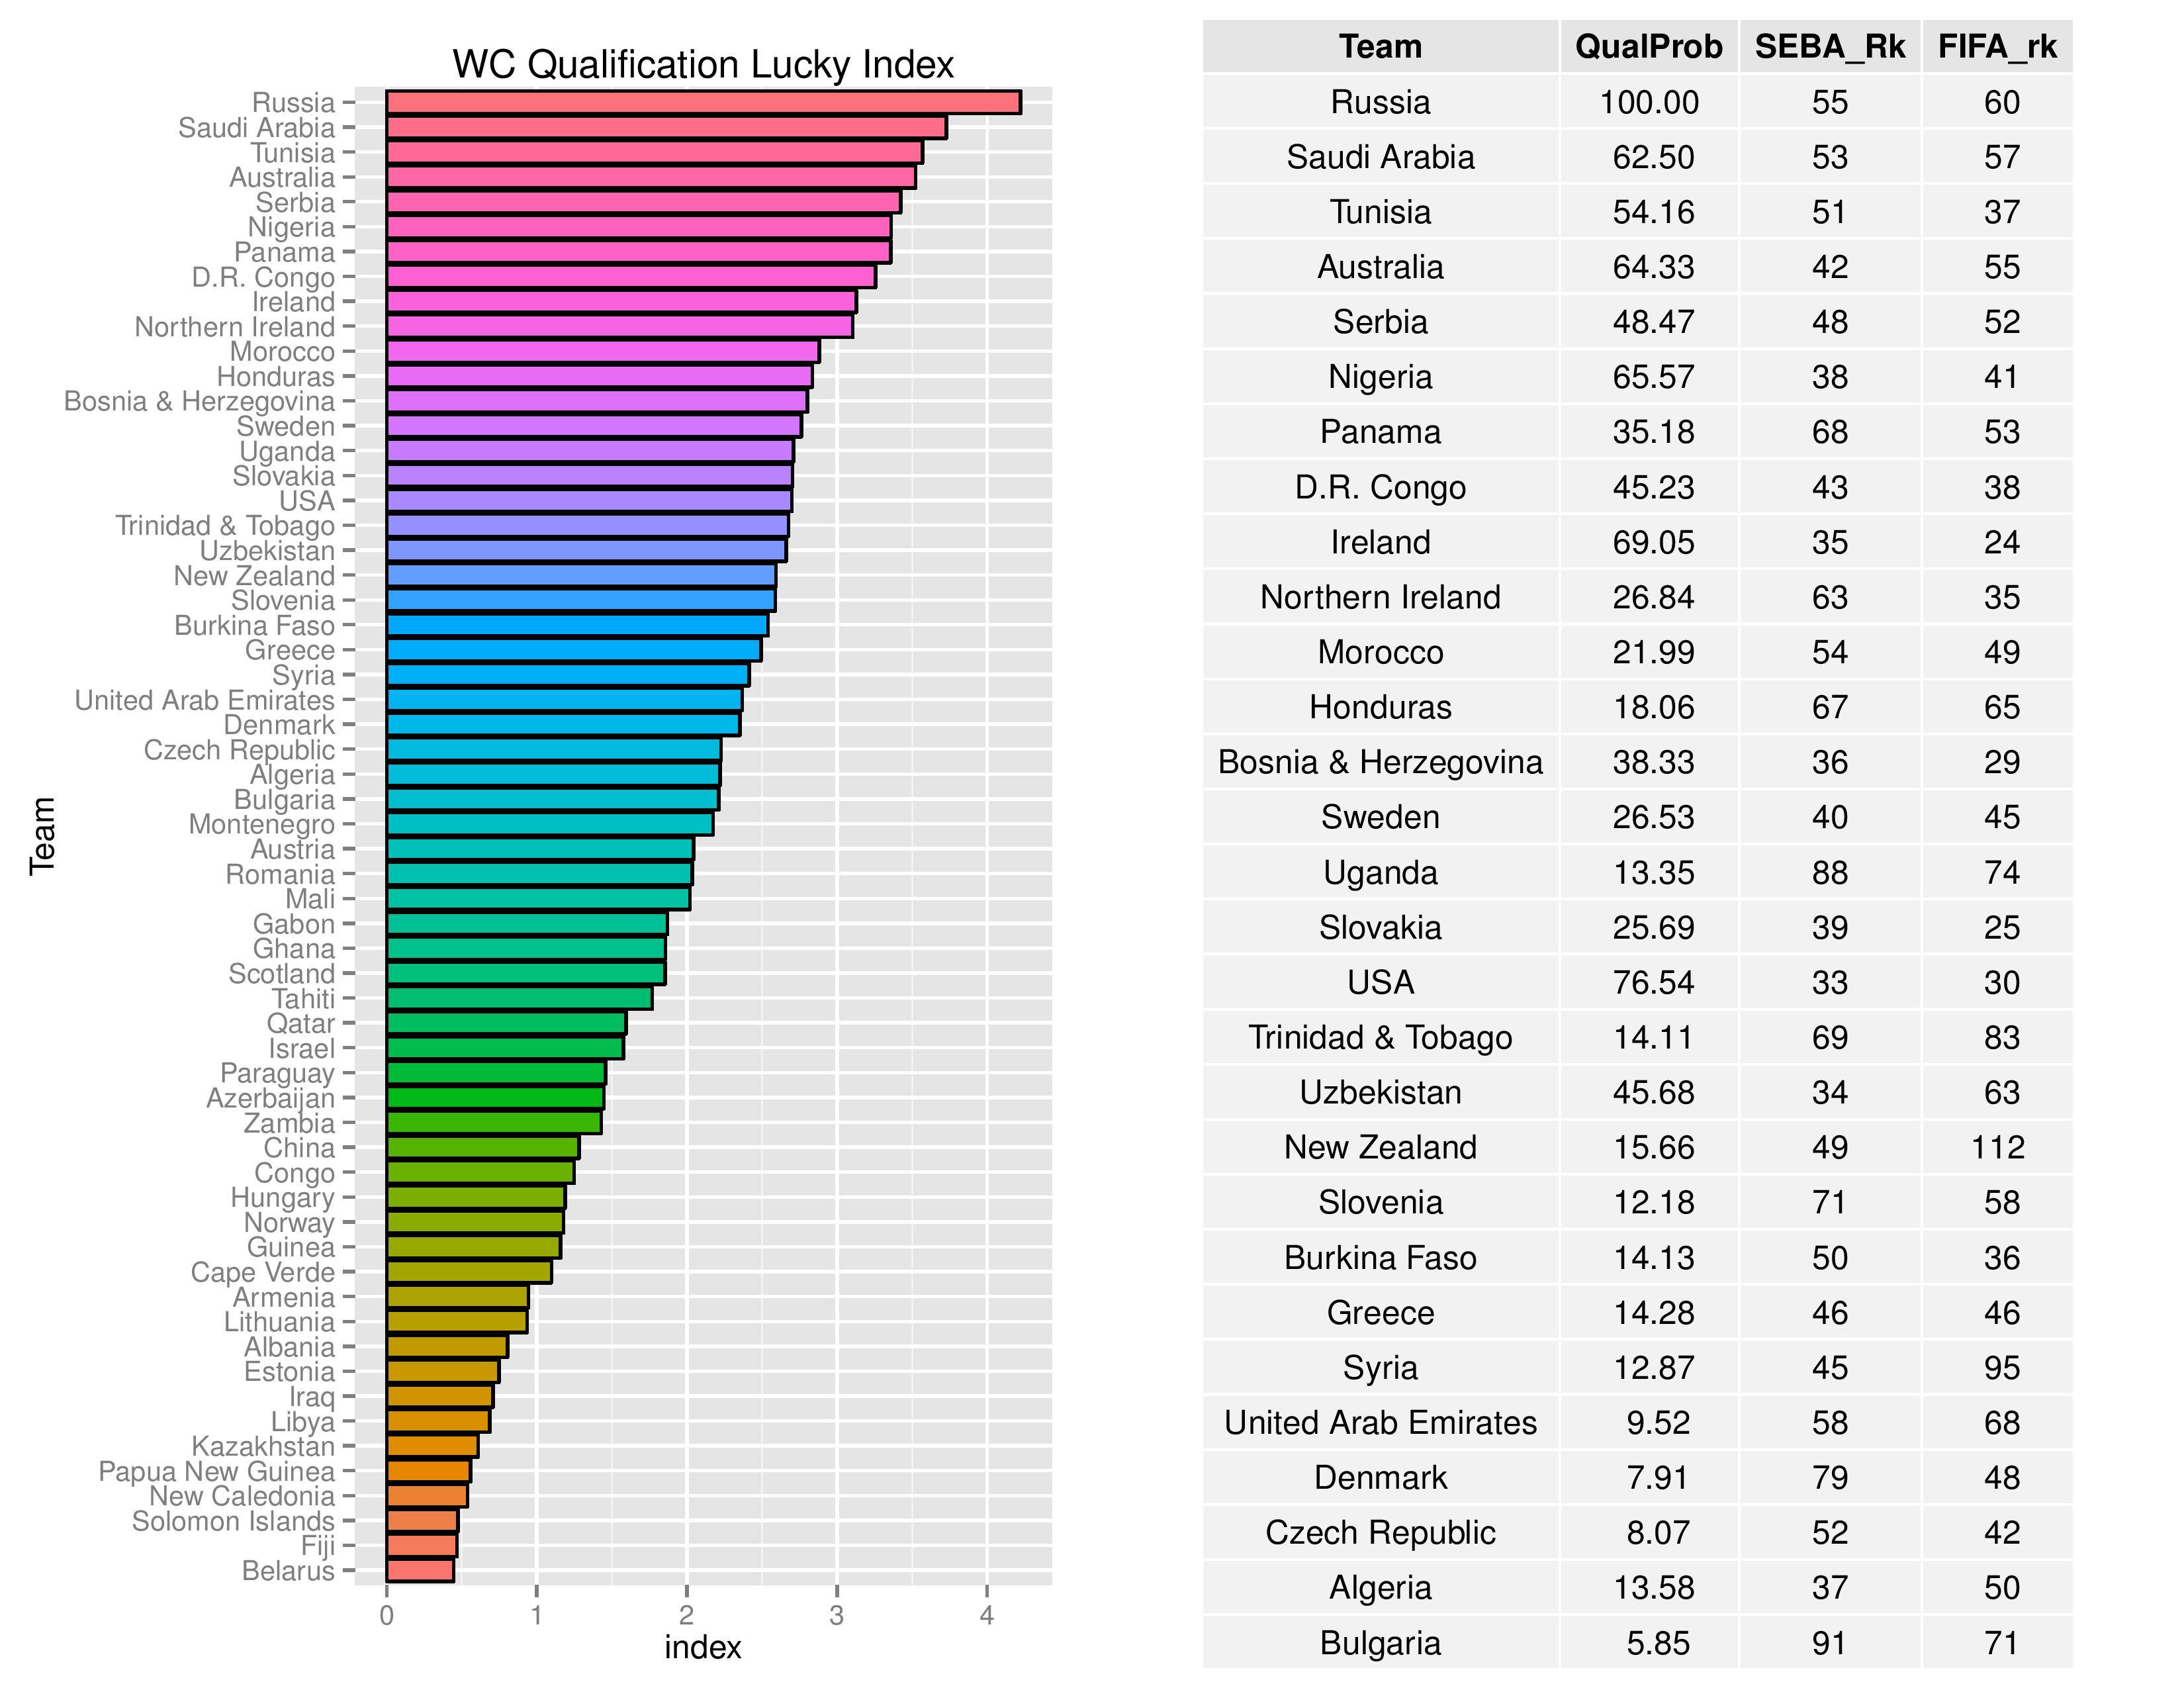
On the other side, this chart shows the nations outside of the top-32 who, perhaps unfairly, benefit from an imperfect qualification system and are ranked by their benefit (the table shows only the top 29 teams but the graph shows all teams with a chance).
The USA are currently recognized as the 17th “luckiest” national team, as they are rated as the 33rd-best-team and still have about a 77% chance of qualifying.
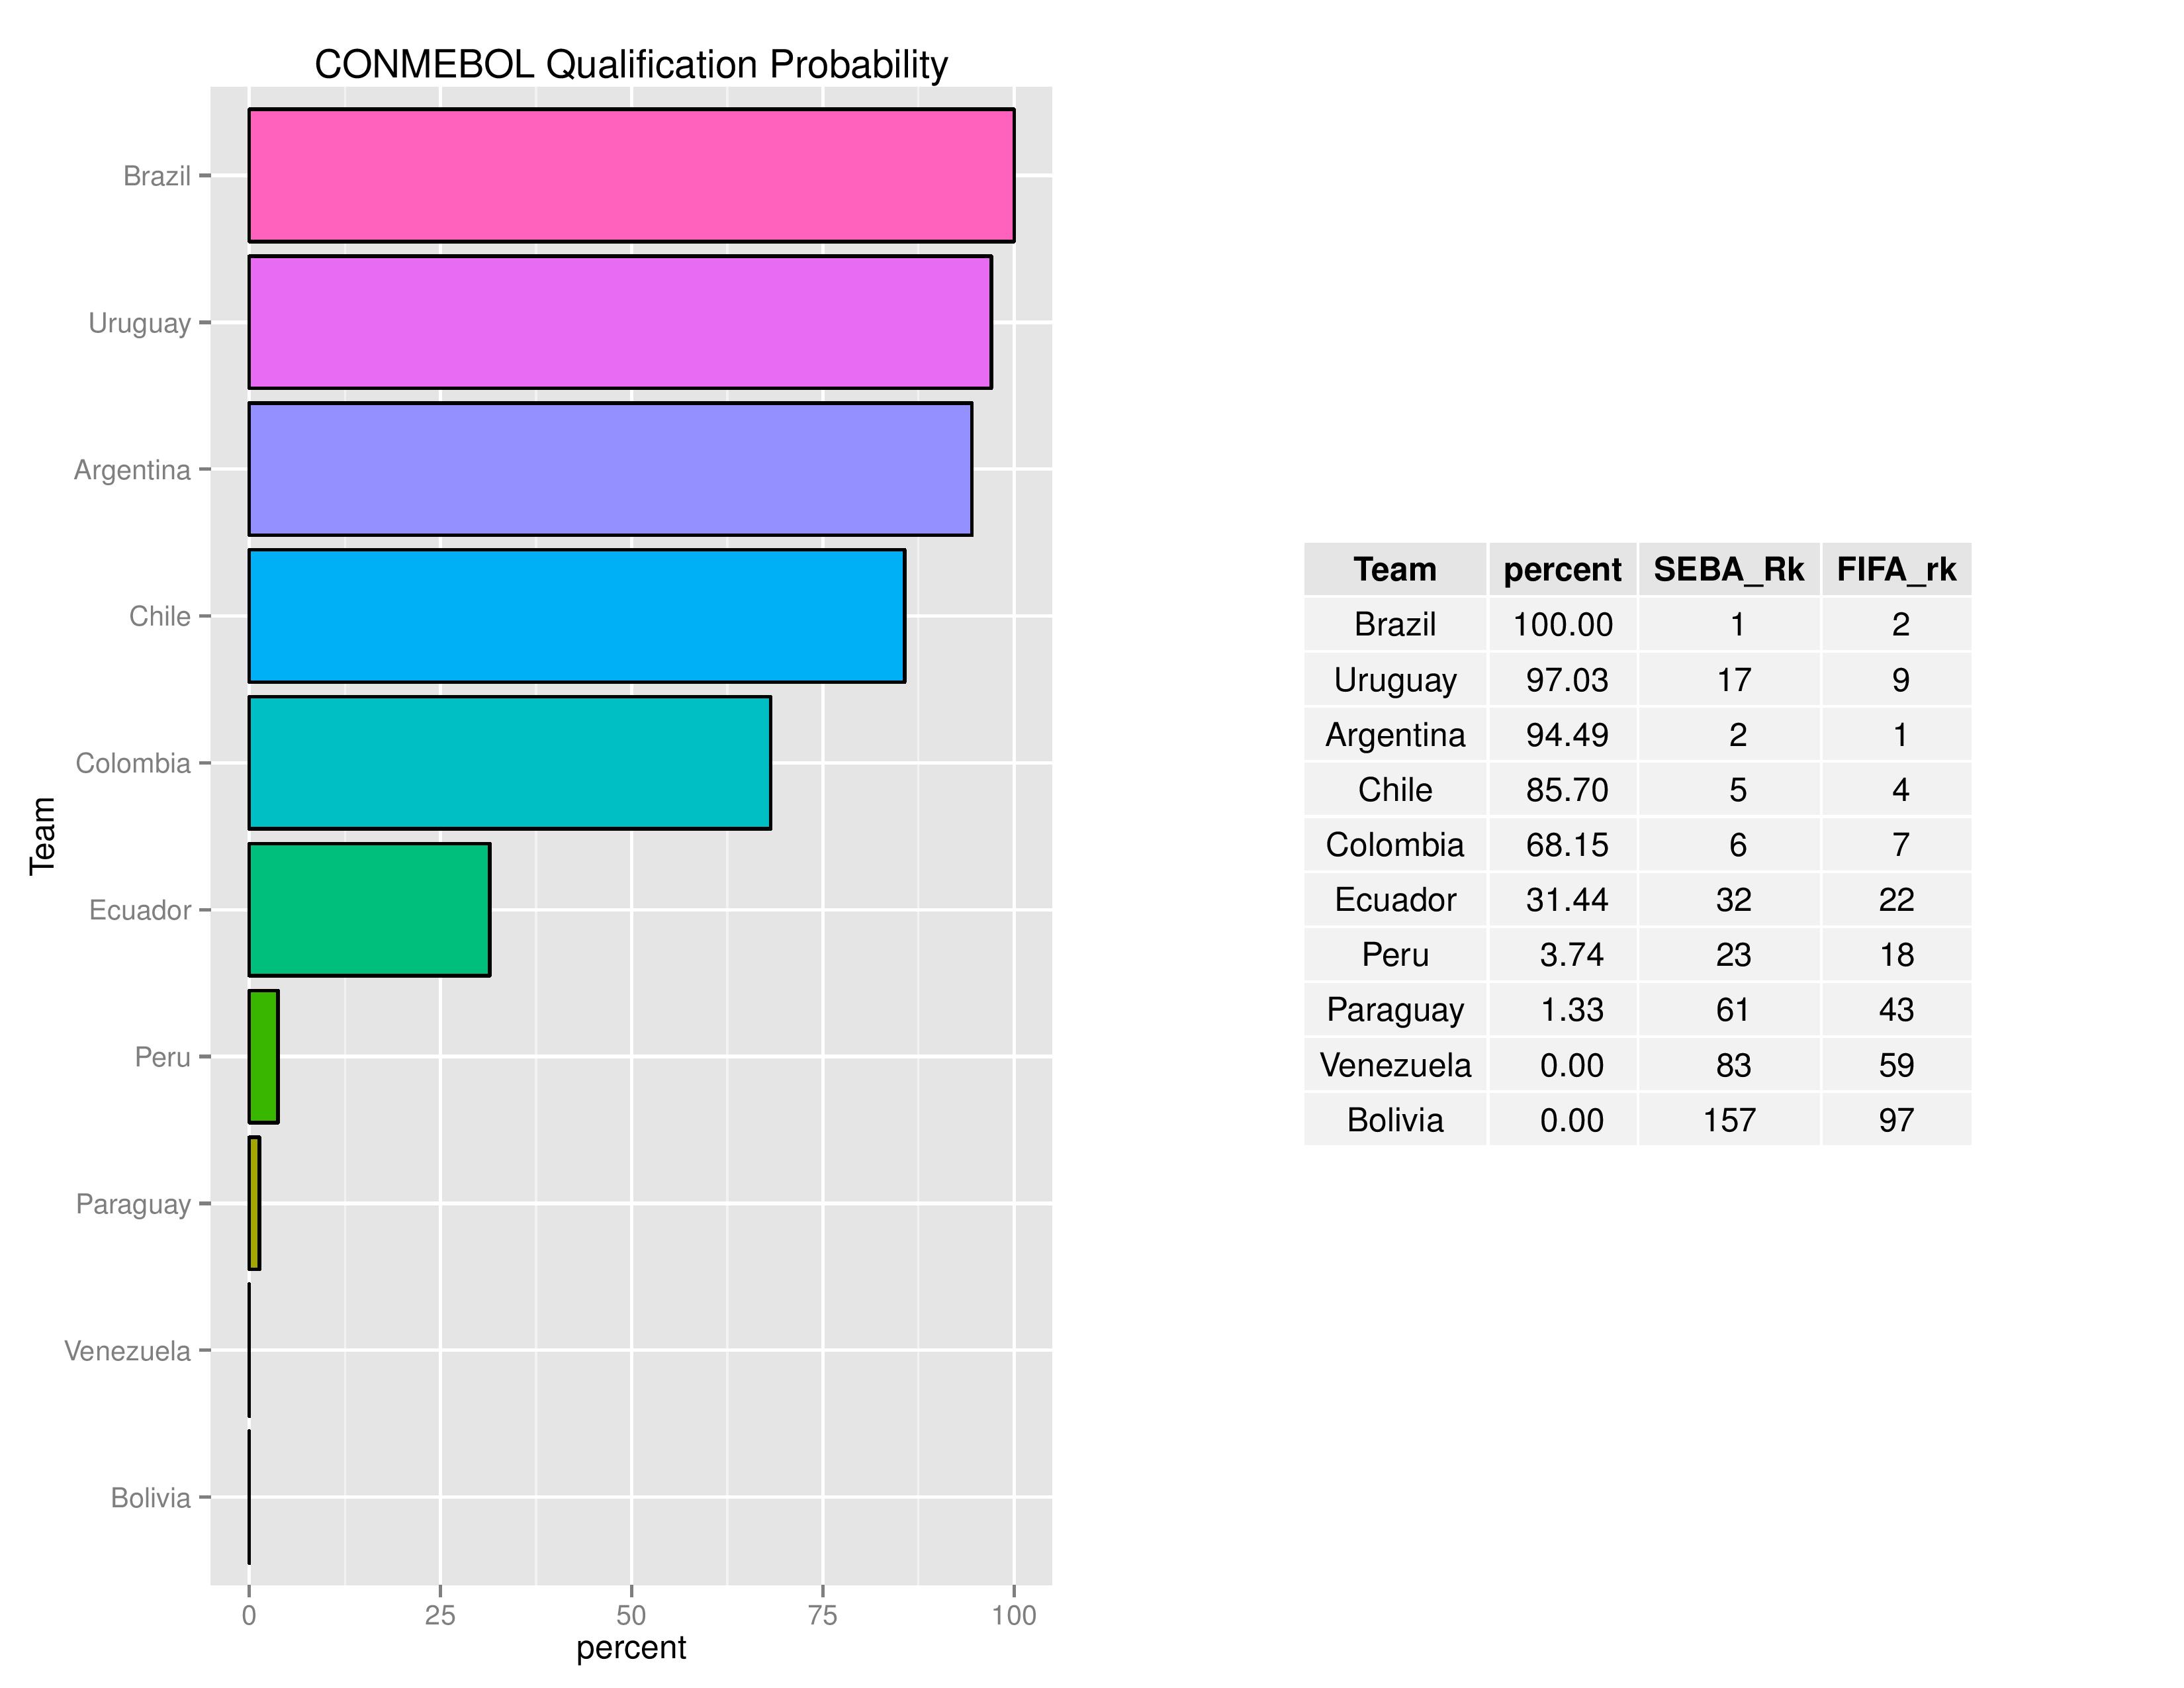
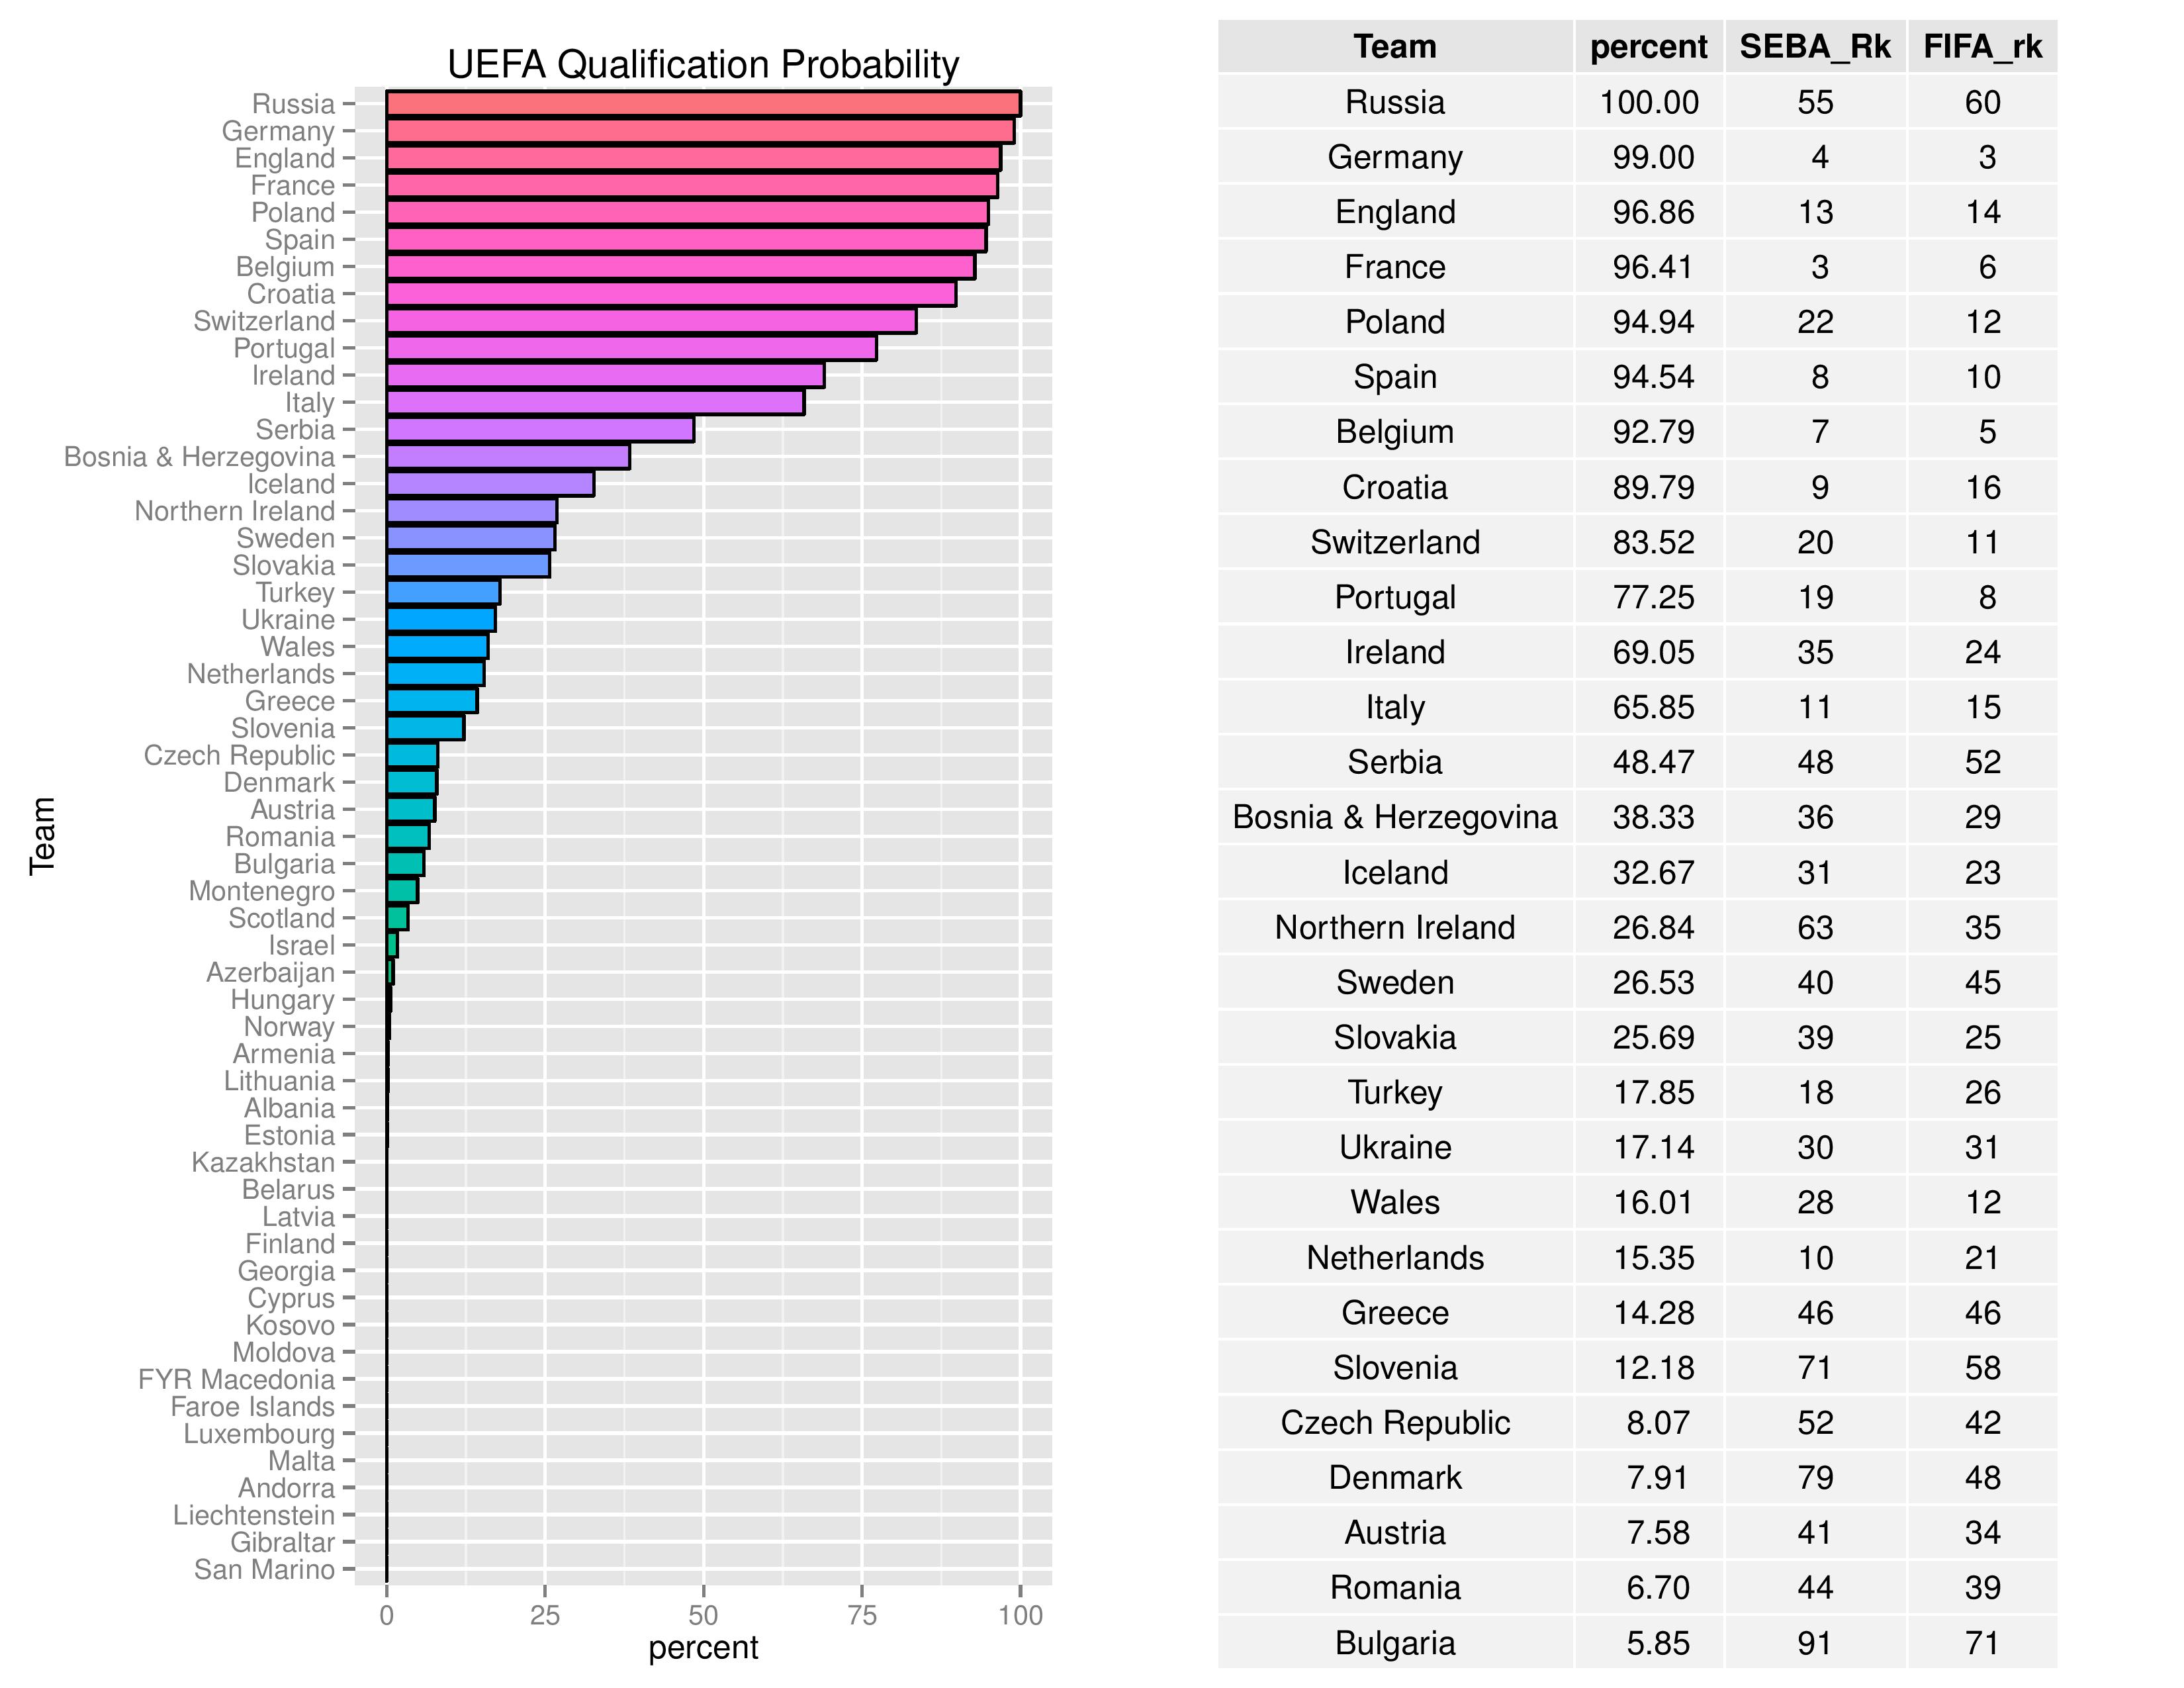
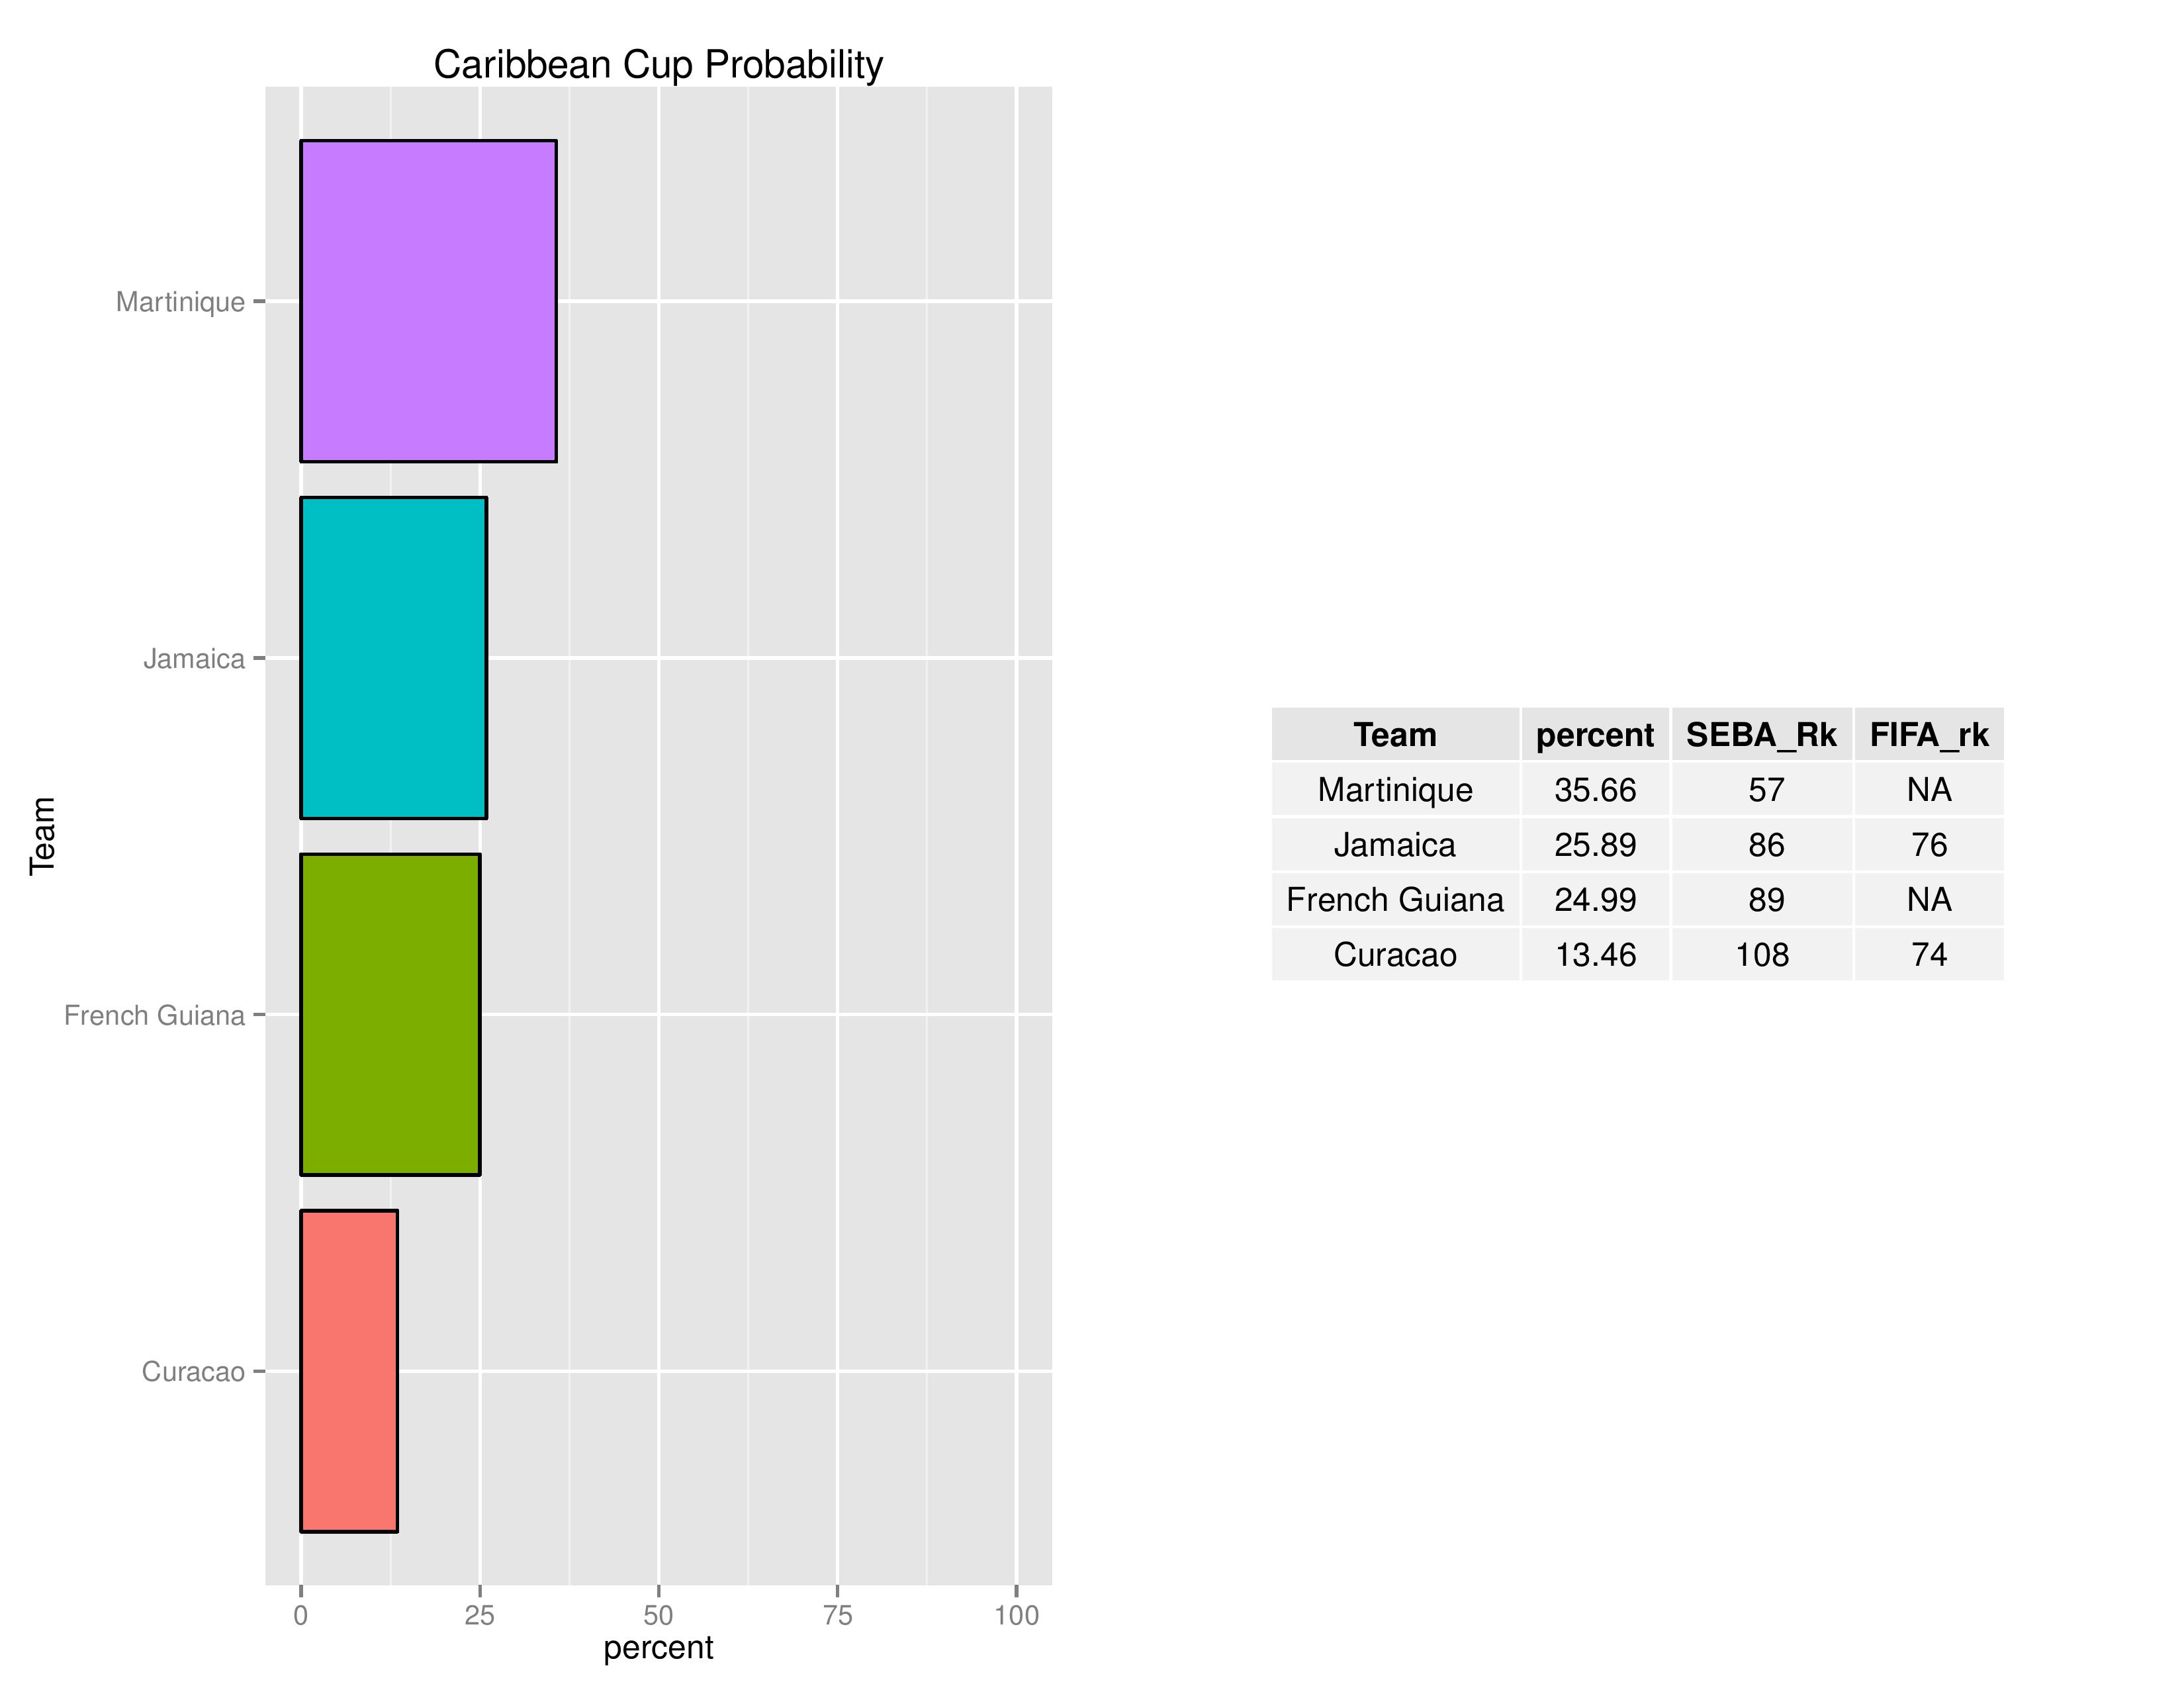
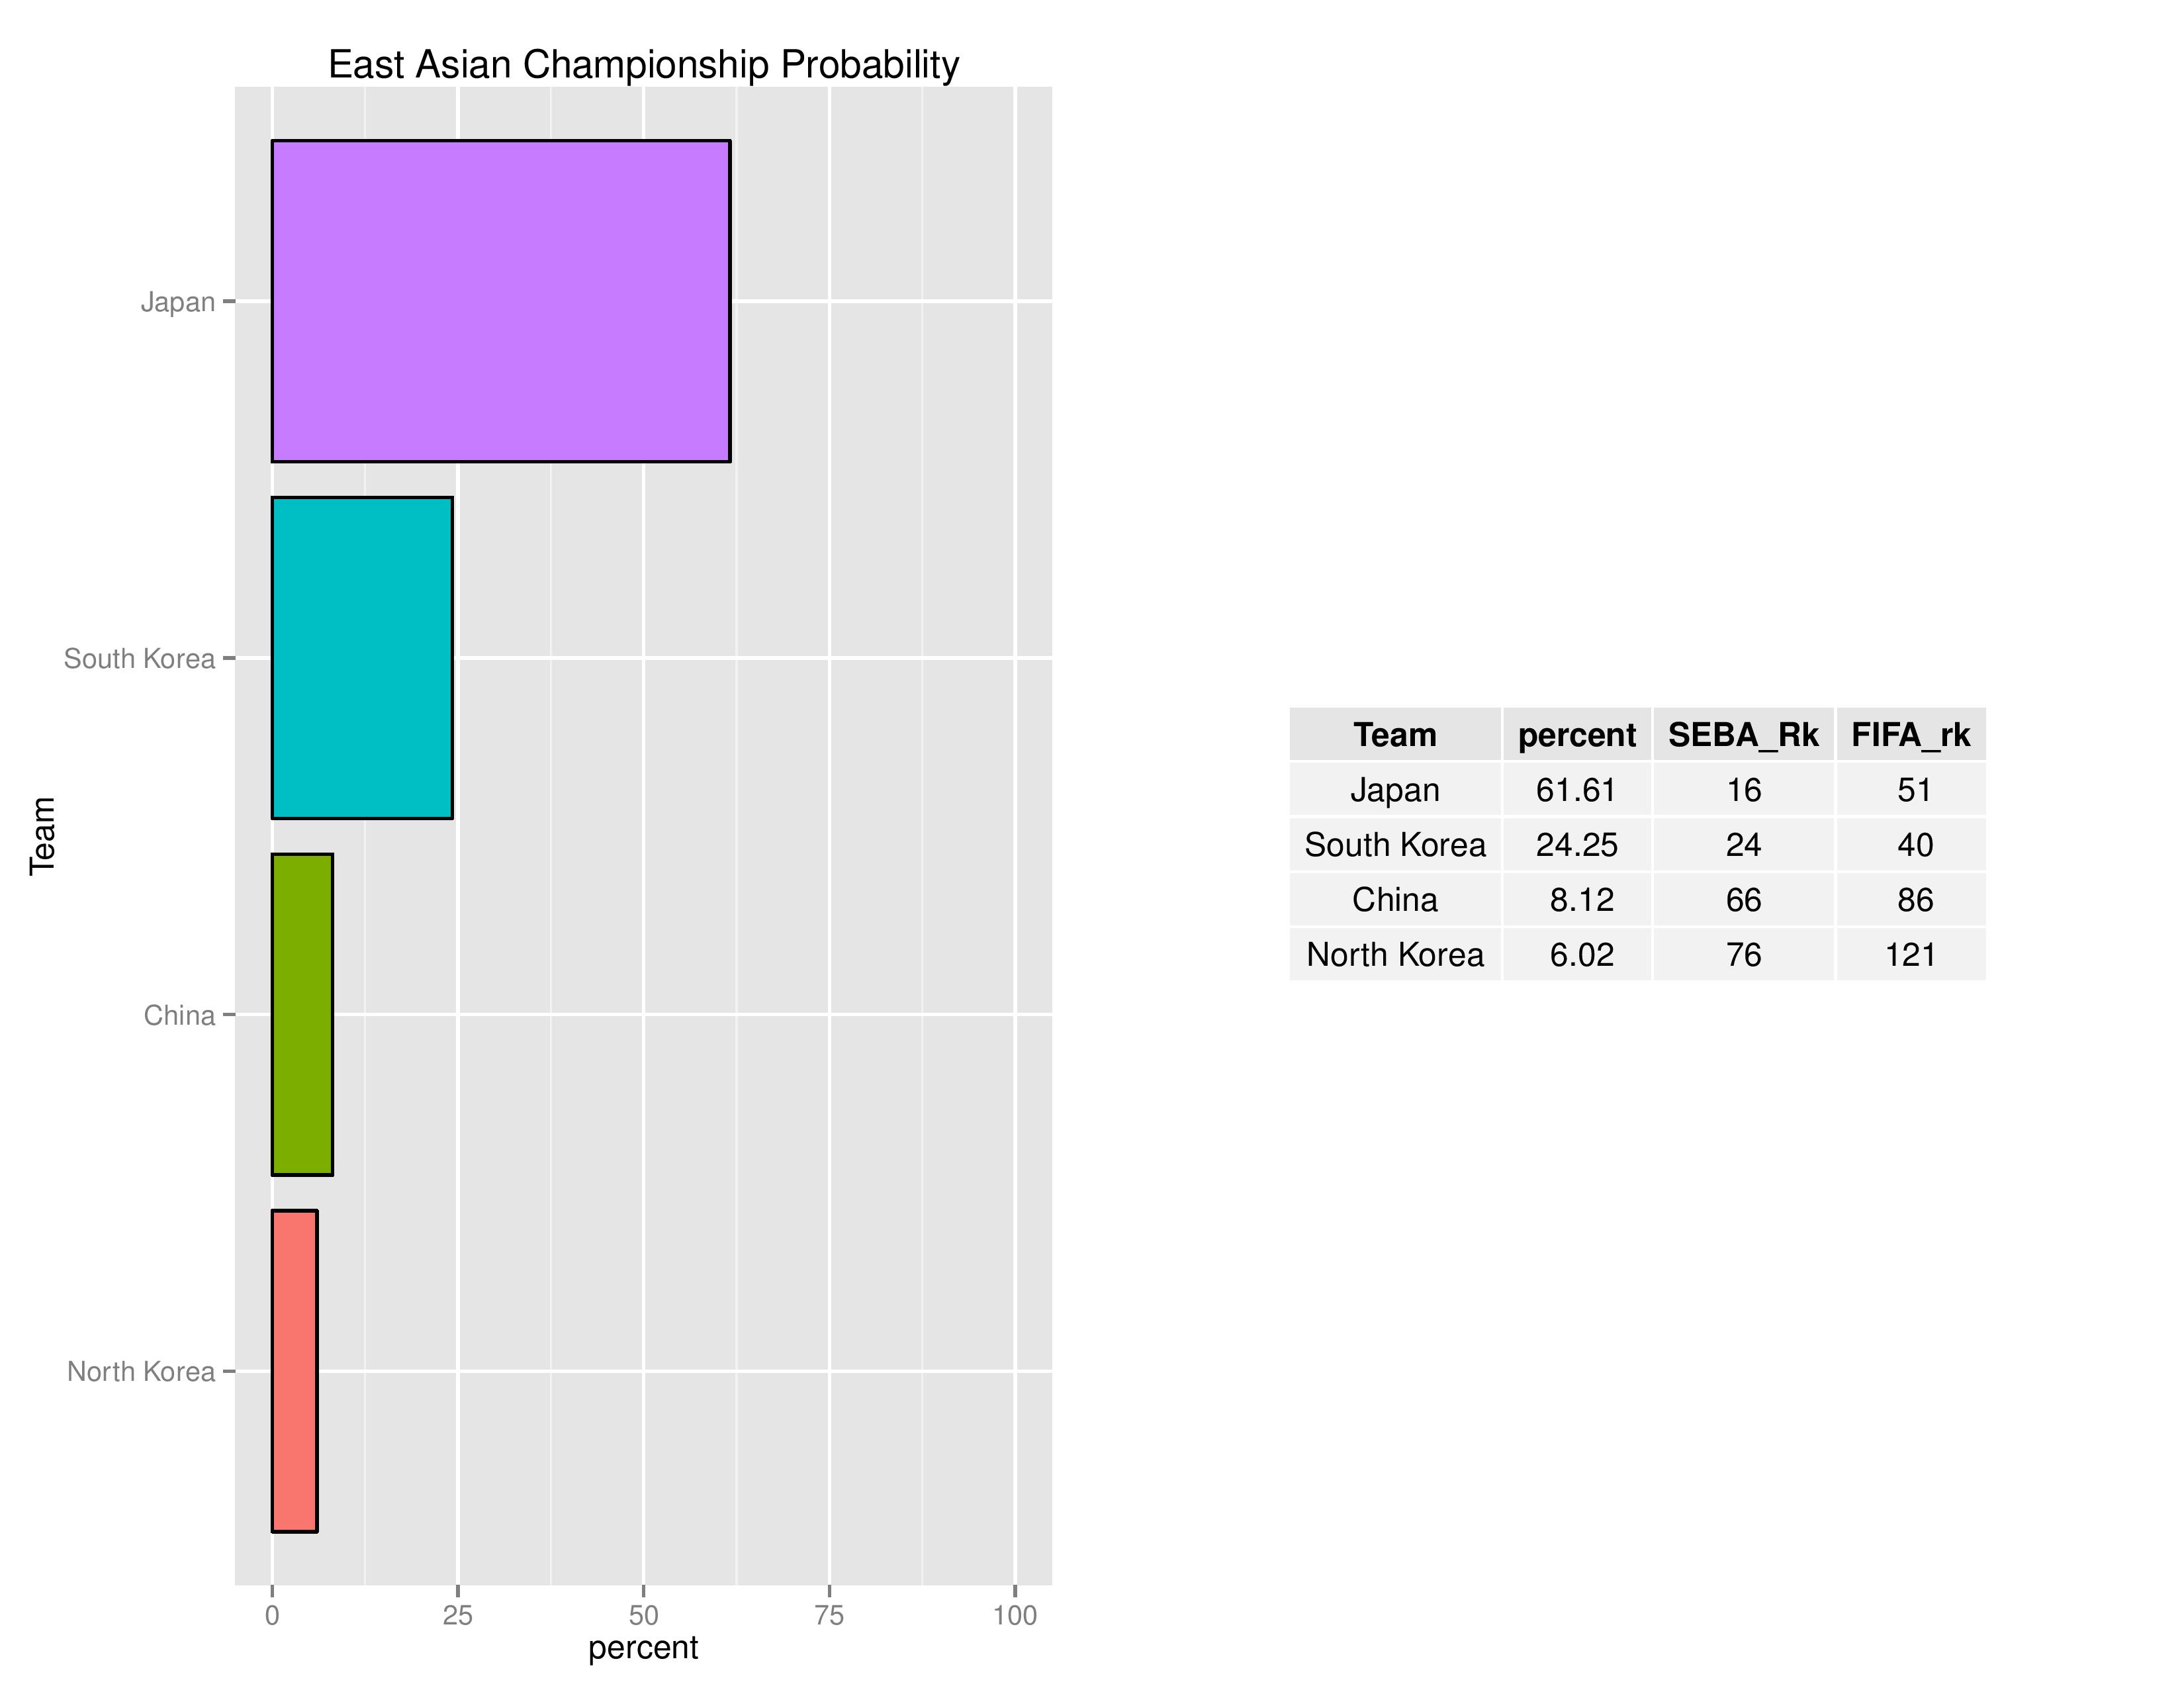
The next charts show the probabilities of other confederations qualifying for the World Cup.


*Additionally, it should be noted that in previous published forecasts, the 2nd round of UEFA’s world cup qualifying was mistakenly excluded from calculation. Therefore, all UEFA teams (except host Russia, of course) have increased their odds of qualification.
So… I went a little crazy over the MLS off-season and I decided I wanted to forecast the 2018 World Cup as well. The difficulty with this is that seeding for the groups depends on the FIFA ranking system, which means I would need to forecast every team’s rank to determine the “Pot 1” teams.
For those who don’t know, Pot 1 in the World Cup refers to the host and the top 7 teams according to FIFA rankings. These will represent the Group leaders for the first round of the World Cup. The remainder of the teams in the groups are placed semi-randomly with attempts to avoid over-concentration of teams from the same federation.
For the last World Cup, the October 2013 rankings were the ones deemed ‘final’ before the World Cup draw so I’m now assuming October 2017 are the ones to shoot for. I also don’t have the forecast system perfectly aligned with reality, although it is quite similar. I have not built in the different point outcomes for PK-wins/losses in my FIFA ranking projections and I, obviously, do not have a mechanism for forecasting currently-unscheduled friendlies. However, I have forecasted every scheduled tournament between now and October.
Below shows the simulated ranks for the USA. Summary statistics are below the chart. USA’s most common forecasted rank is 24, but could go as low as 10 and as high as 71. USA’s current rank is 30.

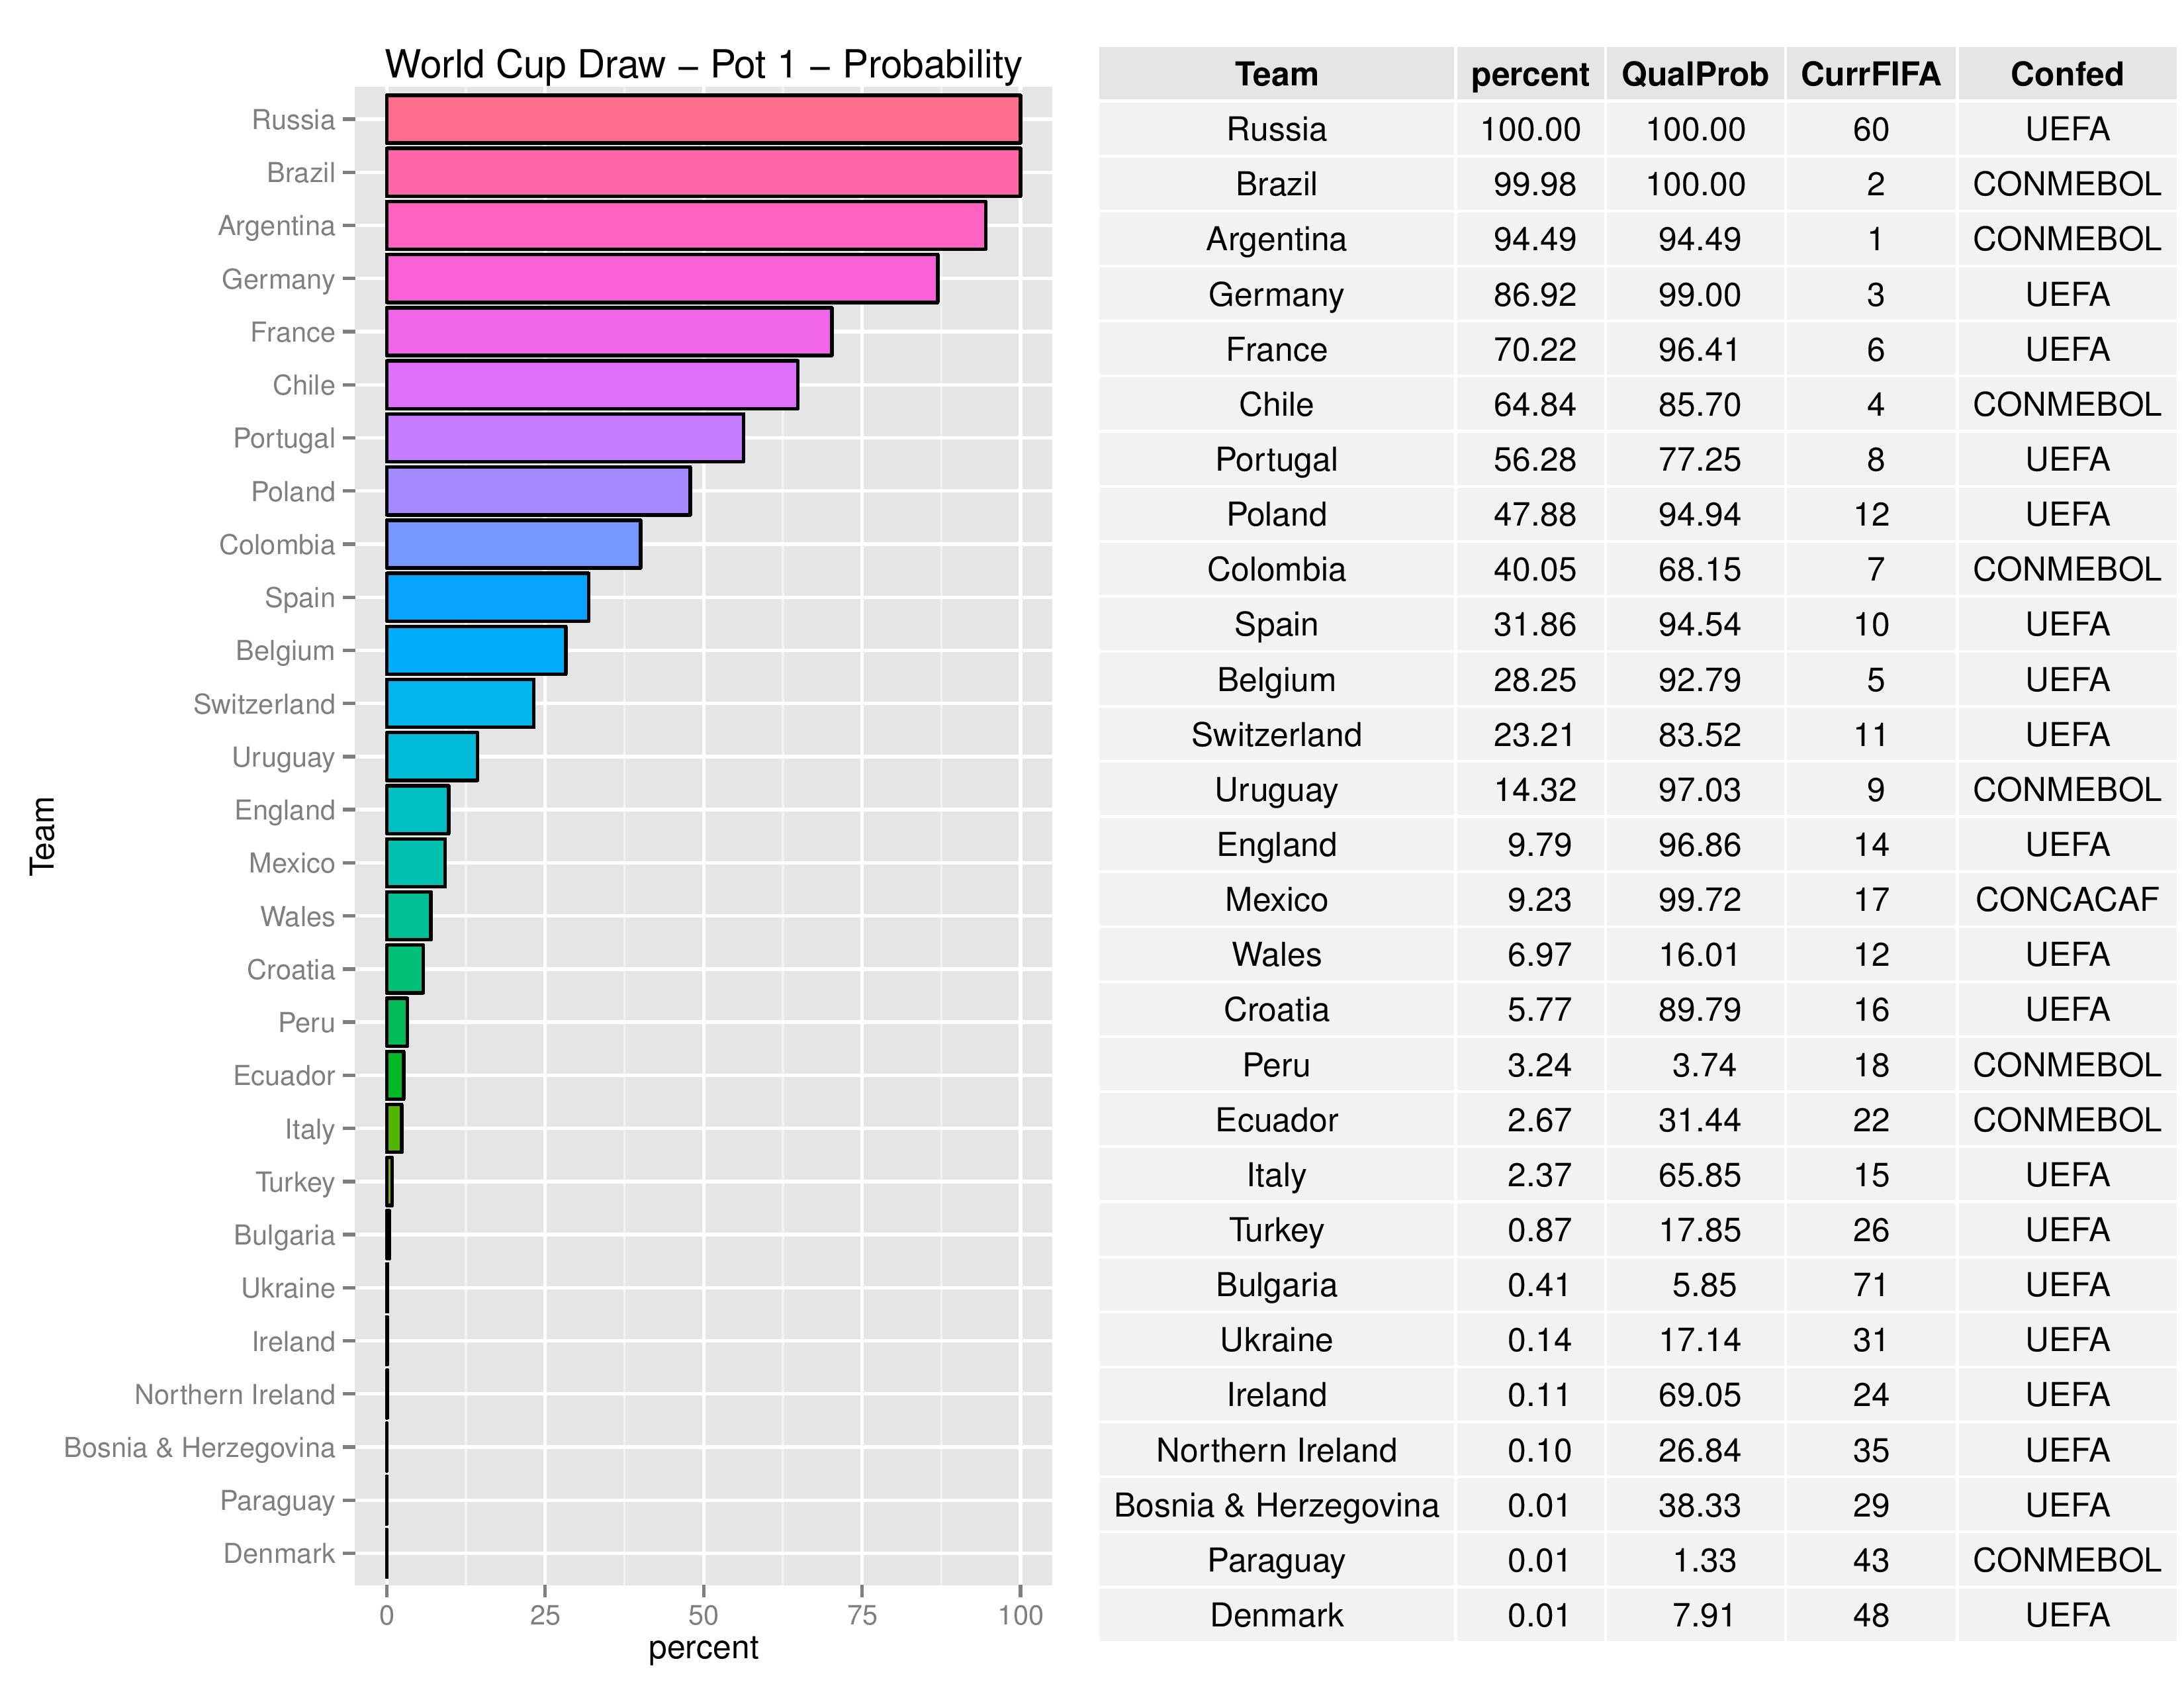
Below is the probability of obtaining Pot 1 status. In the table we also include the team’s qualification probability (if they don’t qualify, they can’t be in Pot 1), their current FIFA rank, and their confederation for helpful information.
USA did not not reach Pot 1 in any of the 10,000 simulations. A lot of this is due to not having enough opportunity to ascend further in FIFA rankings. Mexico has a better chance in part due to currently being a higher rank, but also due to their qualification for the Confederations Cup, which gives a large importance multiplier in addition to top-ranking competition.
The following then manages to forecast the 2018 World Cup. Again, we accompany the odds of victory with qualification probability to help understand why some teams may be lower than expected. The USA has a 0.91% chance of winning the World Cup.

As I had to forecast these tournaments for projecting the Pot 1 draw, I might as well show the results of all the forecasted international tournaments.
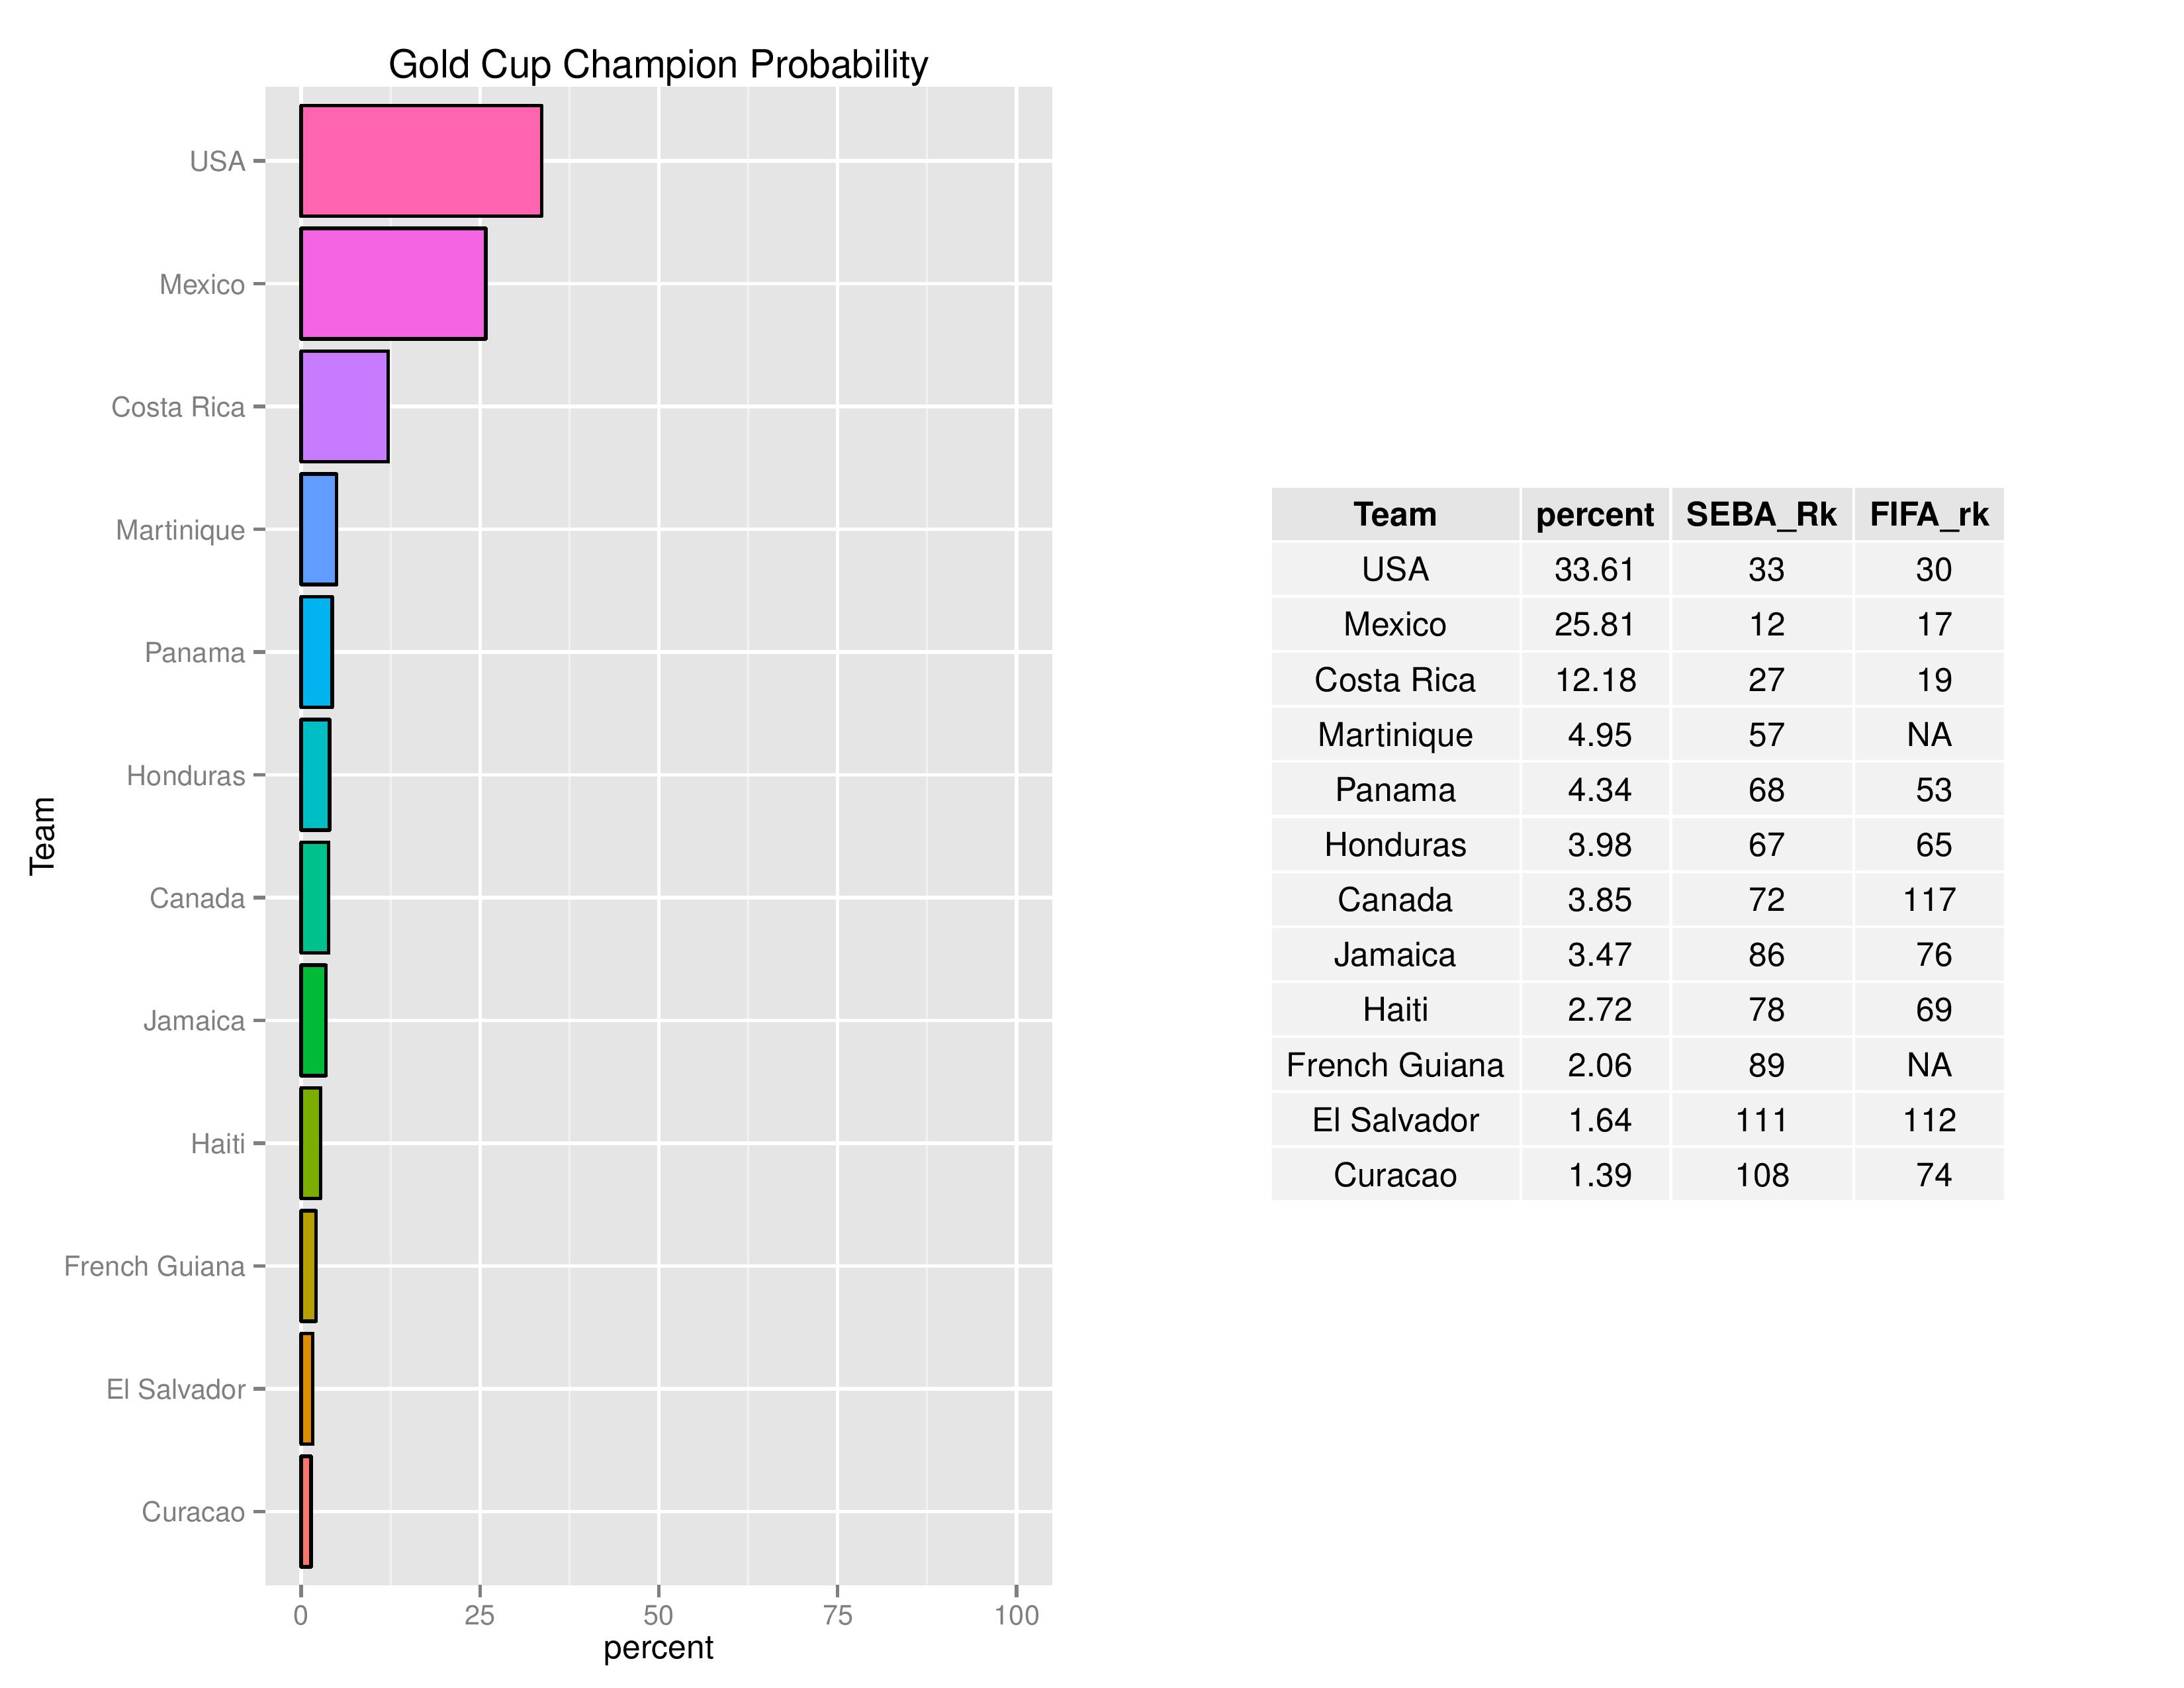
The following shows the Gold Cup champion forecast. With the benefit of hosting, USA has a 33.61% chance of winning the Gold Cup this year.
The following shows the Confederations Cup projections. CONCACAF’s representative, Mexico, has an 18.32% chance of winning. They have the second-highest odds, thanks in part to an easier draw (with Russia, Portugal, and New Zealand) according to SEBA’s rankings.

FIFA Comparison
What is the difference between SEBA and FIFA and why is it important?
Well, for starters, SEBA is built upon a statistical model whereas FIFA rankings use a logic-based algorithm. However, SEBA’s model includes its share of logic-based assumptions in training the model, so this isn’t necessarily a call to be snooty. But I still found a way…
Factors that go into FIFA’s ranking system:
- Match points (3 x in-play-win, 2 x PK-win, 1 x draw or PK-loss, 0 x loss).
- Importance multiplier. The multiplier scales higher for more important tournaments and lower for friendlies.
- Opponent strength. The higher their most-recent-rank, the higher the multiplier (and potential points with a win).
- Confederation strength. This multiplier is based on how many wins in the last three world cups occur for each confederation (compared with other federations). As it stands now, CONMEBOL and UEFA get a bonus.
My thoughts on FIFA’s system:
- I have no real objection with the match points factor. I’m not sure a PK-win should count as more than a draw, but whatever.
- With the importance factor, I’m generally fine with it. I definitely agree that friendlies should be discounted (in SEBA, a friendly’s weight in the model is discounted the same as a match that occurred a year ago). I’m not sure a team is ‘playing harder’ in the world cup tournament than in a World Cup qualifier, but again, I’m not concerned.
- Opponent strength is slightly flawed but not in an unusual way. Similar to an Elo-based system (think of how chess players are rated), this treats higher-rated players/teams as being worth more points upon successfully defeating them. In my opinion, a system such as this works best when a match outcome has very little to do with luck (which doesn’t sound like soccer to me) and when their true skill changes considerably over time, reflected in those match results. The, in my opinion slightly flawed, reason it is used in FIFA rankings is that luck of timing plays a role. If a high-ranking team like Germany loses a few of its starters to injuries, then whoever plays them next has a great opportunity to grab points, compared with teams who might play Germany a few months later, playing the same exact squad, who might stand to gain fewer points because Germany’s lower rank has reduced the opportunity. Nonetheless, this minor flaw is not likely to have a large negative impact.
- My real objection is with the federation multipliers. I understand the spirit of this multiplier. Teams that don’t ever glimpse the World Cup might not often play outside of their federation at all. If a cluster of weaker teams only ever play each other, then there could be teams racking up wins despite never testing themselves against better competition, but nonetheless appearing to be strong via their record. This was also a challenge for SEBA to overcome, which I can go over a little later to explain its alternative.
- The problem is that this multiplier is based upon how well the top teams in the federation perform. However, this multiplier benefits all teams within the federation, regardless of how much they interact with top teams themselves. This really comes into play primarily with UEFA and their larger variance in skill sets. Weaker UEFA teams earn a greater amount of points-potential from all matches than peers in AFC, CAF, OFC, or CONCACAF.
- This perpetuates a cycle of self-fulfilling-prophecy. Weaker UEFA teams receive a larger multiplier for their matches and move up in rank. Then they play other UEFA teams with inflated ranks, causing an even larger pool of potential points.
- SEBA addresses this difficulty by treating a team’s isolation from World Cup-class teams as a predictive variable. If Papua New Guinea has five degrees of separation from most teams that competed in the previous World Cup, it will automatically be ranked lower regardless of how many OFC teams they manage to defeat. This can still have weaknesses, but I do currently believe this is better than other alternatives.
- My final objection comes with home field advantage. FIFA behaves as if this advantage does not exist for their rankings. I think that;s silly given how prevalent it is in all aspects of sports. The SEBA model takes home field advantage very seriously.
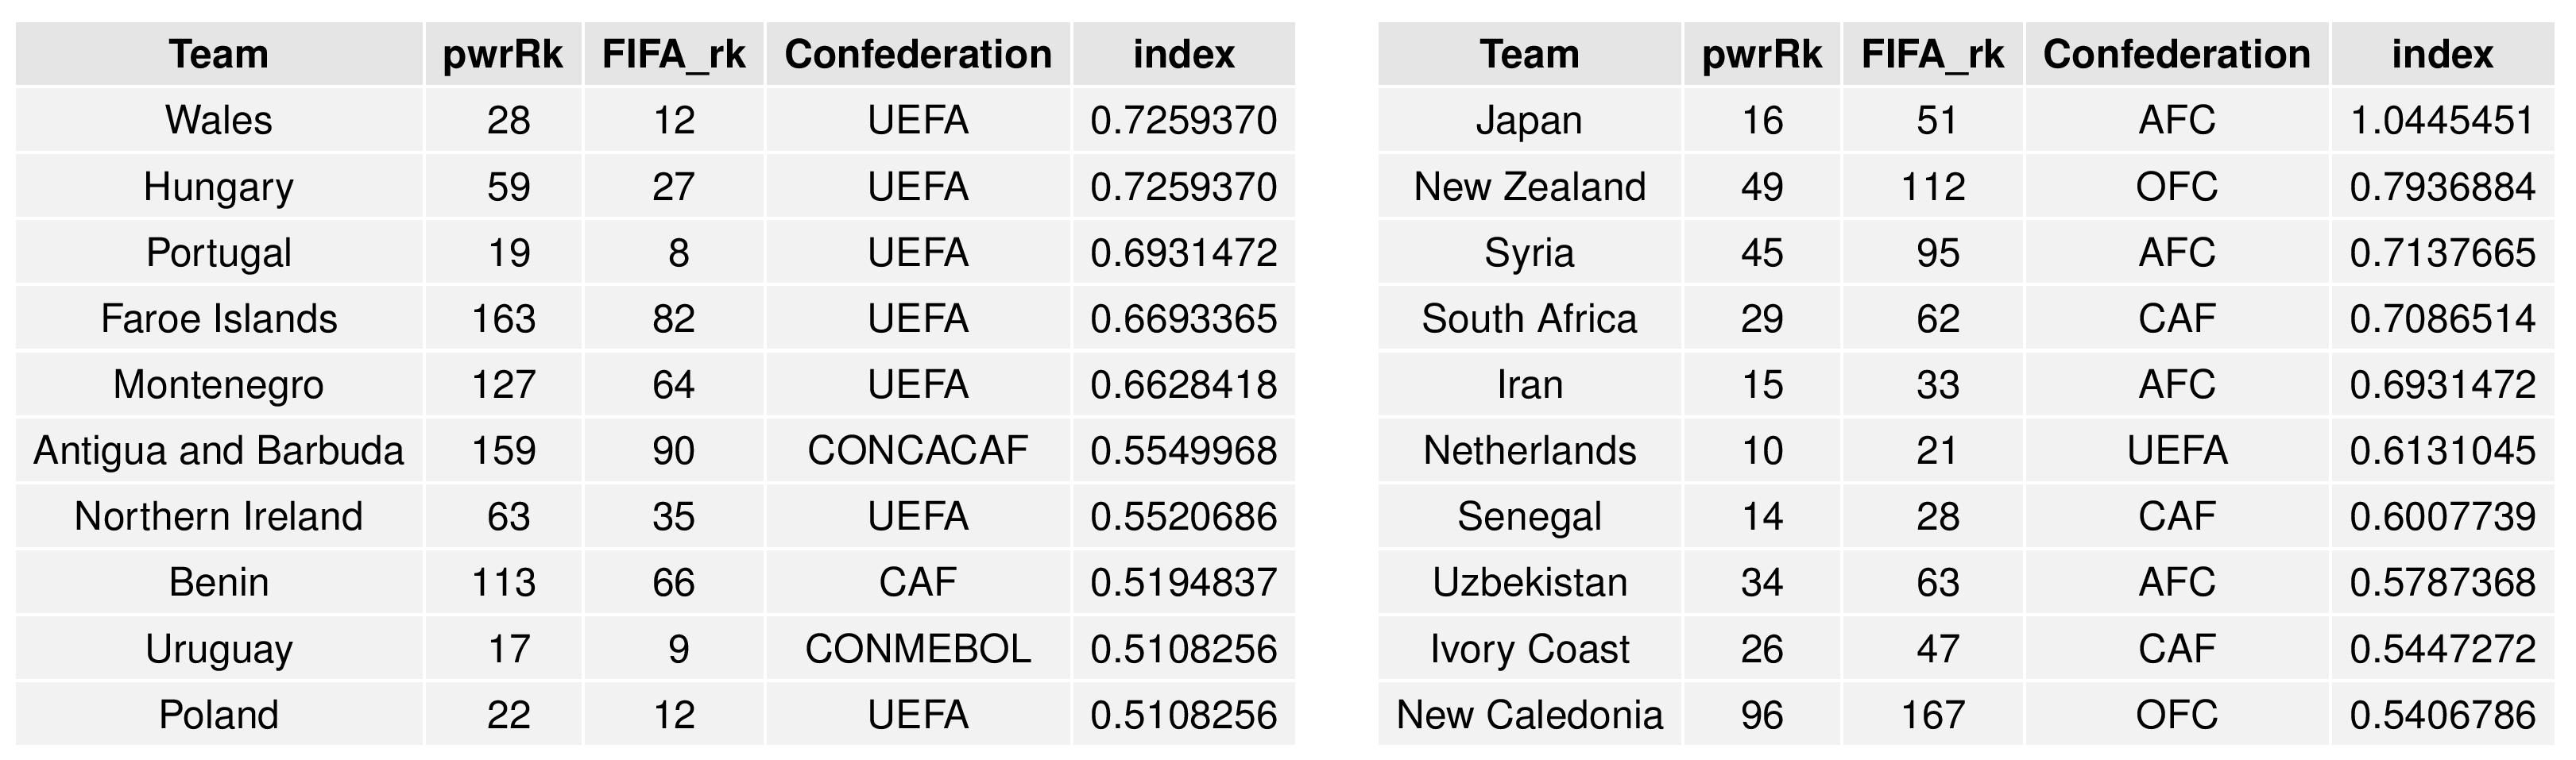
The following shows, according to SEBA, the top-10 overrated teams to the left and the top-10 underrated teams to the right. As you can see, UEFA represents many of the overrated, while the underrated are split often among AFC, CAF, and even OFC.
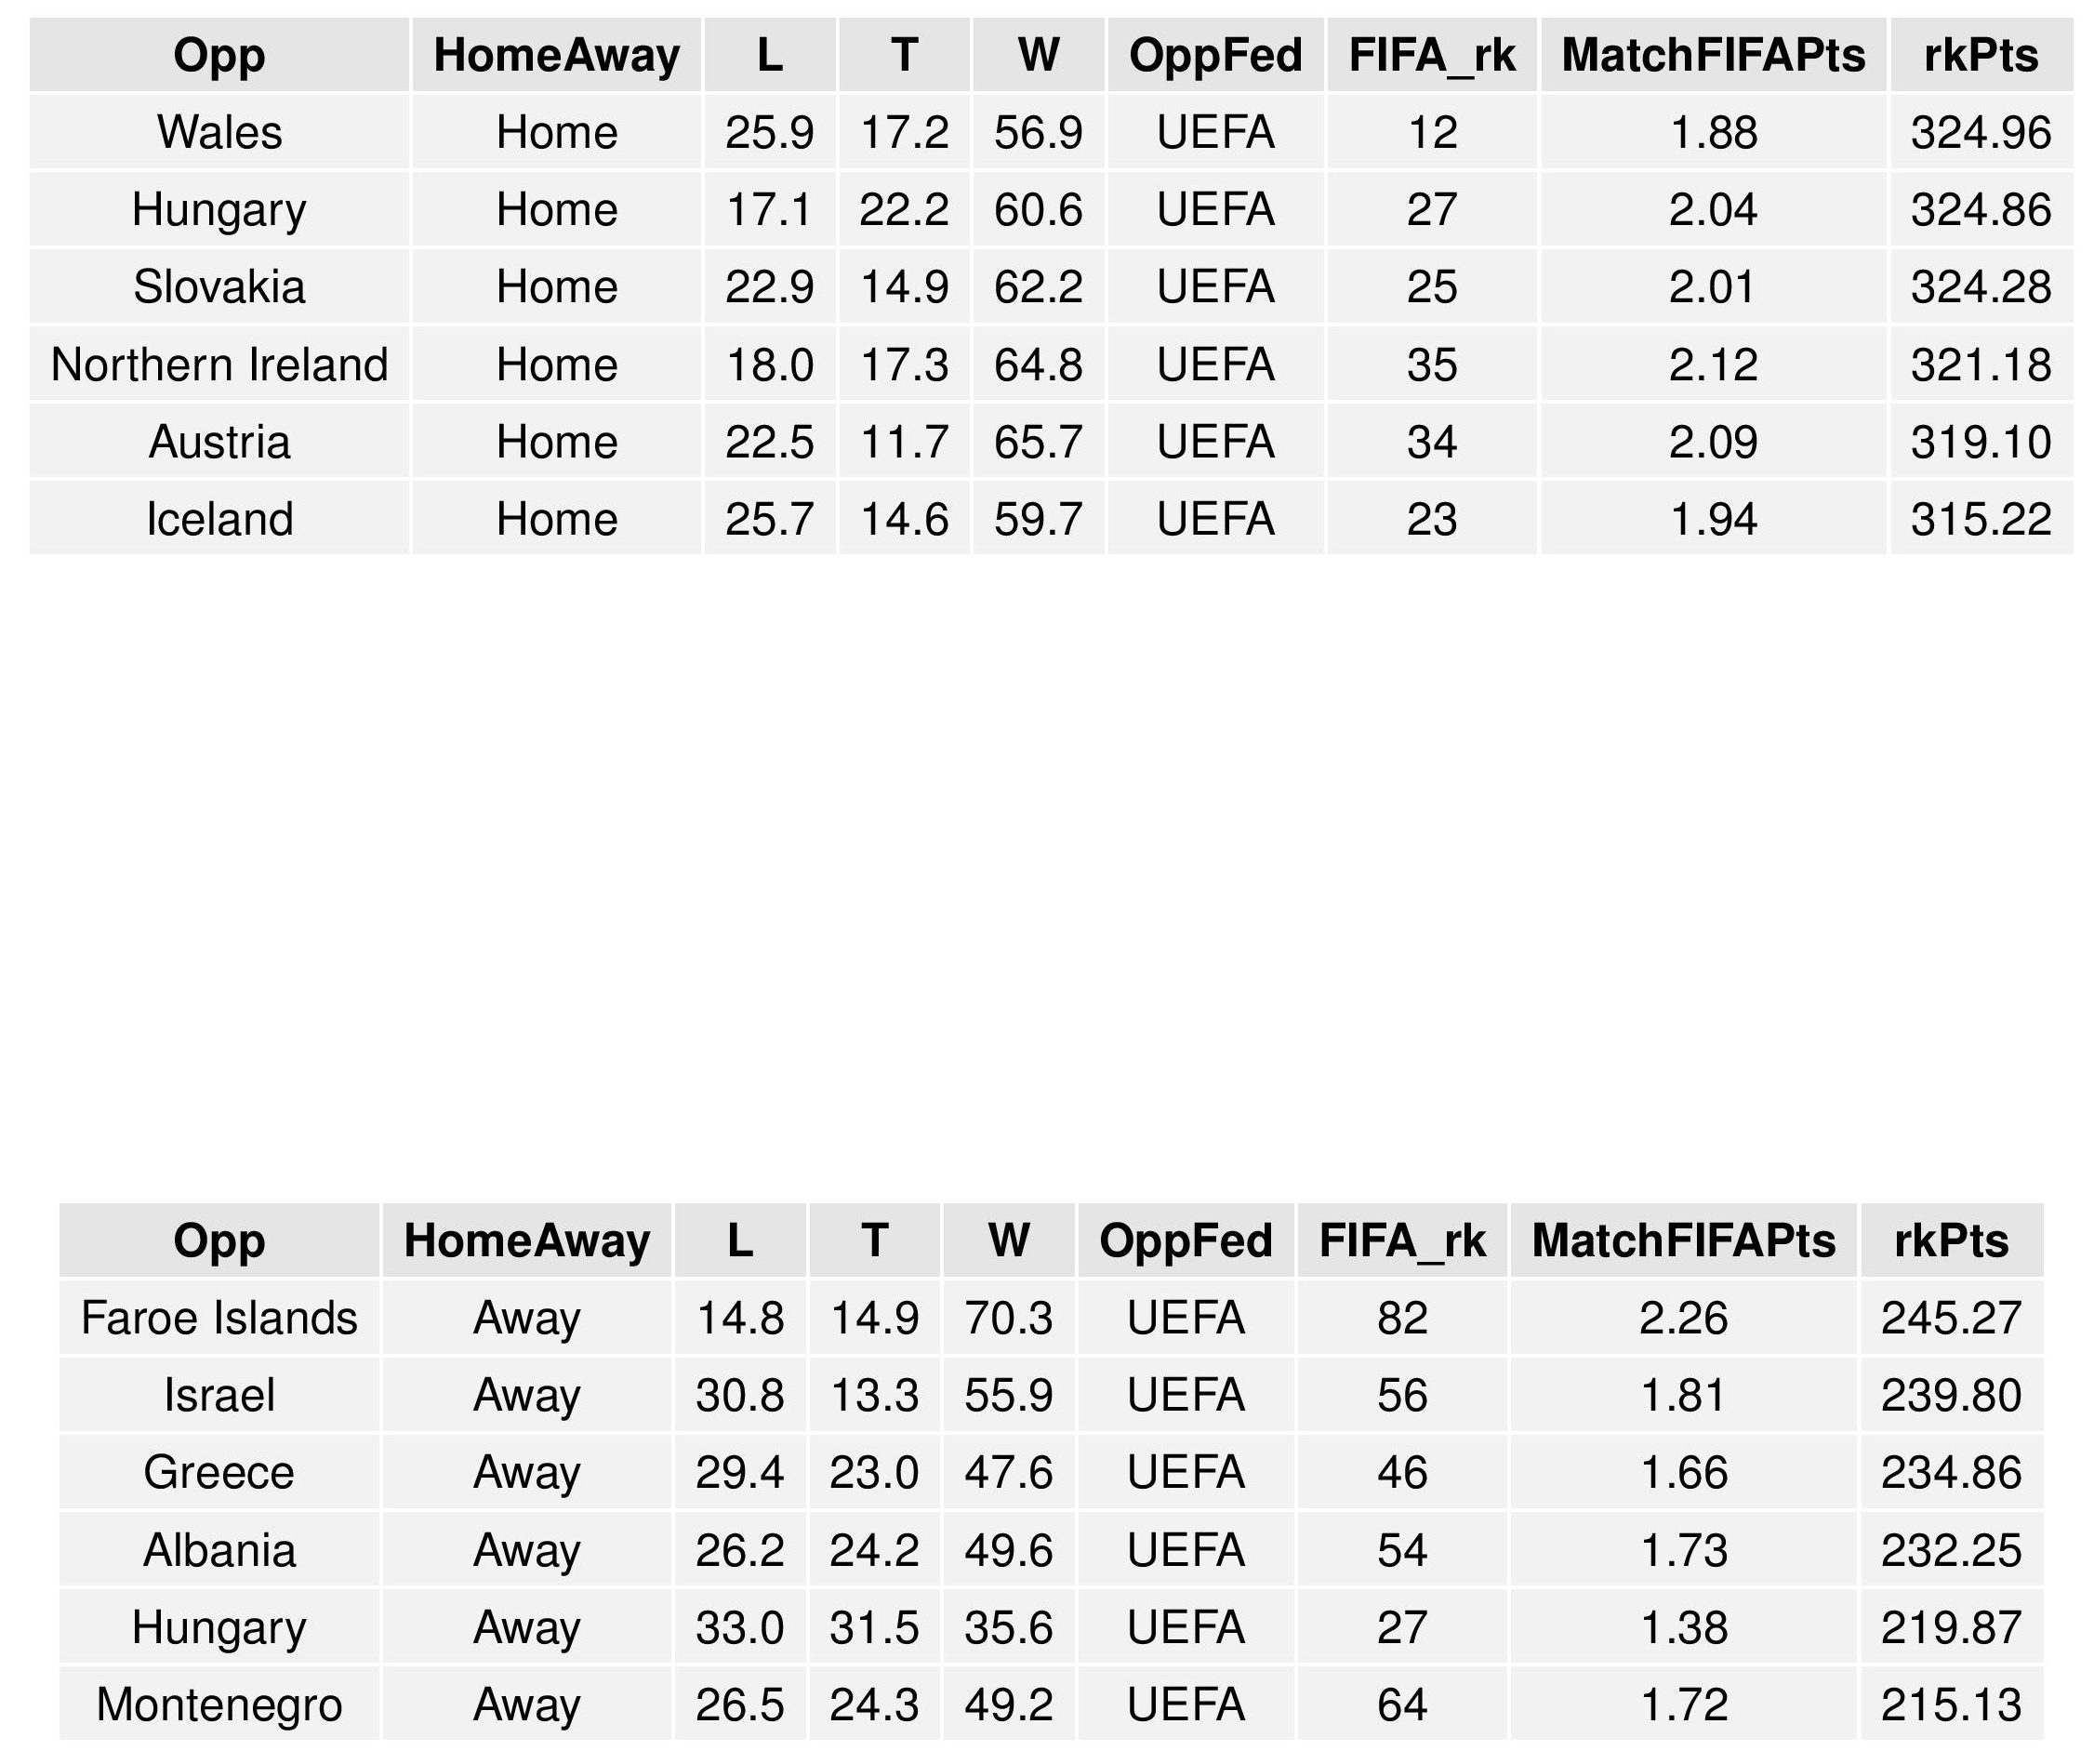
The following shows, if the USA wanted to schedule its friendlies to best manipulate the FIFA ranking system, who they should schedule against. The top table shows home matches, which are inherently the best choice for manipulating the FIFA rankings system. The bottom table shows, if the USA needs to schedule away friendlies, who they should schedule against in that scenario.
The MatchFIFAPts are 3-times-win-probability + draw-probability. rkPts represents the average expected points the USA might receive within FIFA’s point system for their rankings.
Scheduled USA Matches
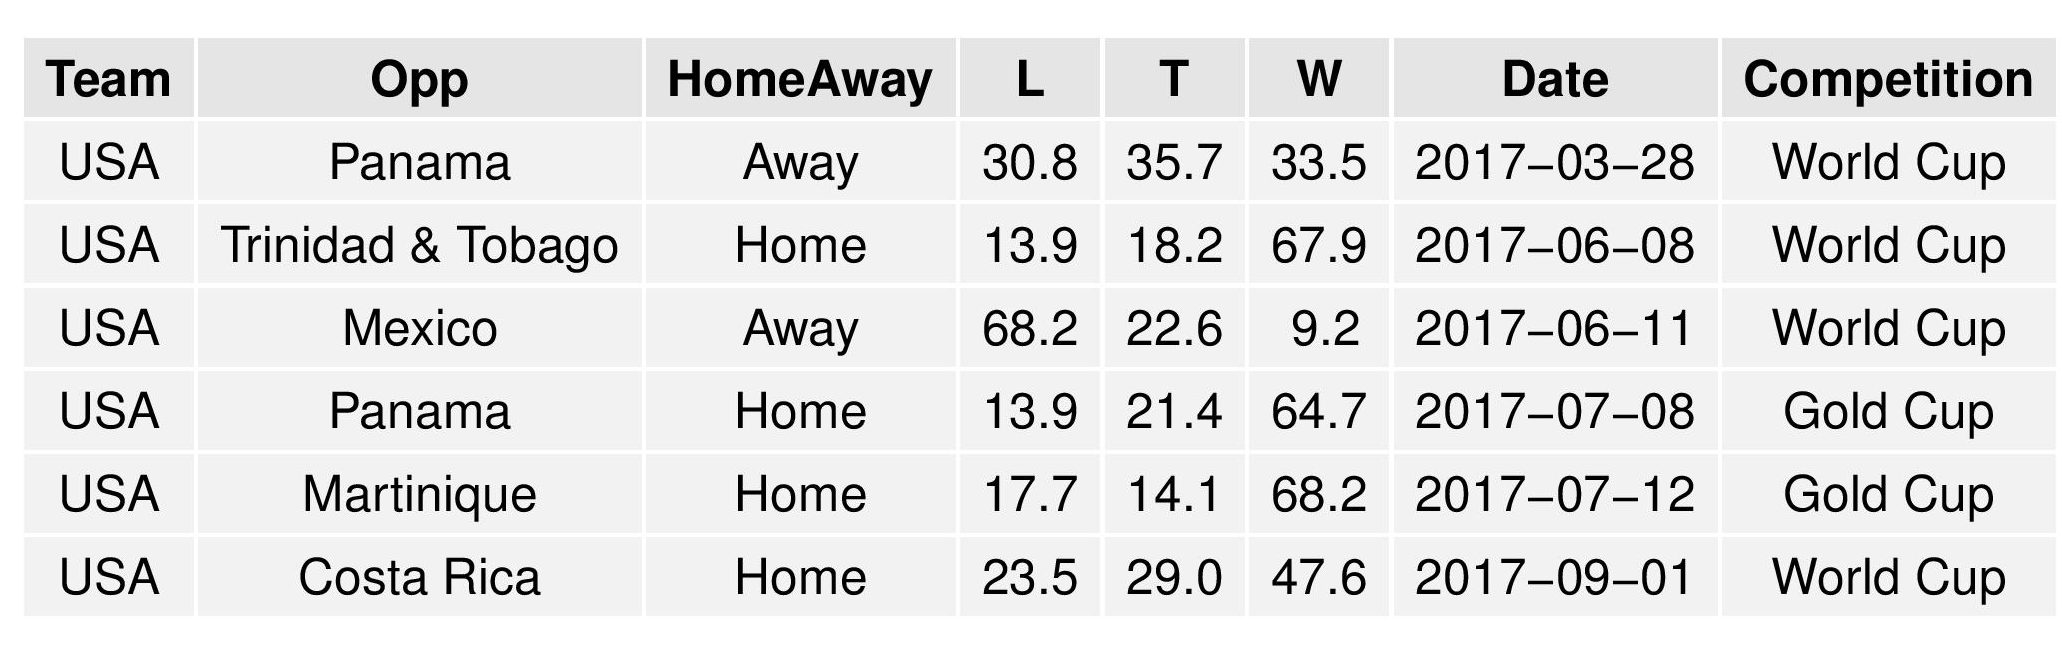
Finally, the following shows the probabilities of results for upcoming USA matches.
World Cup Qualification Results
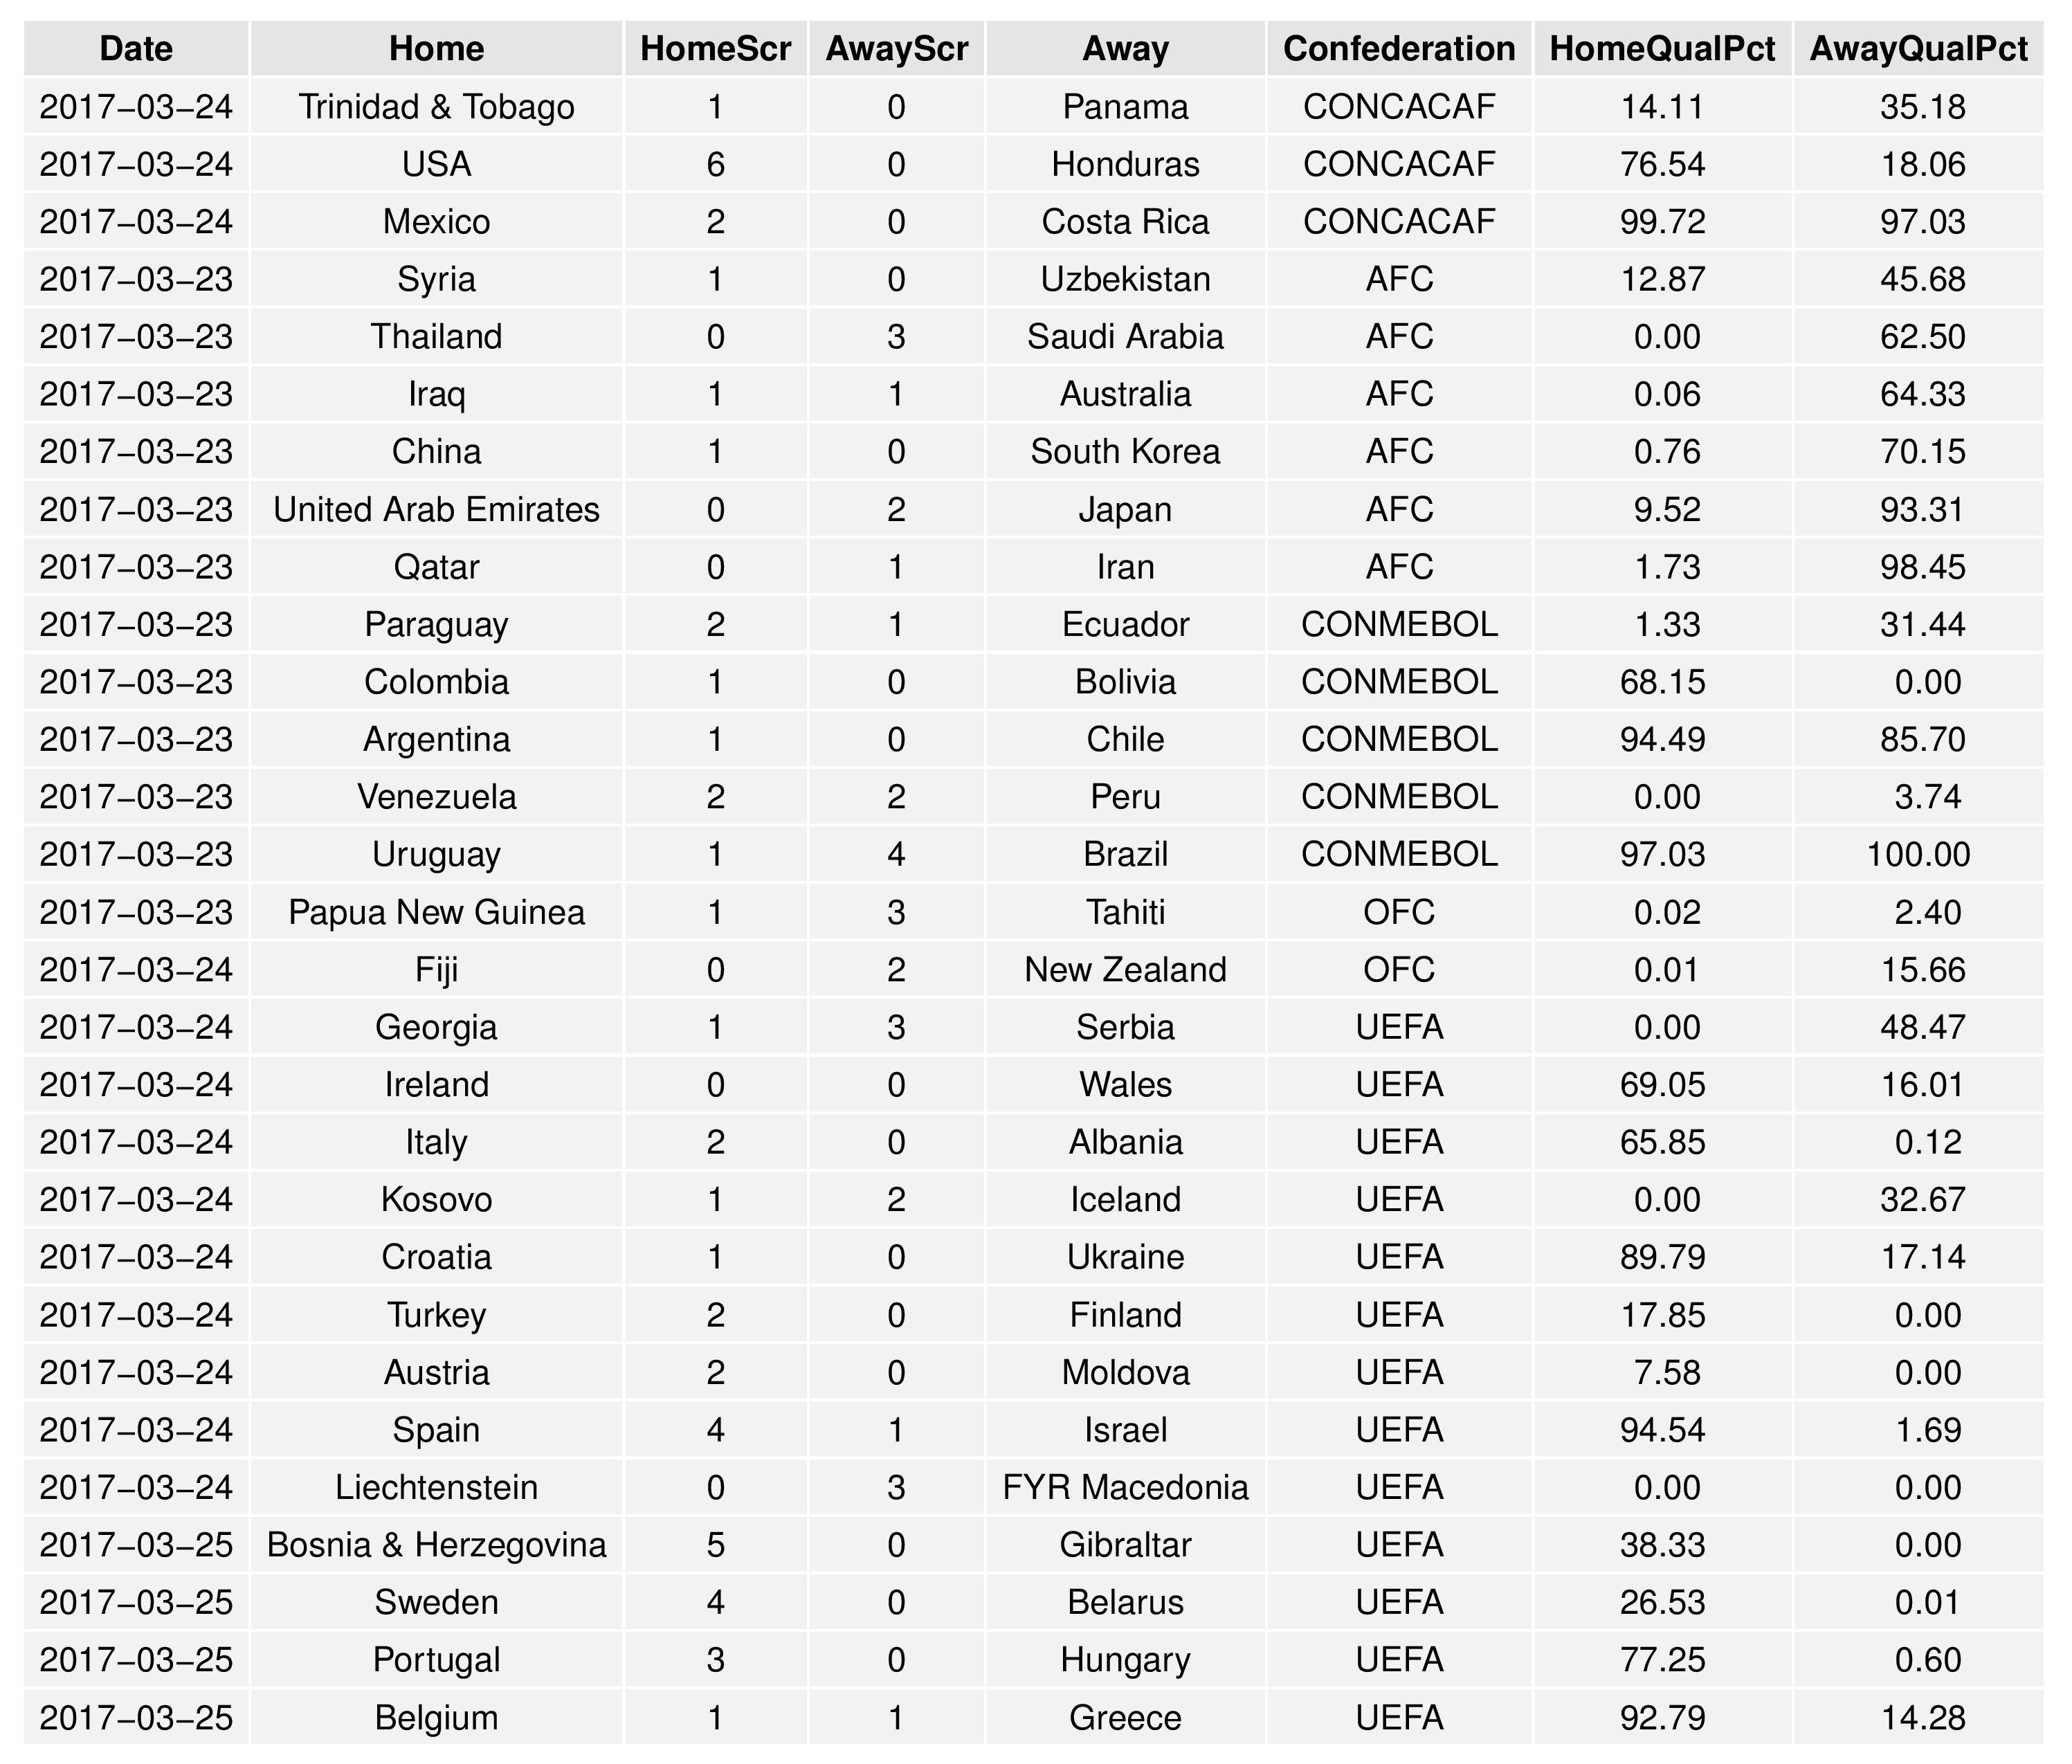
The following just shows the most recent World Cup Qualification matches included in the model by federation, accompanied by their current qualification odds.


From a FIFA Rankings standpoint, it can actually be better for a team to not qualify for the next round of a tournament. Compare Portugal and the US in the 2014 World Cup. Both had the same records against Ghana and Germany. The US got a few more points for the draw against Portugal than Portugal got for the same game since the US played the higher ranked opponent. However, that was the end of the line for Portugal where the US played one more game, a loss against Belgium, which averaged a big fat 0 into the US ranking. If Portugal had the better goal differential, they would have qualified for the round of 16 and the US probably would have ended up with a few more points. That seems like a MAJOR flaw in the system.
While you definitely make a good point about the peculiar results of FIFA’s system, and I more typically like trashing their system, I think your argument is based upon the assumption that the Belgium match was inevitably a loss. If the USA had managed even to lose that match by PK’s instead of in regulation/extra time, it would have been worth considerably more points than even a win against Belgium in a friendly. A 4.0 multiplier for match importance (compared with a 1.0 for friendly), a UEFA bonus for the confederation multiplier, and a high-ranking Belgium team gave the extra match a huge amount of potential points.
Very informative discussion of the FIFA ranking system. Much obliged. Good stuff.
Having read this I thought it was rather enlightening.
I appreciate you taking the time and effort to
put this content together. I once again find myself spending a significant amount of time both reading and commenting.
But so what, it was still worthwhile!