I apologize for the absence of these updates after the second round of matches. My computer was in the shop so I was unable to maintain the simulation system as I wished.
Welcome to the International version of the Statistical Extrapolation Bayesian Analyzer Projection System, which is, of course, a tortured gathering of words used to create the SEBA Projection System.
The system consists of a model projecting the probabilities of game results and then a barrage of simulations which account for the remaining luck. So the probabilities you see below show, essentially, what the odds are of an outcome if the team continues to play like it has been.
Below are the current Copa America tournament forecasts using data from games through June 13, 2016.
Rooting Guide
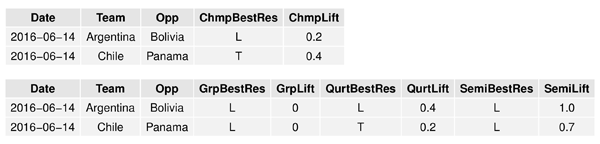
The first table below shows which result is better for the USMNT for each of the first round of games in terms of their winning the Copa America Centenario.
The second table shows how each result affects other goals (such as advancing from Group, winning the Quarterfinal, and winning the Semifinal) as these goals are not always aligned with the championship.
The BestRes column is the ideal result (for that objective) from the “Team” perspective.
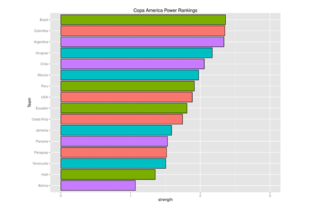
Power Rankings
The “Power Rankings” we concoct are the actual “strength” of the team according to competitive expectations:
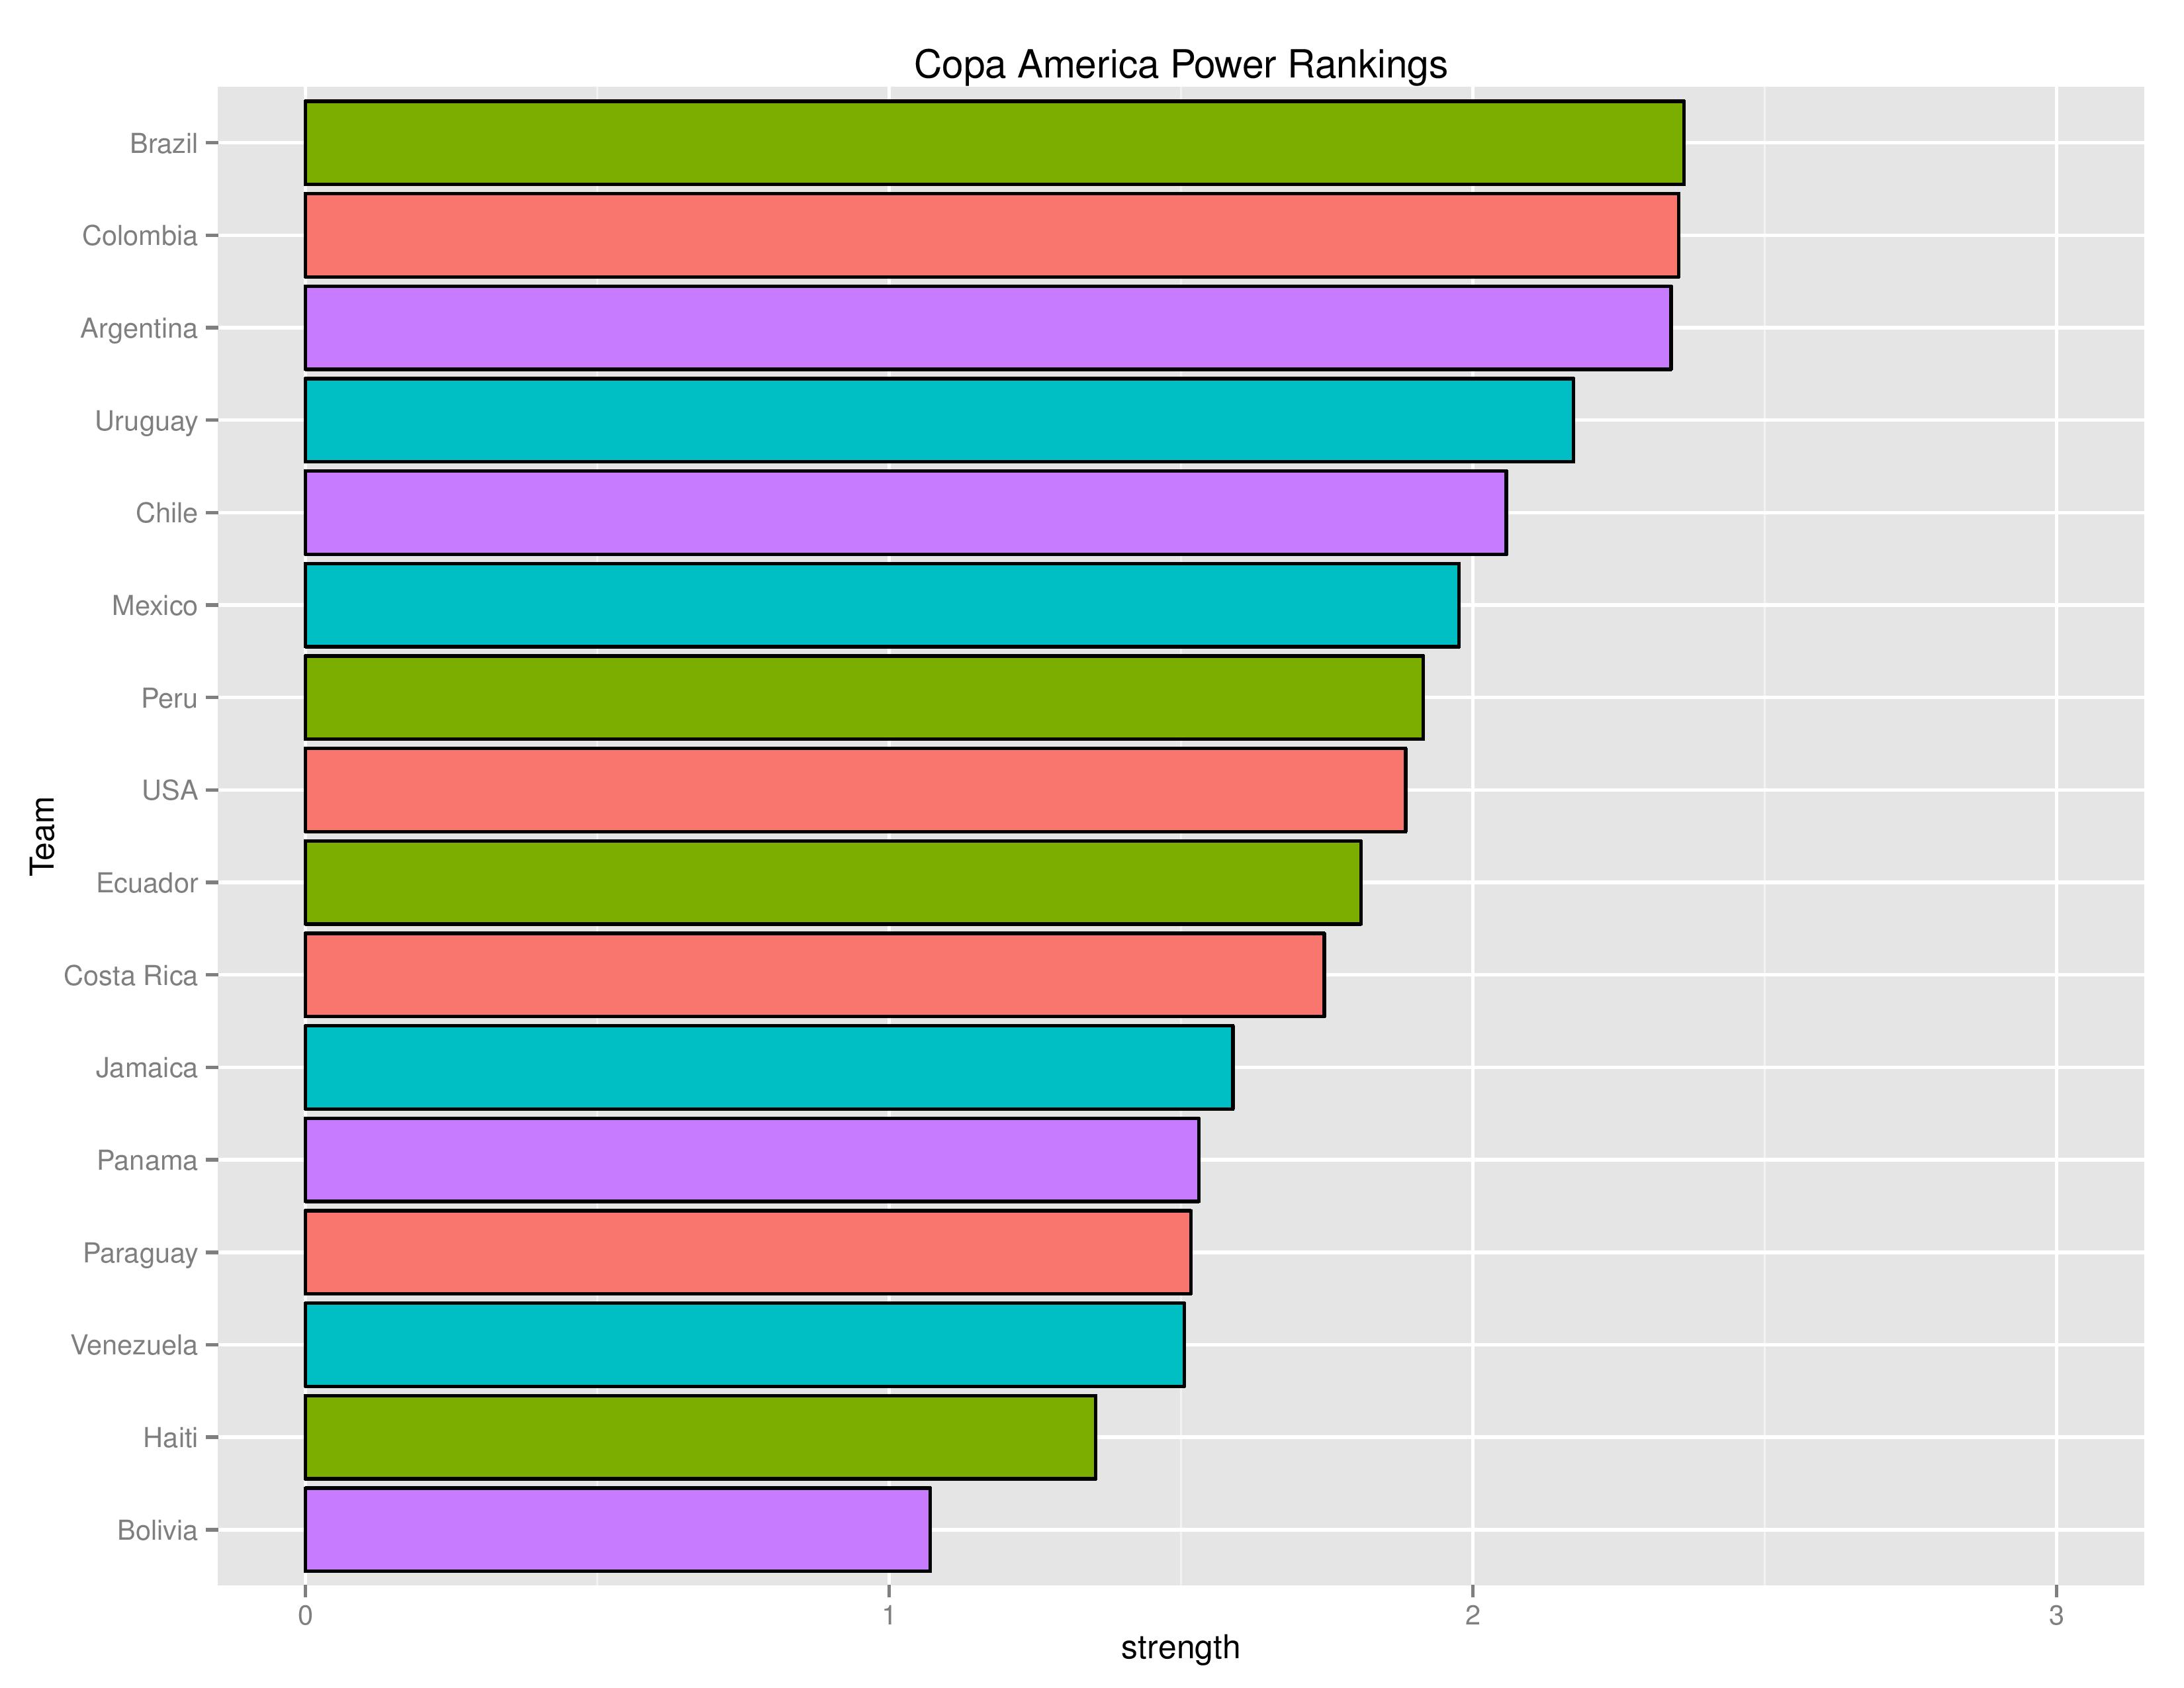
USA remained the same in the Copa America power rankings from the last updates. The ranking changes were that Panama moved ahead of Paraguay and that Venezuela moved ahead of Haiti.
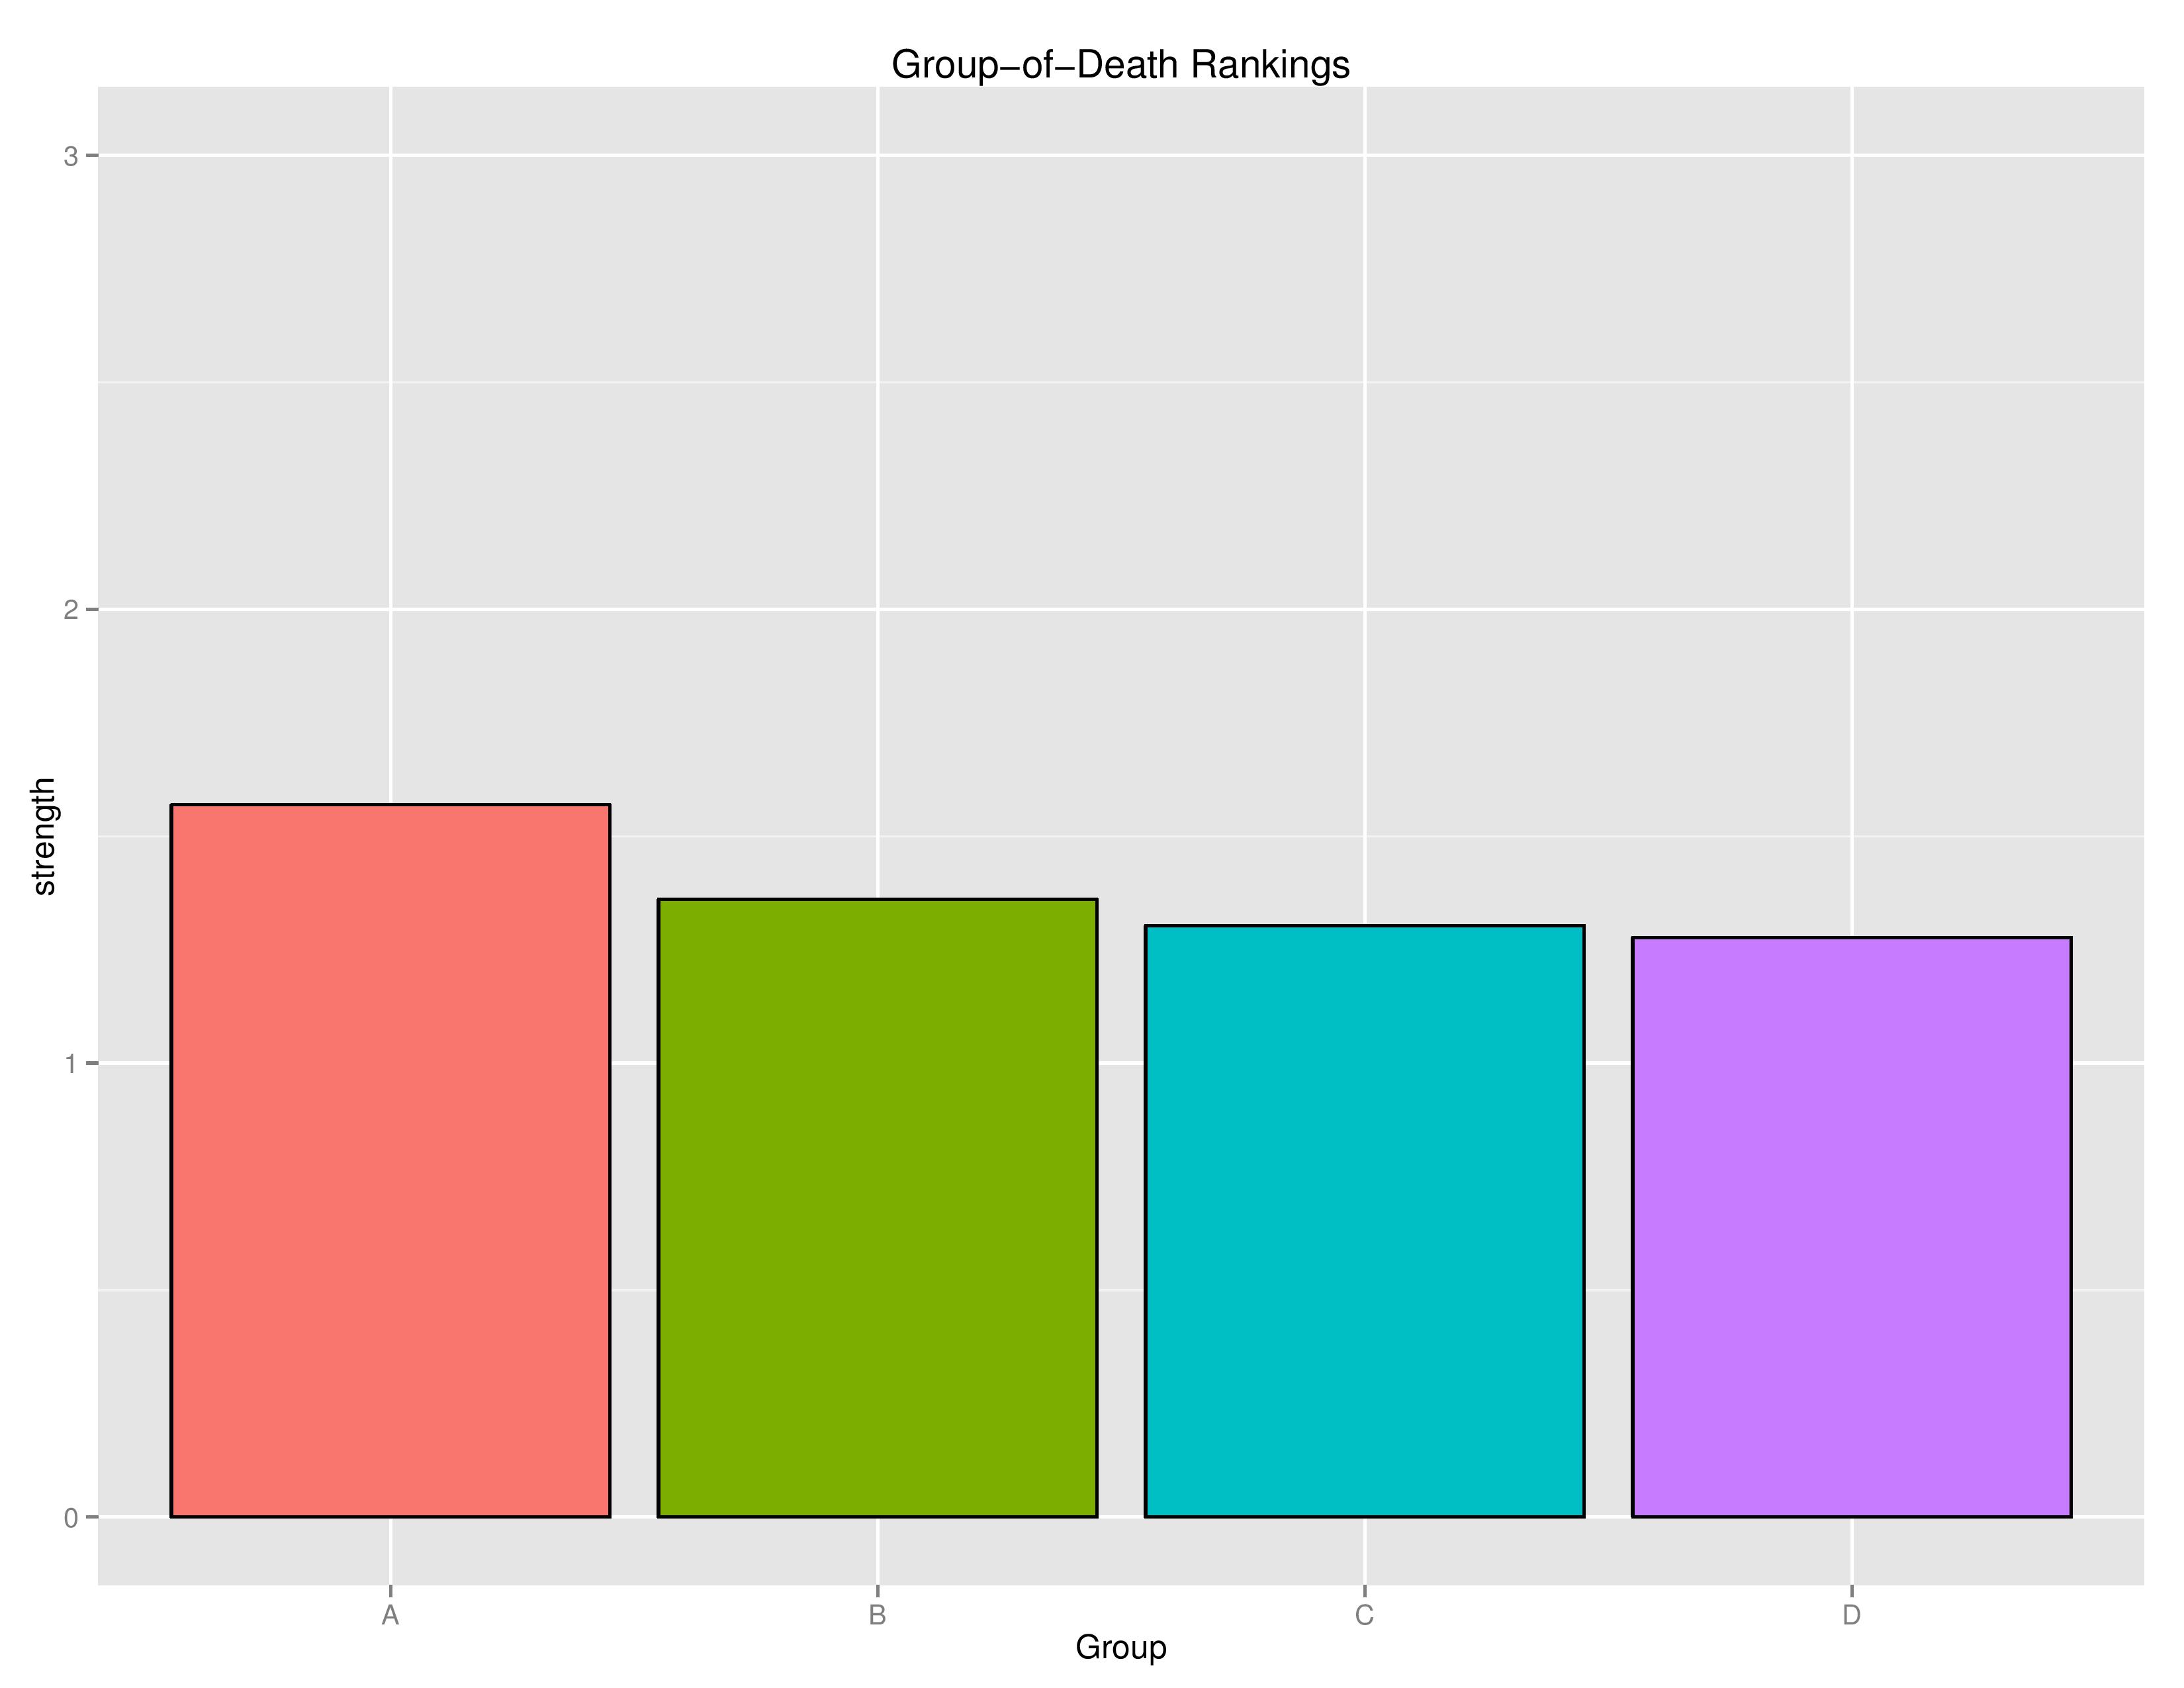
Group A is clearly still the group-of-death containing USA, Colombia, Costa Rica, and Paraguay. This is largely because it lacks a clear weak opponent such as Bolivia, but nevertheless contains one of the best teams in the World in Colombia as well as the tournament host in the USA.
Probability Outcomes
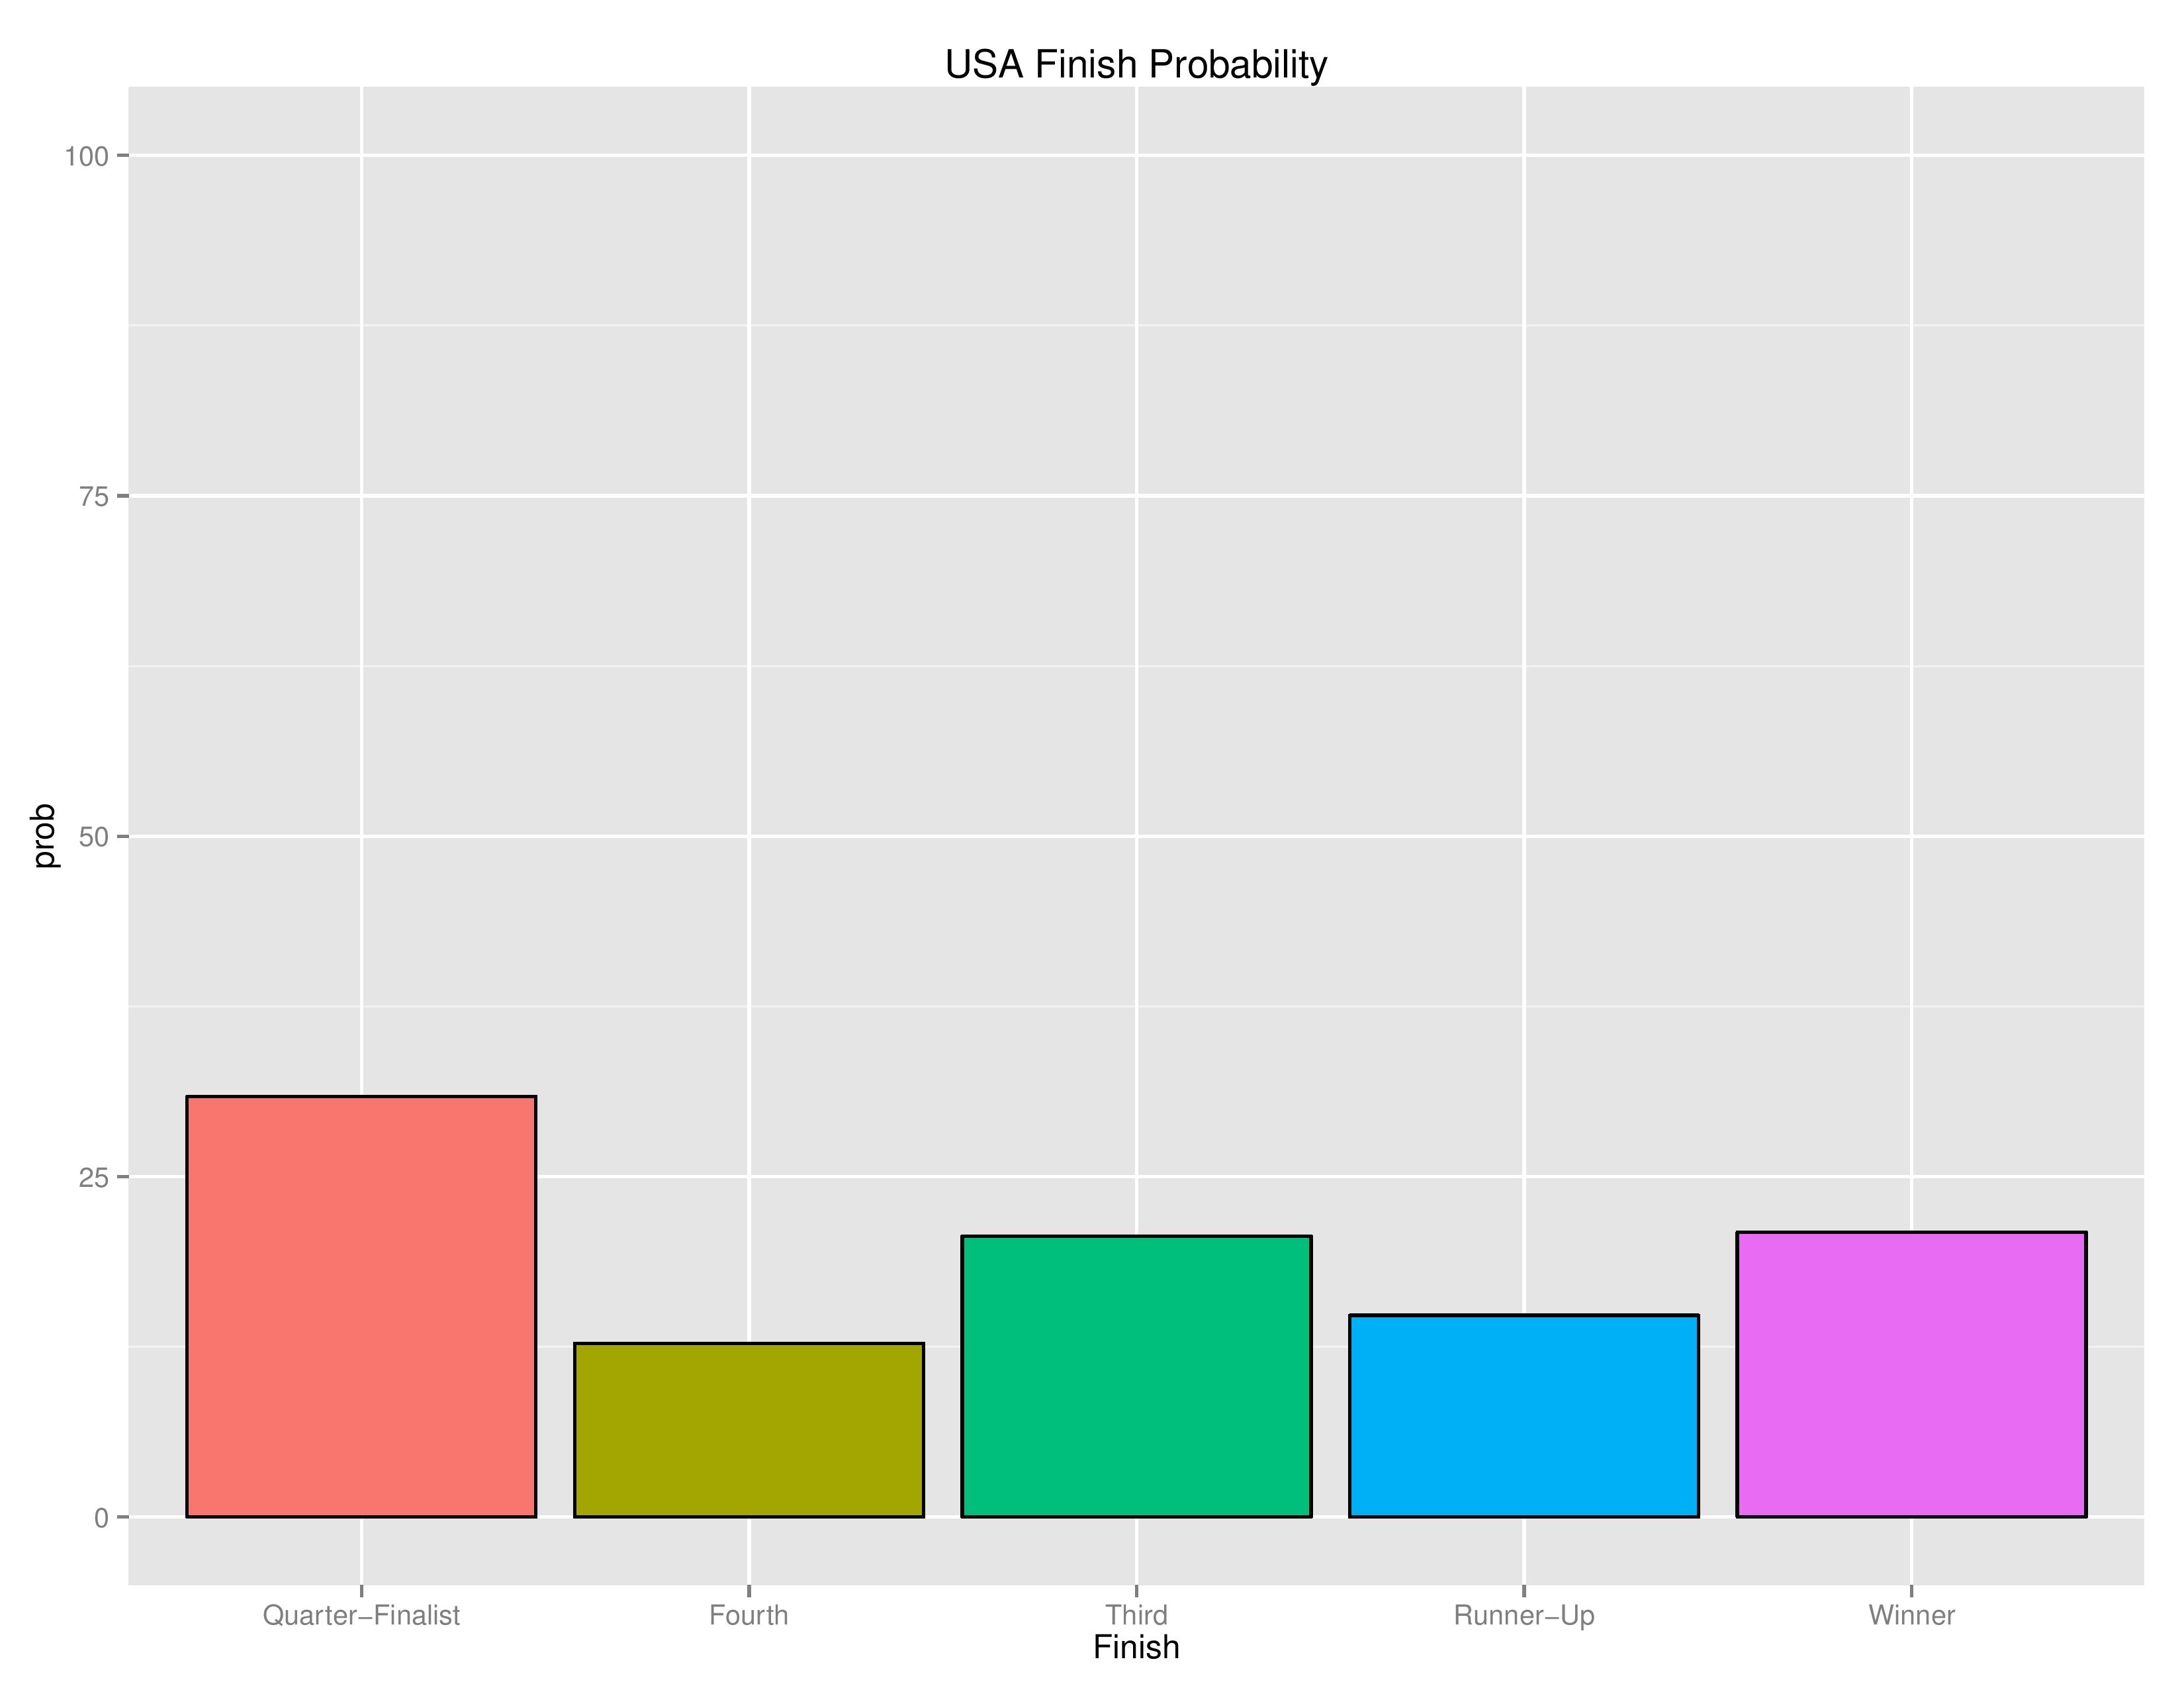
The chart above shows the probabilities of the USA team finishing in different outcomes. USA, obviously, no longer can be a “Group-Stage Participant” as they have won their group.
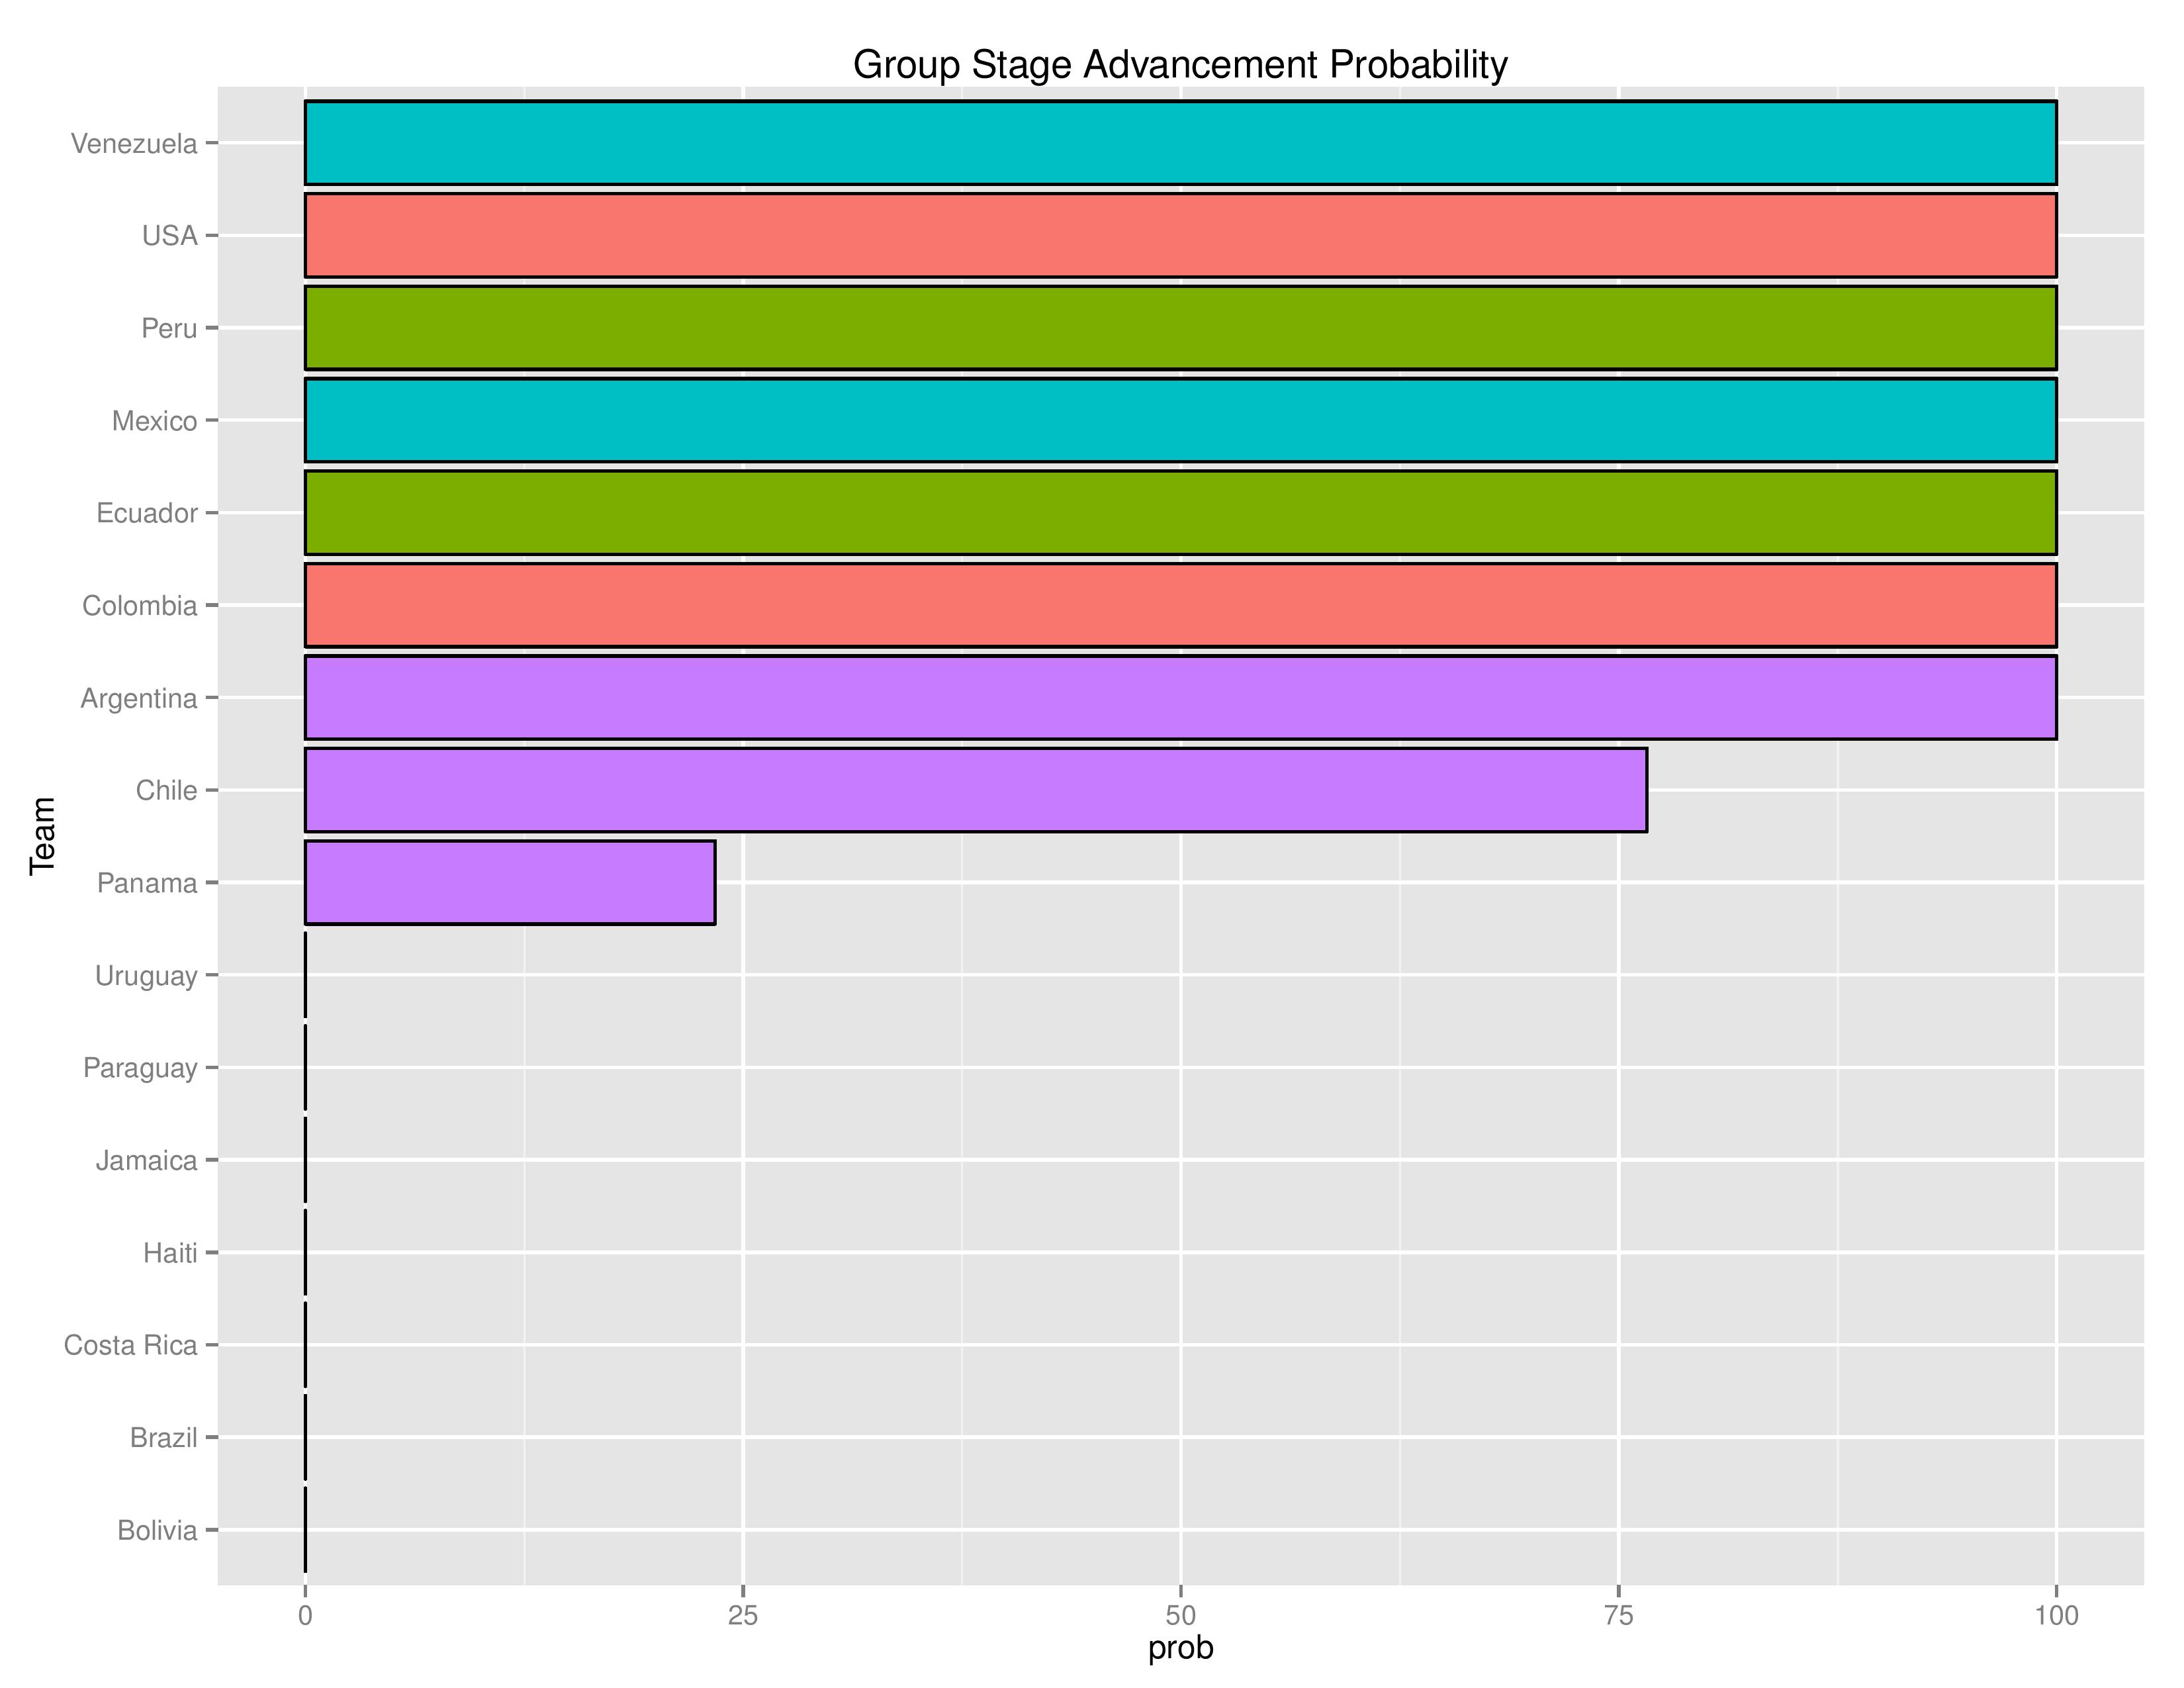
This shows the probabilities of each team advancing through the group stage with the colors designating the group the team belongs to. With the exception of Group D’s battle between Chile and Panama, the advancing teams have already been decided.
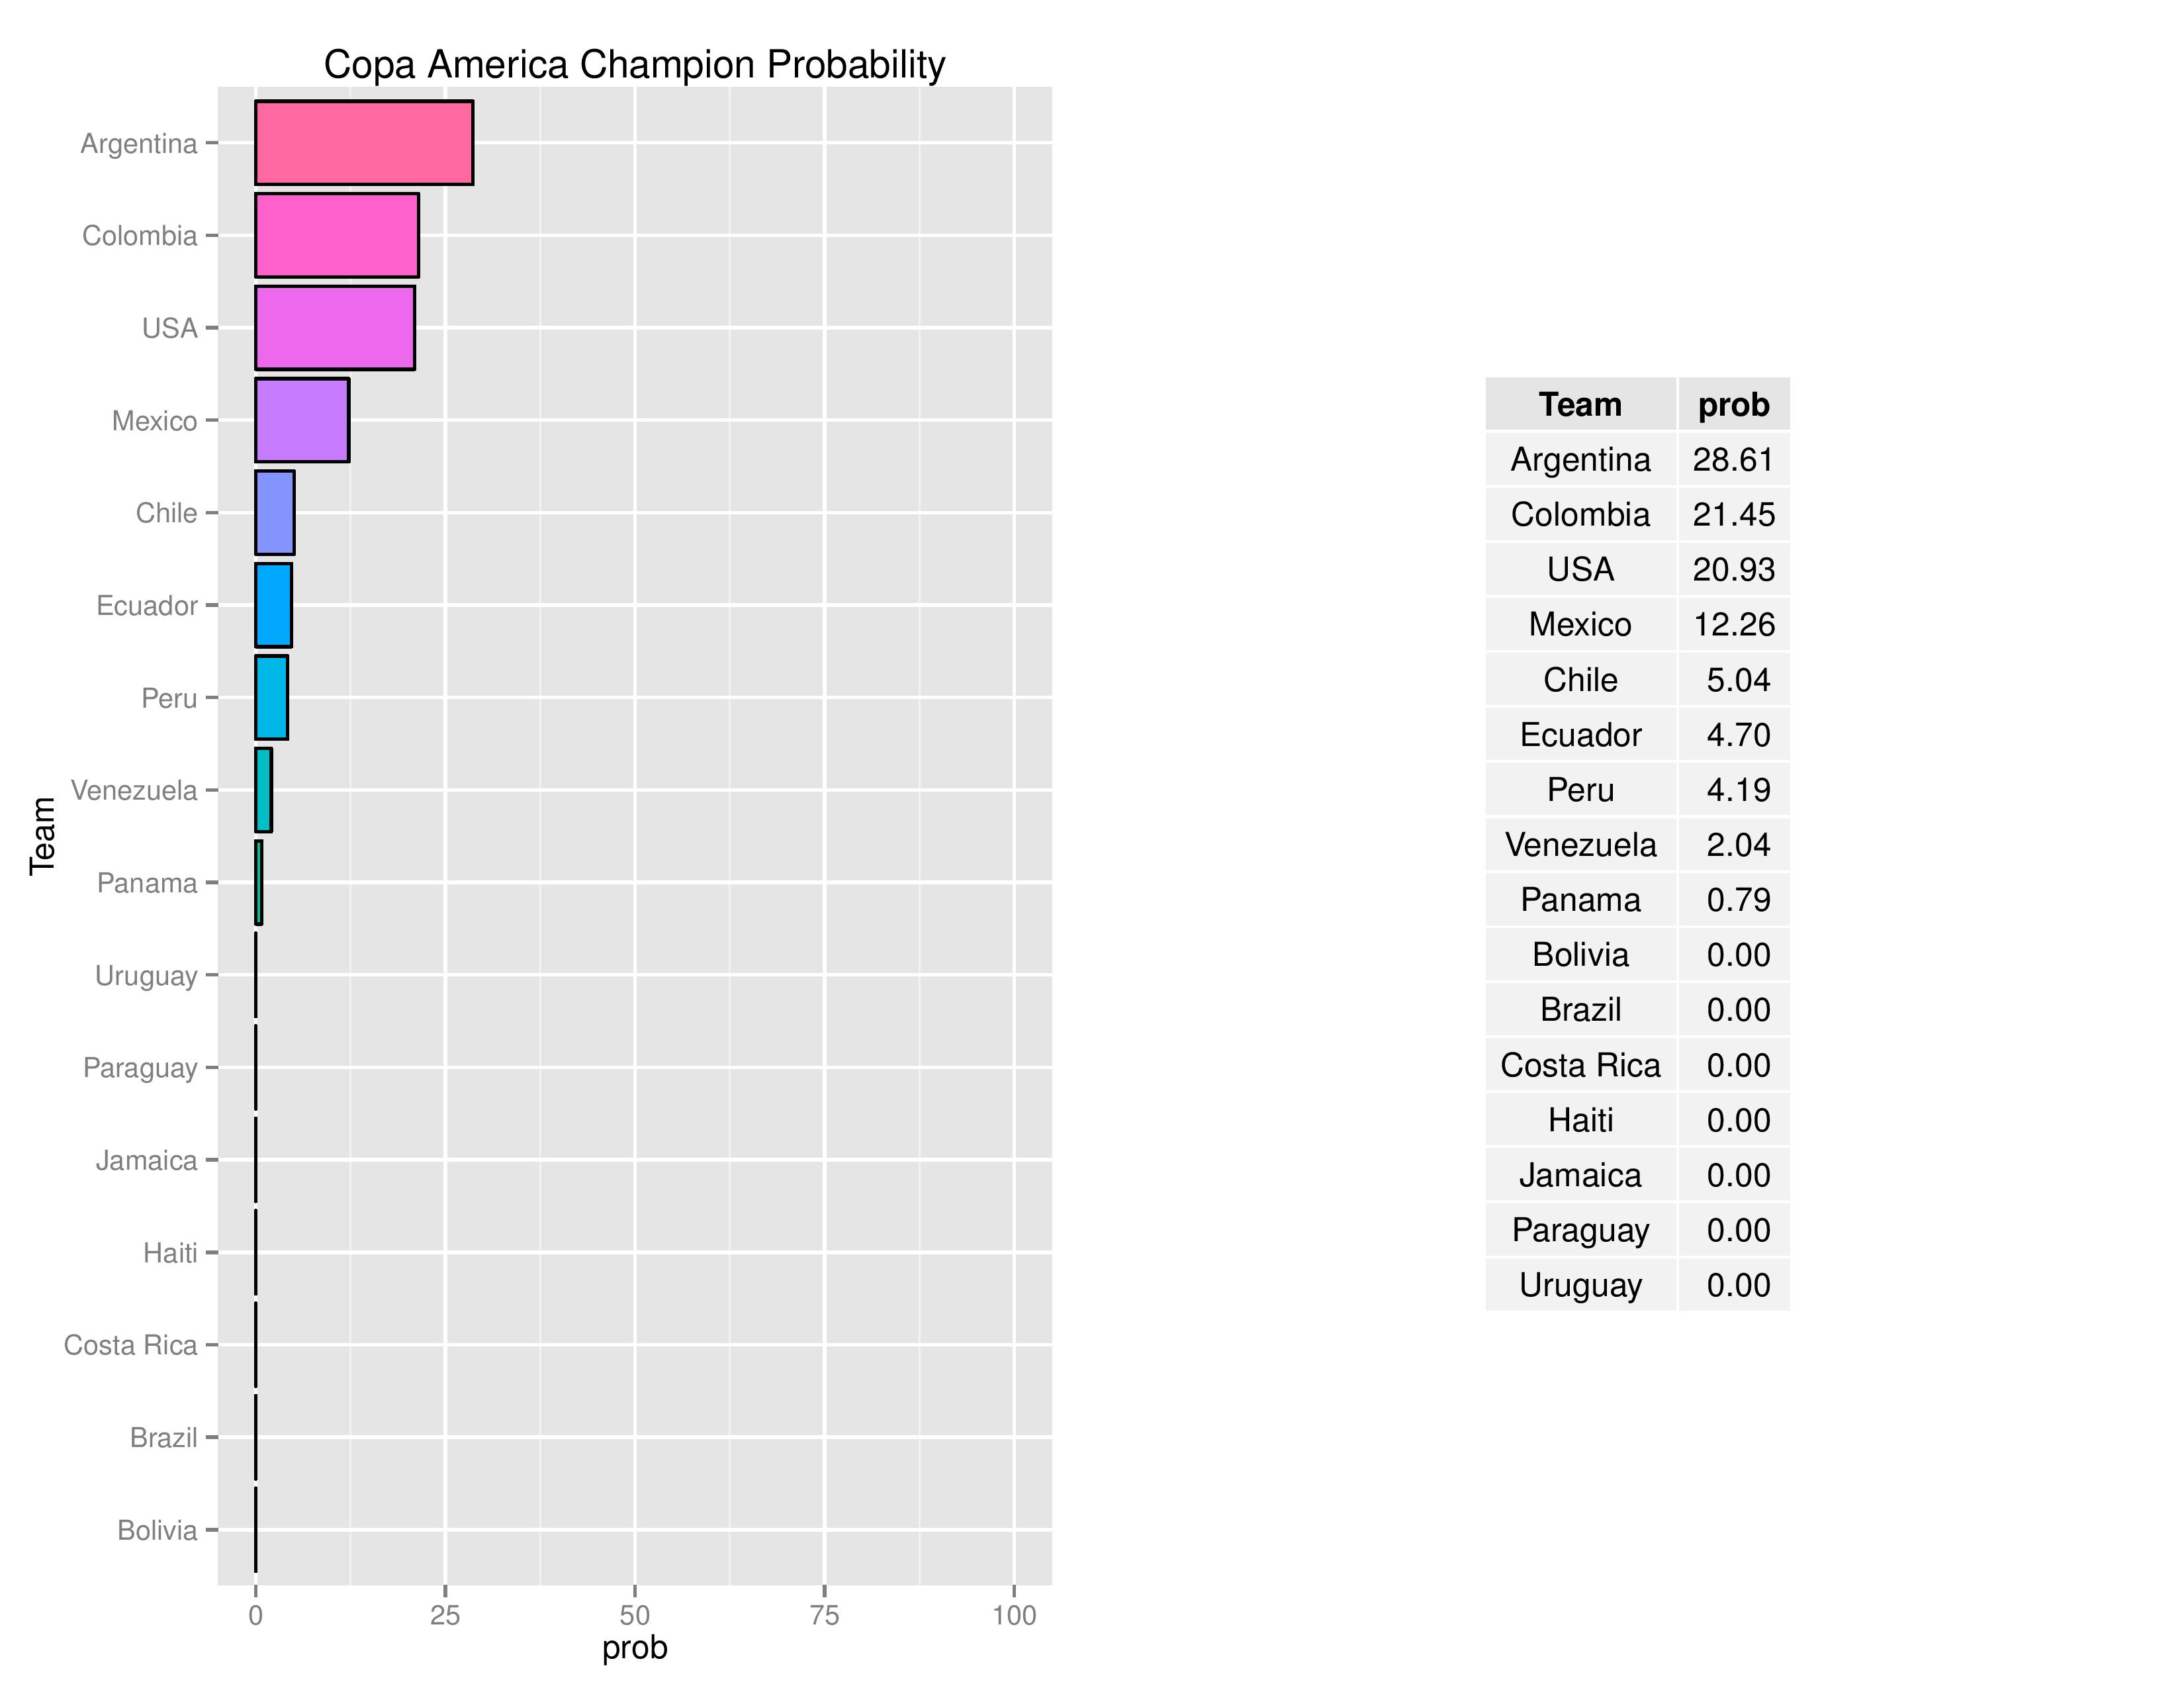
USA’s increase in championship odds improved from 8.9% post-Colombia-match to 20.93% due to their advancement from the group and their lucking in to a much easier schedule than previously expected.
Opponent Probabilities
Below we can see, as the tournament progresses, who the USMNT will likely be playing at each stage (assuming they make it to the stage in question)
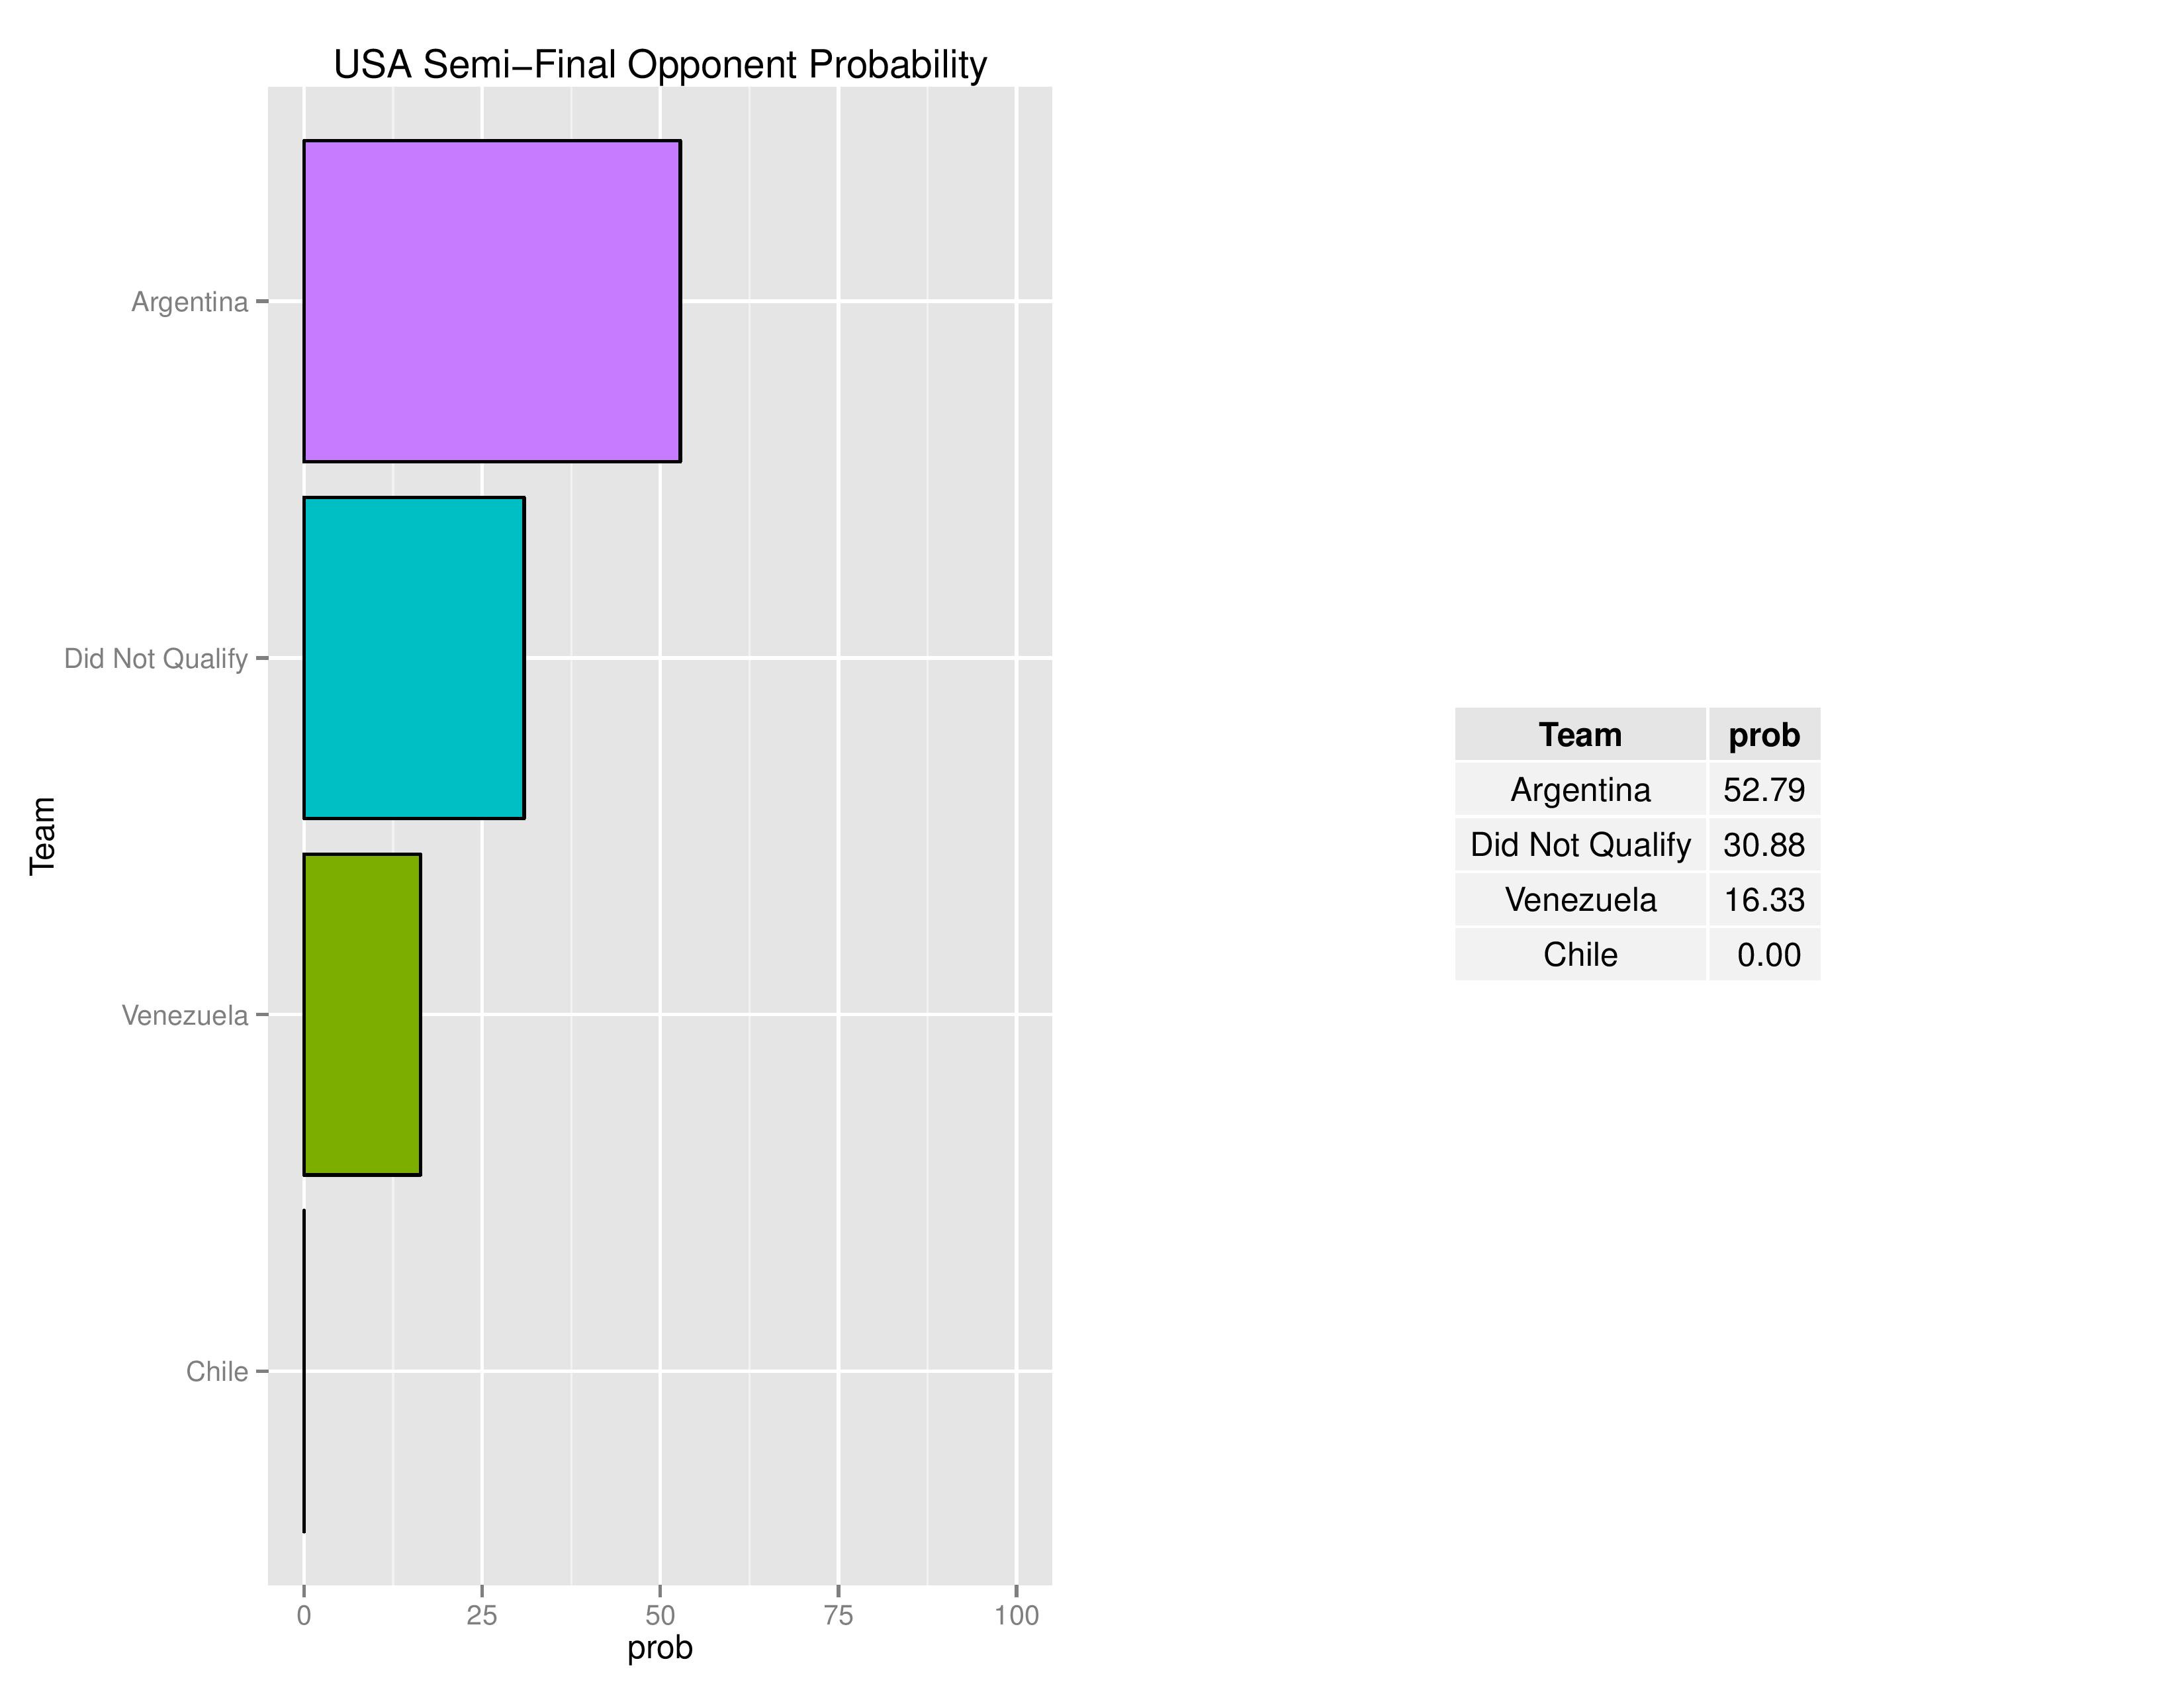
Chile is included because, in 20,000 simulations, they managed to show up exactly once. This would only occur if both Bolivia defeats Argentina tonight AND Chile defeats Panama by 5 goals (perhaps less depending on goal-differential in Bolivia-Argentina)
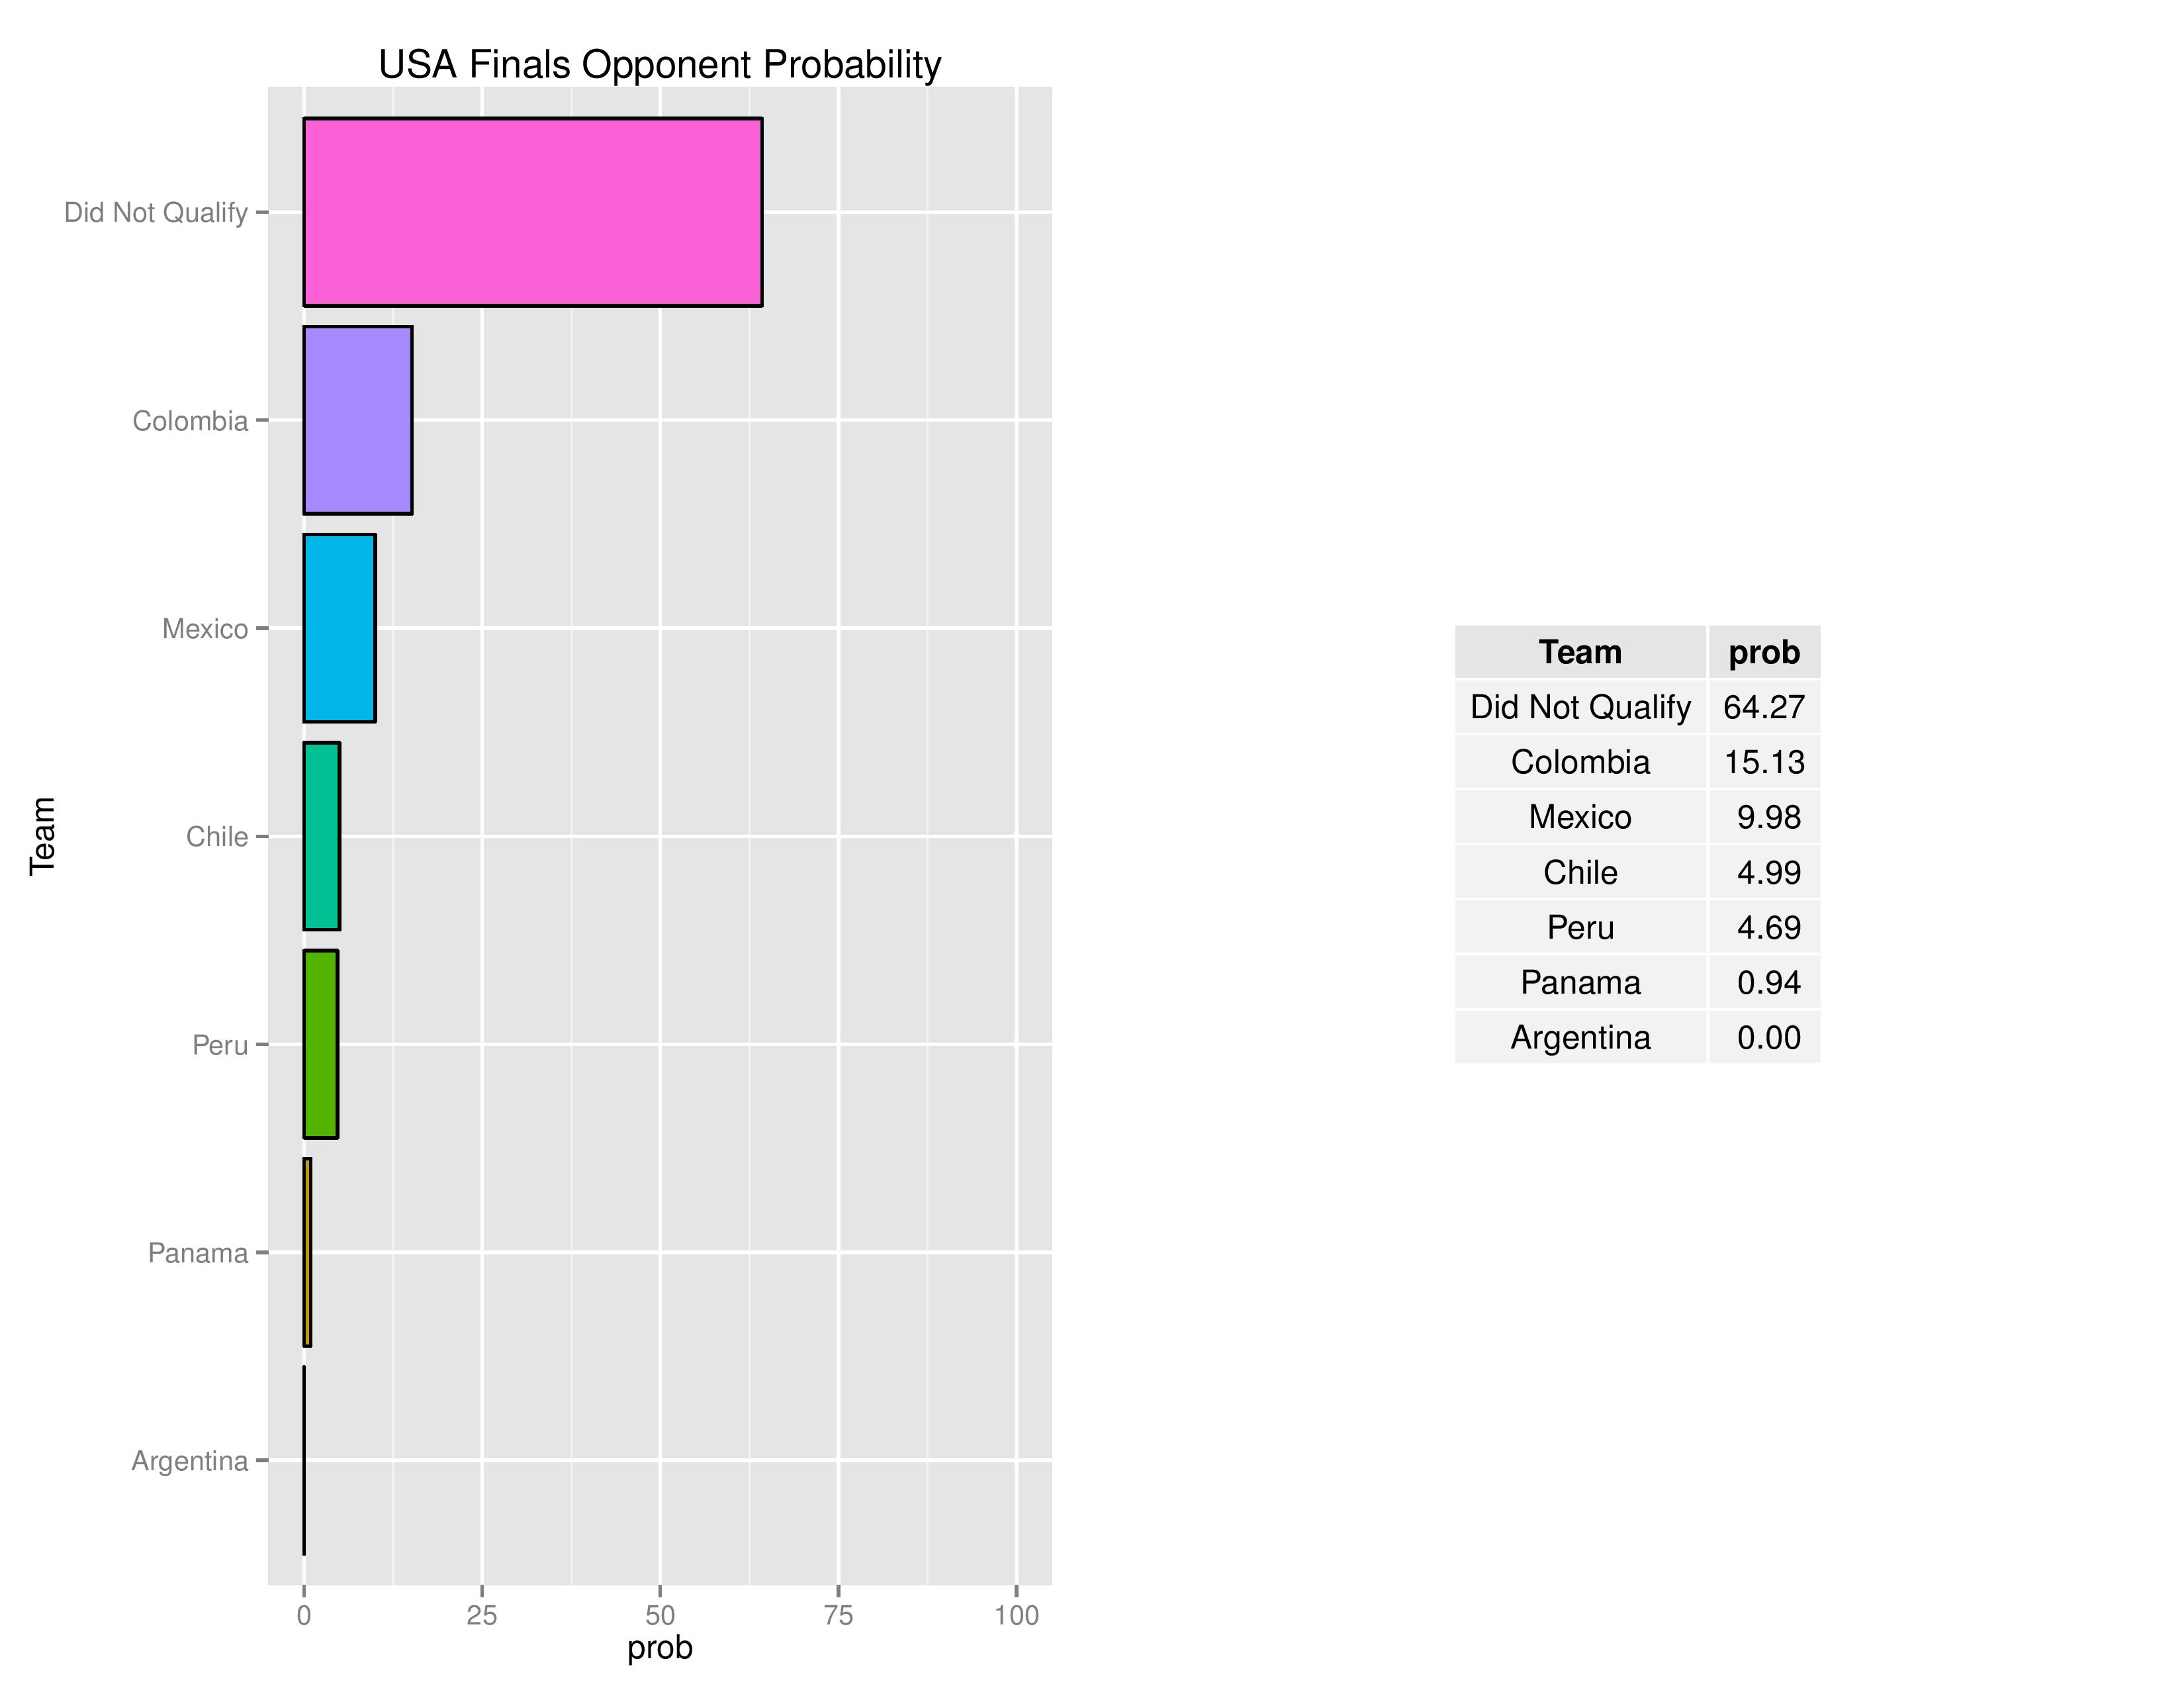
Again, Argentina’s inclusion in this chart is for the same reason as Chile’s inclusion in the previous graphic
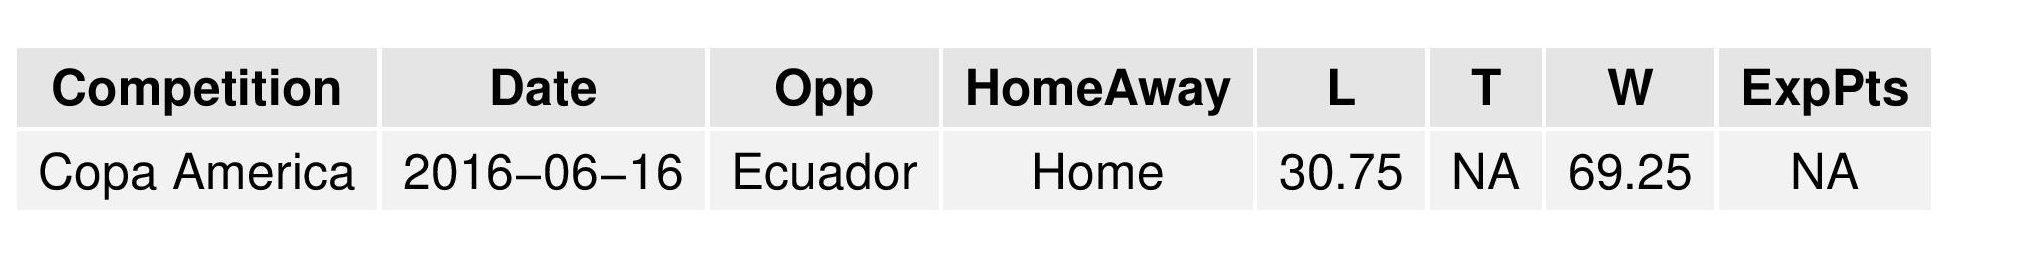
The following shows the expected probability distribution of results for USA’s next match. USA is expected to have nearly a 70% chance of defeating Ecuador in the quarter-final.
And, finally, the following shows the rest of the probability expectations for scheduled Copa America games:
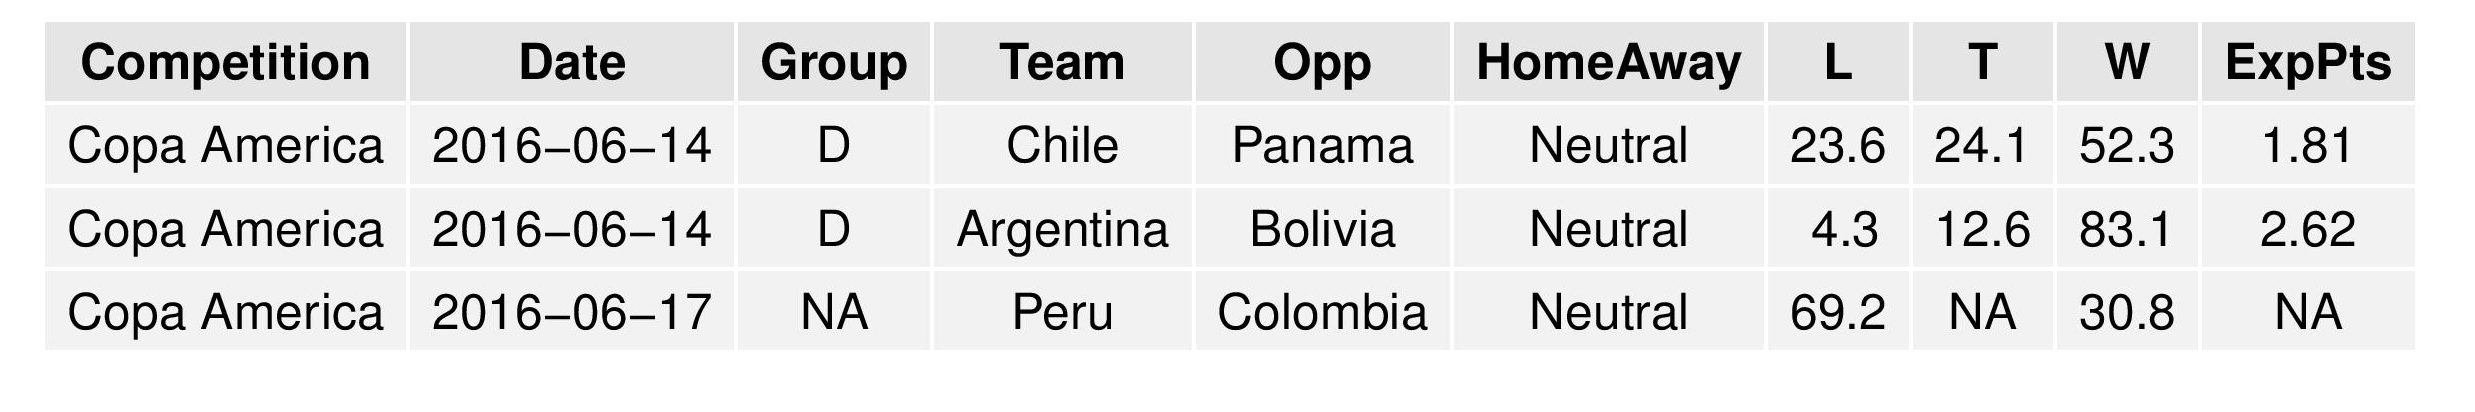

I’m surprised that this is basically predicting one of the US’s most likely outcomes is to beat Mexico or Chile in the 3rd place game. I would have thought it more likely that either of those teams would beat the US.
Yeah, so I looked it up. In neutral territory, the model says Chile would have a 53% chance against the US and Mexico a 57% chance. With USA as the host, the model gives Chile a 33% chance and Mexico a 41% chance. We all know that, in Glendale, Mexico would probably have the real home-field-advantage, but unfortunately I can’t keep up with that kind of manual adjustment for every team in the world (which is what the model is doing). So take as you will, but I think the projections are reasonable.